
Augmented Reality Market Outlook: Size, Share, Trends, Growth Analysis, Competitive Landscape & Forecast, 2026-2033

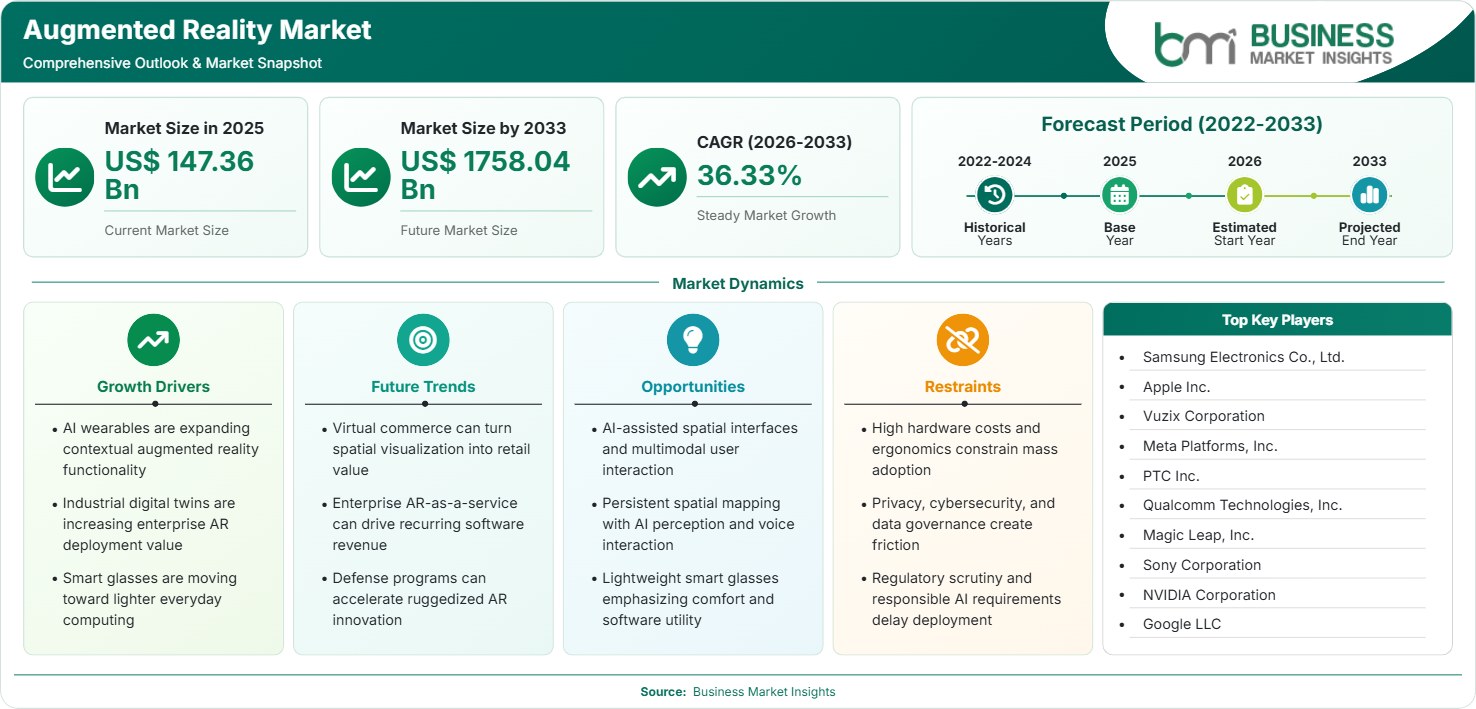
The Augmented Reality Market size was valued at US$ 147.36 Billion in 2025 and is projected to reach US$ 1758.04 Billion by 2033, growing at a CAGR of 36.33% during 2026–2033, driven by AI-enabled interfaces, spatial computing, enterprise digitization, immersive commerce, industrial visualization, and smart-glass ecosystems.

Report Coverage
  • Industry: Gaming, Media, Automotive, Retail, Healthcare, Education, Manufacturing, Real Estate/Architecture Design, Defense & Aerospace, Art & Designing, Law Enforcement
  • Application: Interactive Showroom, Driving Experience, Virtual Fitting Room, Brand Engagement, Space Visualization and Virtual Tours
US$ 147.36 Bn Market size in 2025
US$ 1758.04 Bn Market Size by 2033
36.33% CAGR, 2026 - 2033
2026-2033 Forecast Period

AI Overview

Augmented Reality Market Summary

  • North America Region: North America holds market share of 32%–35% in 2025, growing with a CAGR of 34%–37% during 2026–2033, influenced by enterprise software adoption, AI integration, defense programs, retail visualization, healthcare applications, developer ecosystems, and strategic investments in spatial computing platforms. The US remains the principal contributor, supported by major technology companies and advanced enterprise deployment.
  • Fastest Growing Region: Asia Pacific holds market share of 29%–32% in 2025, growing with a CAGR of 39%–42% during 2026–2033, driven by manufacturing digitization, consumer electronics capabilities, mobile ecosystem penetration, automotive innovation, smart-city investment, expanding developer communities, and accelerating demand for immersive retail and education experiences across China, Japan, South Korea, and India.
  • Leading Segment: Gaming holds market share of 22%–25% in 2025, growing with a CAGR of 33%–36% during 2026–2033, supported by location-aware experiences, mobile cameras, spatial interaction, immersive storytelling, creator platforms, wearable integration, multiplayer engagement, and continued investment in real-time 3D content and increasingly sophisticated consumer experiences across global entertainment ecosystems.
  • High Growth Segment: Virtual Fitting Room holds a modeled share of 7%–10% in 2025, growing with a CAGR of 41%–44% during 2026–2033, supported by visual commerce, apparel personalization, lower return risks, digital merchandising, smartphone camera capabilities, recommendation engines, social commerce, and retailers seeking measurable conversion improvements through interactive product discovery and personalized purchasing journeys.
  • Key Market Opportunity: The strongest opportunity lies where lightweight AI glasses, spatial mapping, computer vision, and enterprise software converge, enabling hands-free workflows, contextual assistance, remote expertise, product visualization, training, and immersive commerce at scale.
  • Major Market Players: Samsung Electronics Co., Ltd.; Apple Inc.; Vuzix Corporation; Meta Platforms, Inc.; PTC Inc.; Qualcomm Technologies, Inc.; Magic Leap, Inc.; Sony Corporation; NVIDIA Corporation; Google LLC.
Strategic Insights

Augmented Reality Market: Strategic Insights

Augmented Reality Market Strategic Framework
FREE PDF
Request your free sample
Request free sample
Stakeholder View

Key Takeaways

  • The value chain is becoming increasingly integrated, with optical components, microdisplays, processors, AI models, operating systems, spatial engines, cloud infrastructure, and application software converging around device platforms. Companies controlling several layers can improve performance optimization, developer adoption, and recurring software monetization.
  • Gaming remains a substantial demand generator, but enterprise applications offer broader monetization pathways because manufacturers, healthcare providers, retailers, logistics operators, and automotive companies can connect AR deployments directly to productivity, visualization, training, service, and customer-experience objectives.
  • The technology trajectory is moving from marker-based overlays toward persistent spatial mapping, AI-powered perception, voice interaction, gesture recognition, eye tracking, contextual computing, and multimodal assistants. Meta’s AI glasses development and Google’s Android XR strategy demonstrate the convergence of wearable computing and generative AI.
  • Asia Pacific presents an attractive investment case because semiconductor manufacturing, electronics assembly, automotive production, mobile-device penetration, and digital commerce create multiple channels for AR commercialization. South Korea, Japan, China, and India can support both component production and downstream application development.
  • Capital is increasingly favoring platforms that combine AR with AI, waveguides, spatial computing, digital twins, and enterprise workflows rather than isolated visualization applications. Vuzix’s 2025 progress with Quanta Computer illustrates growing attention to manufacturing partnerships and scalable smart-glass supply relationships.
Geographic Outlook

Augmented Reality Market Regional Highlights

North America Augmented Reality Market

North America held a 32%–35% Augmented Reality Market share in 2025 and is modeled to grow at a 34%–37% CAGR during 2026–2033. The region benefits from strong software ecosystems, venture investment, defense modernization, advanced healthcare infrastructure, and large enterprise technology budgets. The US represents approximately 75%–78% of regional demand, supported by Apple, Meta, Google, NVIDIA, PTC, Qualcomm, and Vuzix. Enterprise deployments emphasize training, remote assistance, visualization, and digital-twin workflows. NVIDIA’s spatial-computing initiatives illustrate the growing integration between immersive interfaces and industrial simulation environments.

  • Enterprise buyers increasingly prioritize measurable productivity outcomes, making remote assistance, technician guidance, and visualization stronger commercial propositions than novelty-driven applications.
  • Defense and aerospace programs create demand for ruggedized displays, situational overlays, simulation environments, and hands-free information delivery, supporting specialized hardware and software suppliers.
  • Healthcare applications are expanding around medical education, visualization, rehabilitation, and procedural assistance, while data governance remains a key procurement requirement.
  • Consumer adoption is being reinforced by AI glasses, voice assistants, improved cameras, and lighter wearable formats that reduce friction associated with conventional head-mounted devices.

US Augmented Reality Market

The US accounted for approximately 75%–78% of North America’s 2025 Augmented Reality Market share and is modeled to expand at a 33%–36% CAGR during 2026–2033. Its competitive advantage comes from hyperscale cloud infrastructure, semiconductor design, venture funding, defense procurement, enterprise software, and strong developer communities. Apple’s Vision Pro ecosystem, Meta’s AI glasses, NVIDIA’s Omniverse workflows, and PTC’s Vuforia platform demonstrate differentiated routes toward spatial computing commercialization. Apple continued extending Vision Pro capabilities through AI, immersive content, accessibility improvements, and new hardware iterations.

  • Technology companies are increasingly integrating AI assistants with wearable interfaces, enabling contextual information retrieval, translation, navigation, and hands-free communication.
  • Enterprise customers are adopting spatial workflows for engineering, training, design reviews, maintenance, and remote collaboration where visualization can reduce physical prototyping requirements.
  • Defense applications remain strategically important because AR displays can support soldier systems, drone control, navigation, simulation, and mission-specific information delivery.

Europe Augmented Reality Market

Europe represented 24%–27% of global Augmented Reality Market share in 2025 and is modeled to grow at a 35%–38% CAGR during 2026–2033. Germany, the UK, France, and Italy form leading demand centers, while Germany is projected to maintain a comparatively strong industrial adoption trajectory of 36%–39% CAGR. The region’s opportunity is anchored in advanced manufacturing, automotive engineering, healthcare innovation, retail digitization, and industrial training. European deployment decisions increasingly emphasize privacy, cybersecurity, safety, interoperability, and responsible processing of spatial and biometric information.

  • Germany’s industrial base supports AR use in manufacturing, engineering, equipment maintenance, factory visualization, and worker training, strengthening enterprise-focused deployments.
  • The UK provides a strong software and creative-technology ecosystem, supporting gaming, media, education, immersive commerce, and application development across multiple sectors.
  • France and Italy offer opportunities in luxury retail, fashion, automotive design, tourism, architecture, and cultural experiences where interactive visualization improves customer engagement.
  • Regulatory scrutiny encourages privacy-by-design architectures, creating demand for secure edge processing, controlled data flows, explicit consent mechanisms, and auditable AI systems.

Asia Pacific Augmented Reality Market

Asia Pacific accounted for 29%–32% Augmented Reality Market share in 2025 and is modeled to achieve a 39%–42% CAGR during 2026–2033, making it the fastest-growing region. China, Japan, South Korea, and India lead regional commercialization, while India is positioned for a 41%–44% CAGR as digital commerce, manufacturing, education, and smartphone-led experiences expand. Samsung’s Galaxy XR launch illustrates the region’s ability to combine device manufacturing, AI, software ecosystems, and immersive computing into scalable platforms.

  • China benefits from extensive electronics manufacturing, mobile commerce, gaming, industrial automation, and domestic hardware ecosystems that can accelerate AR component and device commercialization.
  • Japan’s automotive, robotics, electronics, entertainment, and industrial design sectors create diverse use cases for spatial visualization, training, simulation, and product development.
  • South Korea combines semiconductor expertise, consumer electronics capabilities, displays, telecommunications, and premium device ecosystems, strengthening its position across hardware and software layers.
  • India offers substantial potential in retail, education, healthcare, manufacturing, logistics, and digital commerce as enterprises seek scalable mobile-first visualization and workforce solutions.

Rest of World Augmented Reality Market

South and Central America represented approximately 6%–8% Augmented Reality Market share in 2025, with regional growth modeled at 31%–34% CAGR during 2026–2033. Brazil and Mexico are pioneering AR implementation through retail applications, automotive industry, gaming, industrial training and marketing. The growing trend towards e-commerce and mobility is opening up distribution channels for such applications, while businesses are evaluating AR based on engagement of consumers, efficiency of workers, and product visualization results.

Market share for Middle East and Africa was roughly 4% to 5% in 2025 with growth forecasted at CAGR of 32% to 35%. Countries such as UAE and Saudi Arabia have spearheaded initiatives within the region through smart city projects, tourism, retail, architecture, construction, and industrial upgrades. Augmented reality finds its applications in visualization intensive development projects.

  • Brazil’s retail and entertainment ecosystems support consumer-facing applications, while industrial users increasingly assess AR for maintenance, training, and technical assistance.
  • Mexico benefits from automotive and manufacturing supply chains, creating opportunities for worker guidance, quality inspection, assembly visualization, and equipment servicing.
  • The UAE is positioned around tourism, premium retail, architecture, real estate, and smart-city experiences that depend heavily on three-dimensional visualization.
  • Saudi Arabia’s large-scale infrastructure and urban-development projects create opportunities for digital twins, construction visualization, immersive planning, and stakeholder engagement.
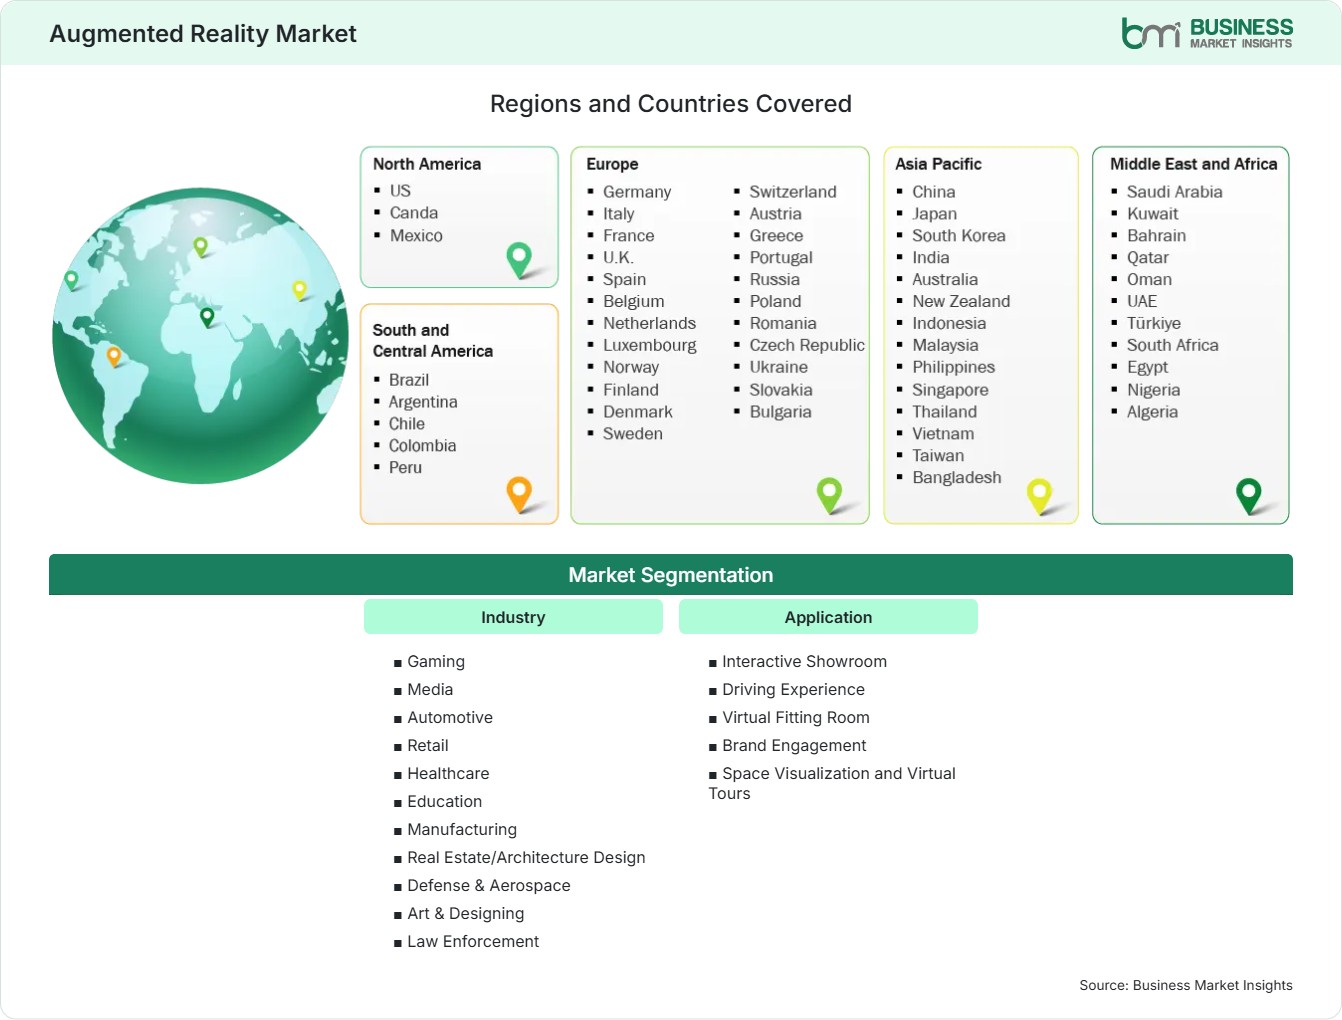
Global Market Geography
FREE PDF
Request your free sample
Request free sample
Segment Analysis

Augmented Reality Market Segmentation

Industry

Industry applications accounted for the larger portion of deployment economics in 2025, with a modeled Augmented Reality Market share of 68%–72% and a 35%–38% CAGR during 2026–2034. Enterprise buyers increasingly connect immersive visualization with measurable productivity, training, customer experience, engineering, design, and operational objectives across diverse sectors.

  • Gaming: Gaming remains a leading application, supported by location-aware experiences, immersive storytelling, real-time interaction, social play, and increasingly capable mobile and wearable hardware that expands interactive entertainment.
  • Media: Media companies use AR for interactive broadcasts, advertising, storytelling, live events, and immersive content, enabling differentiated experiences while creating new sponsorship and audience-engagement formats.
  • Automotive: Automotive manufacturers deploy AR for design visualization, vehicle configuration, sales experiences, training, service guidance, and development workflows that connect digital models with physical vehicles.
  • Retail: Retailers use AR to visualize products, personalize shopping, improve merchandising, support digital catalogs, and create interactive experiences that connect online discovery with physical-store purchasing.
  • Healthcare: Healthcare applications include visualization, medical education, rehabilitation, procedural support, and patient communication, with adoption dependent on clinical validation, privacy, usability, interoperability, and regulatory compliance.
  • Education: Educational institutions employ AR to transform complex concepts into interactive visual experiences, supporting science, engineering, vocational instruction, museums, skills development, and experiential learning.
  • Manufacturing: Manufacturers apply AR to assembly guidance, inspection, maintenance, worker training, remote assistance, and digital work instructions, improving access to contextual information without requiring workers to leave operational environments.
  • Real Estate/Architecture Design: Architects, developers, and property companies use AR for spatial visualization, project review, interior planning, stakeholder presentations, and virtual walkthroughs that clarify designs before physical construction.
  • Defense & Aerospace: Defense and aerospace organizations use AR for training, simulation, maintenance, navigation, mission visualization, and hands-free information delivery, emphasizing ruggedness, latency, security, and specialized integration.
  • Art & Designing: Designers and artists use AR for digital sculpture, spatial composition, visualization, exhibitions, collaborative creation, and interactive experiences that merge physical environments with computer-generated creative assets.
  • Law Enforcement (Government, Logistics): Government and logistics users apply AR to field guidance, asset identification, route support, inventory workflows, inspection, emergency response, and secure information access in operational environments.

Application

Application-driven demand represented a modeled 28%–32% share in 2025 and is projected to expand at a 39%–42% CAGR during 2026–2034. Commercialization increasingly depends on experiences that connect visualization with purchasing, navigation, customer interaction, and physical-space understanding, strengthening the Augmented Reality Market scope across consumer and enterprise environments.

  • Interactive Showroom: Interactive showrooms allow customers to inspect products virtually, compare configurations, explore features, and receive contextual information, reducing physical inventory requirements while strengthening digital engagement and sales conversion.
  • Driving Experience: AR driving experiences overlay navigation, vehicle information, training cues, and simulated environments, supporting automotive marketing, driver education, product demonstrations, and increasingly sophisticated mobility interfaces.
  • Virtual Fitting Room: Virtual fitting rooms enable shoppers to visualize apparel, accessories, eyewear, and cosmetics using cameras and digital overlays, helping retailers personalize discovery and potentially reduce purchase uncertainty and returns.
  • Brand Engagement: Brands deploy immersive AR campaigns to create interactive product experiences, digital collectibles, promotional content, and social sharing opportunities that can increase engagement beyond conventional advertising formats.
  • Space Visualization and Virtual Tours: Spatial visualization enables customers, architects, developers, and investors to explore properties, interiors, infrastructure, and planned environments before completion, improving communication and shortening visualization cycles.
Market Forces

Augmented Reality Market Dynamics

Key Market Drivers

AI-powered wearable interfaces are expanding contextual AR functionality

Artificial intelligence is changing AR from a visual-overlay tool into a contextual computing interface capable of interpreting surroundings, responding to voice, translating information, recognizing objects, and delivering assistance. Google’s Android XR approach clearly pairs Gemini with glasses and headsets, whereas Meta’s latest AI glasses feature multimodal assistance through camera, audio, and display technology. These innovations fuel growth in the market by adding value in the course of performing regular activities, and not confining the gadgets only to visualization purposes. Artificial intelligence also makes the communication process easier due to natural language usage. The resulting Augmented Reality Market trends favor lightweight hardware, local perception, cloud-assisted intelligence, and continuously improving software ecosystems.

Industrial digital twins are increasing enterprise AR deployment value

Digital twins are becoming a practical bridge between AR interfaces and industrial operations because they connect physical assets with persistent digital information. The NVIDIA Omniverse ecosystem is an example of how digital twins based on OpenUSD technology can be useful to companies in terms of enterprise processes, simulation, design, robotics, automotive, and spatial computing. The use of digital twins in such a way makes AR even more economically relevant. Manufacturing companies can use spatial models to compare design alternatives before physical implementation, while service teams can access asset-specific instructions through wearable interfaces. The Augmented Reality Market growth is increasingly going to depend on software interoperability, real-time simulation, spatial data management, and AI-based perception as opposed to hardware requirements alone.

Smart-glass ecosystems are moving toward lighter everyday computing

The wearable technology industry is moving towards designing lighter glasses that can provide artificial intelligence assistance, imaging, audio, contextual data, and targeted visuals without needing bulky headsets. Meta claims to have sold millions of units of the Ray-Ban Meta glasses since its launch and launched the second generation of this product with better battery performance and 3K Ultra HD video recording capability in 2025. Vuzix is developing its AI smart glasses and waveguides for business purposes at the same time. The resulting Augmented Reality Market trends emphasize comfort, battery efficiency, optical quality, hands-free interaction, connectivity, and software utility as central adoption criteria.

Key Market Opportunities

Virtual commerce can convert spatial visualization into measurable retail value

For retailers, there is the chance to incorporate AR technology into product discovery, personalization, visualization, and buying activities. Product virtual trying on, furniture positioning, vehicle personalization, cosmetic visualization, and interactive showrooms can increase certainty ahead of purchase and help retailers make their products more visible. Best commercial examples will be when AR technologies are incorporated into the transaction information, recommendation engines, customer profiles, and inventory systems as opposed to running them as standalone marketing campaigns. In addition, retailers can use spatial interface to integrate the online and offline shopping experience, enabling users to easily go back and forth from online catalogues and physical stores while still having access to products. The Augmented Reality Market Forecasts increasingly favors solutions tied to conversion, engagement, retention, and measurable customer economics.

Enterprise AR-as-a-service can accelerate recurring software monetization

Software providers can develop recurring revenue models by packaging AR applications with device management, analytics, content authoring, remote assistance, digital work instructions, and AI services. This model can reduce the upfront complexity associated with deploying specialized applications across geographically distributed workforces. PTC’s Vuforia strategy illustrates the importance of developer and enterprise tooling, with Vuforia Engine supporting more than 1.5 million developers and a 2025 Enterprise Plan designed for large-scale deployments. Models of the same sort can arise within manufacturing, logistics, field services, healthcare, and aerospace. Investors may prefer firms who have control over deployment processes and ecosystems for data since software revenues do not necessarily depend on the hardware lifecycle anymore.

Defense and aerospace programs can accelerate ruggedized AR innovation

Defense programs create a specialized opportunity for ruggedized AR displays capable of functioning under demanding environmental, connectivity, and security conditions. Vuzix and Collins Aerospace continued a development collaboration that resulted in production approval and delivery of waveguide-based AR display systems associated with US Department of Defense programs, with full-rate production targeted from 2026. Such programs can stimulate advances in optics, power efficiency, thermal management, secure communications, and hands-free interfaces that later migrate into industrial applications. The business potential does not just stop with military procurement as the rugged parts can increase reliability in aviation, emergency services, logistics, utilities, and other conditions where regular consumer electronic devices will not offer enough durability.

Market Restraints and Challenges

High hardware costs and ergonomics constrain mass adoption

Factor: Optical engines, waveguides, processors, sensors, batteries, cameras, and thermal-management systems are advanced technology components that add to the expense and weight of devices. Impact: High costs may prevent penetration into the consumer market and deployment by companies whose workforces include many hundreds or even thousands of people. For instance, the Apple Vision Pro remains an expensive spatial computing technology, with the M5 version retailing at $3,499 in the United States. The problem here does not just lie with the cost of purchasing the device itself; companies need to consider management, software, training, replacements, and content creation. As a result, manufacturers are left with a tough design decision when balancing good image quality, performance, battery life, ergonomics, and cost.

Privacy, cybersecurity, and data governance create deployment friction

Factor: AR devices can continuously capture video, audio, spatial maps, location signals, biometric interactions, and environmental information, creating substantial privacy and cybersecurity exposure. Impact: Businesses and governments can limit deployment where there is any ambiguity around data ownership, consent, storage, access control, or cross-border processing. In this regard, the International Monetary Fund has stressed the need for privacy due to the broader implications of digital technology, thus further emphasizing the role of governance as immersive technology becomes widespread. It is imperative for AR developers to design their devices and software with secure processing, permission management, encryption, data policies, and enterprise-level control mechanisms in place. This could prove to be costly and delay procurement processes.

Company Analysis

Competitive Landscape

The competitive environment reflects an expanding Augmented Reality Market analysis in which hardware manufacturers, semiconductor companies, AI platforms, spatial-computing providers, and enterprise software specialists compete across different layers of the value chain.

Company Name

Overview

Products and Services relevant to this market

Samsung Electronics Co., Ltd.

Global electronics company expanding immersive computing through device, display, semiconductor, and mobile ecosystem capabilities.

Galaxy XR, displays, mobile platforms, semiconductor technologies, immersive-device ecosystem, and AI-enabled hardware.

Apple Inc.

Premium technology company developing spatial computing around integrated hardware, operating systems, silicon, and immersive content.

Apple Vision Pro, visionOS, spatial applications, Apple Intelligence, immersive content, and developer tools.

Vuzix Corporation

Specialist smart-glass and waveguide company focused strongly on enterprise and industrial wearable applications.

M-series smart glasses, Z100, waveguides, OEM solutions, AR displays, and enterprise software integrations.

Meta Platforms, Inc.

Social-technology and AI company expanding wearable computing through smart glasses and immersive platforms.

Ray-Ban Meta, Meta Ray-Ban Display, Meta AI, wearable software, cameras, and spatial computing platforms.

PTC Inc.

Enterprise software provider with established expertise in industrial AR and connected-product workflows.

Vuforia Engine, AR authoring, enterprise visualization, IoT integration, and digital-product workflows.

Qualcomm Technologies, Inc.

Semiconductor technology provider enabling XR devices through processors, connectivity, computer vision, and AI capabilities.

Snapdragon XR platforms, AI processing, wireless connectivity, computer vision, and reference technologies.

Magic Leap, Inc.

Spatial-computing specialist focused on enterprise-grade AR hardware and software environments.

Magic Leap headsets, optical systems, spatial computing software, enterprise solutions, and developer tools.

Sony Corporation

Consumer electronics and entertainment company combining imaging, display, gaming, and spatial technologies.

Spatial Reality Display, immersive displays, imaging technologies, gaming ecosystem, and spatial content solutions.

NVIDIA Corporation

Accelerated-computing company supporting AR through GPUs, simulation, AI, digital twins, and spatial software.

NVIDIA Omniverse, OpenUSD workflows, GPUs, AI platforms, simulation, digital twins, and developer technologies.

Google LLC

Technology company developing Android XR and AI-assisted wearable computing across headsets and glasses.

Android XR, Gemini integration, spatial software, AI services, developer ecosystem, and immersive platform technologies.

Trust & Transparency

Research Methodology

The market analysis combines proprietary research with secondary data from government agencies, company disclosures, regulatory filings, industry databases and expert interviews. Market estimates are validated through data triangulation, cross-market benchmarking and analyst review.

View Full Research Methodology

Questions Answered

Frequently Asked Questions

What is the long-term strategic value of the Augmented Reality Market Report?

The report can support strategy teams evaluating regional expansion, application priorities, technology partnerships, competitive positioning, investment opportunities, and product development. Its value increases when companies compare hardware capabilities with software ecosystems, enterprise use cases, regulatory requirements, and monetization potential.

How can retailers measure AR effectiveness?

Retailers can evaluate AR through conversion rates, product interaction, dwell time, engagement, add-to-cart behavior, purchase completion, return rates, repeat visits, and customer satisfaction. Linking immersive experiences with commerce platforms makes it easier to identify whether visualization generates measurable commercial outcomes.

What role do digital twins play in enterprise AR?

Digital twins provide structured three-dimensional representations of assets, facilities, products, or processes. When connected with AR, they allow workers to visualize equipment data, instructions, simulations, and design information within physical environments, strengthening applications across engineering, manufacturing, maintenance, and training.

Why are waveguides important for next-generation smart glasses?

Waveguides can support compact optical architectures that project digital information into a user’s field of view while preserving a glasses-like form factor. Improvements in brightness, efficiency, field of view, manufacturing yield, and optical performance can directly influence comfort and commercial scalability.

How does AI change the commercial value of AR devices?

AI enables devices to understand visual surroundings, interpret voice commands, translate information, recognize objects, and provide contextual assistance. This shifts AR from passive visualization toward interactive computing, increasing potential value in field service, logistics, retail, healthcare, navigation, and everyday consumer applications.

Access the Full Augmented Reality Market Report

Get segment-level forecasts, regional estimates, competitive benchmarking, company profiles and downloadable Excel datasets.

Access the full Augmented Reality Market Report
350 pages PDF & Excel | 2026-08-31