
Data Visualization Market Outlook: Size, Share, Trends, Growth Analysis, Competitive Landscape & Forecast, 2026-2033

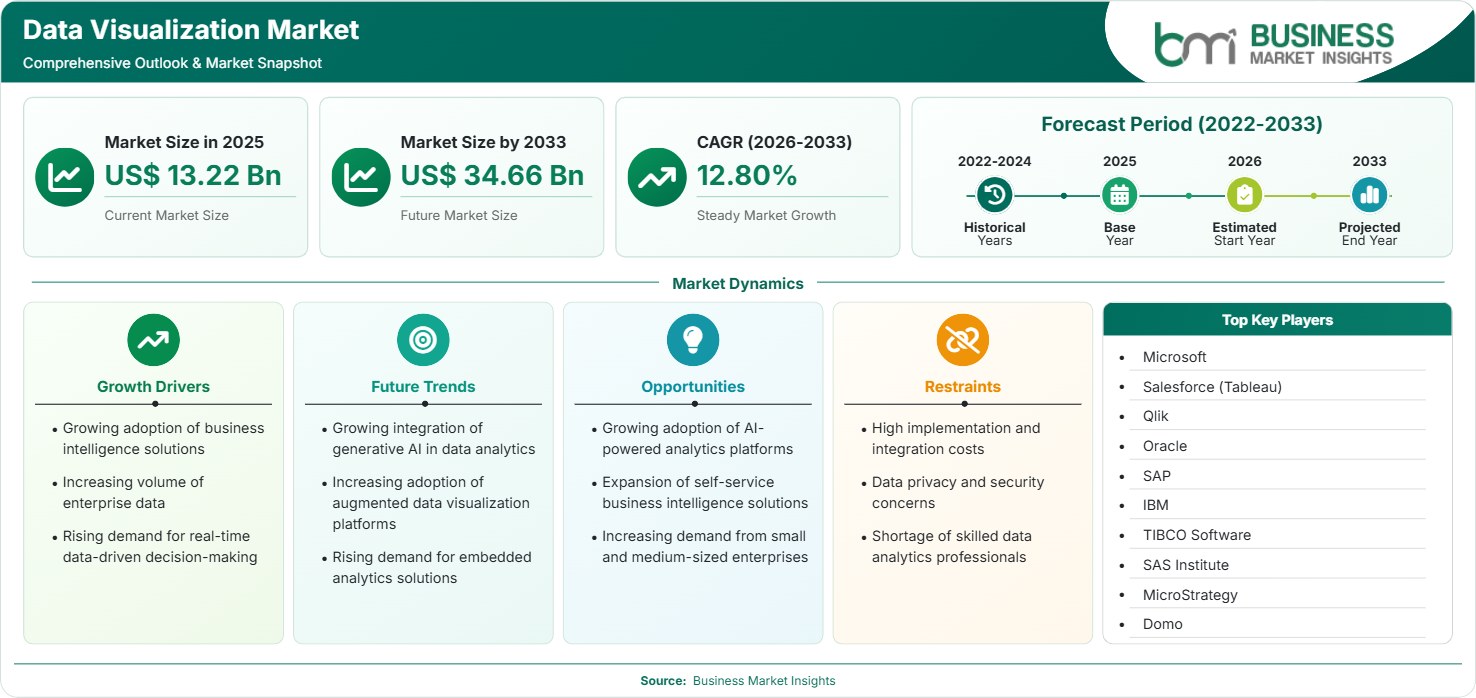
The Data Visualization Market size was valued at US$ 13.22 Billion in 2025 and is projected to reach US$ 34.66 Billion by 2033, growing at a CAGR of 12.80% from 2026 to 2033, driven by business intelligence adoption, enterprise data expansion, real-time analytics demand, AI-powered insights, and self-service reporting capabilities.

Report Coverage
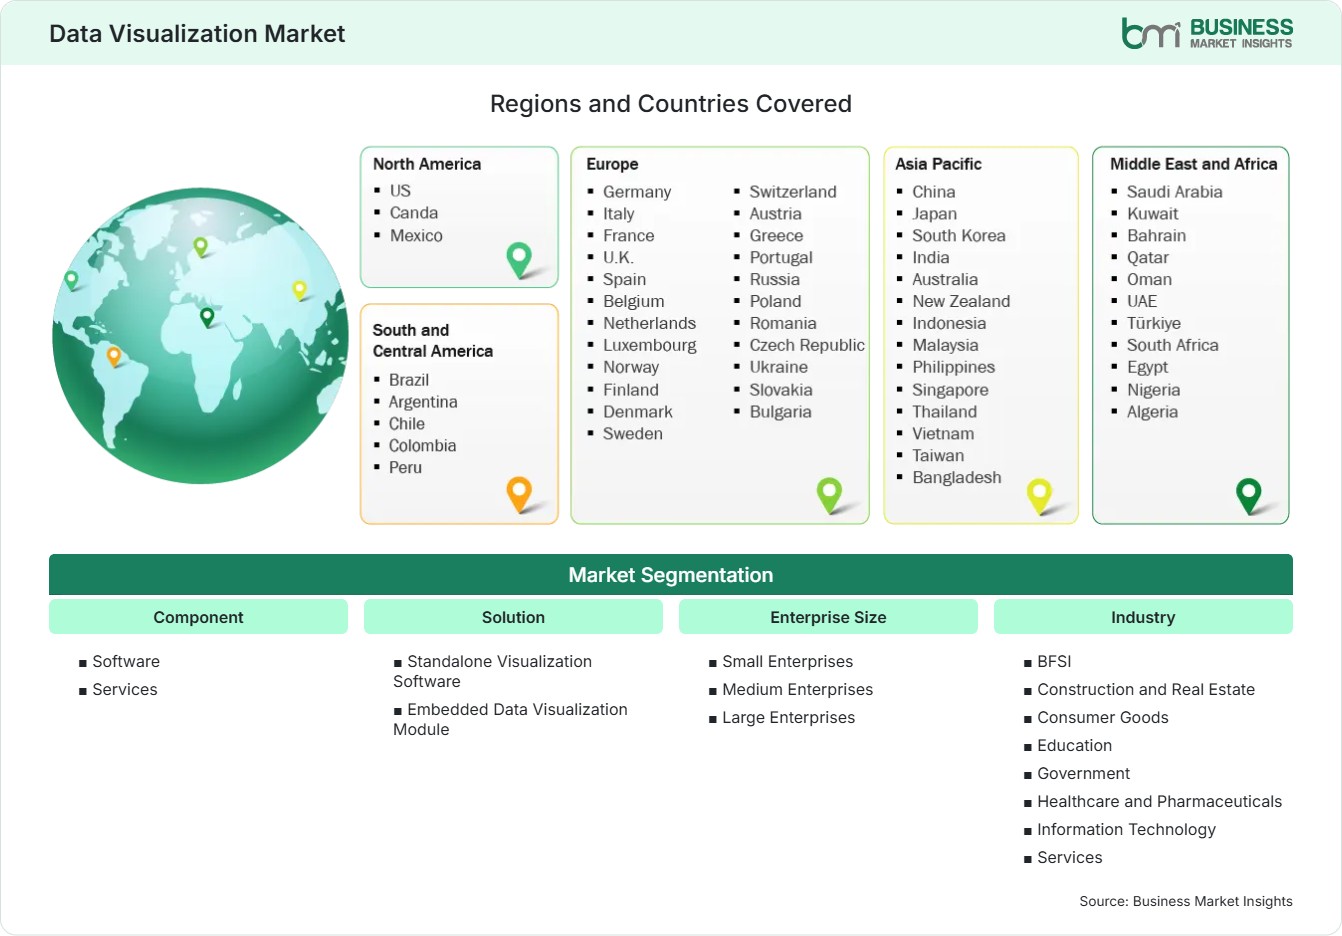
  • Component: Software, Services
  • Solution: Standalone Visualization Software, Embedded Data Visualization Module
  • Enterprise Size: Small Enterprises, Medium Enterprises, Large Enterprises
  • Industry: BFSI, Construction and Real Estate, Consumer Goods, Education, Government, Healthcare and Pharmaceuticals, Information Technology, Services
US$ 13.22 Bn Market size in 2025
US$ 34.66 Bn Market Size by 2033
12.80% CAGR, 2026 - 2033
2026-2033 Forecast Period

01 AI Overview

Data Visualization Market Summary

  • North America Region: North America holds a market share of 36%–39% in 2025, growing with a CAGR of 12%–14% influenced by advanced analytics adoption, cloud transformation, enterprise digitalization, and strong demand for business intelligence solutions. The US market demonstrates strong adoption with a CAGR of 12%–14% during 2026–2033, supported by technology investments, AI analytics integration, and enterprise data modernization.
  • Fastest Growing Region: Asia Pacific holds a market share of 24%–27% in 2025, expanding with a CAGR of 14%–16% due to rapid digital transformation, increasing enterprise data generation, cloud adoption, and growing investments in analytics infrastructure across emerging economies.
  • Leading Segment: Software holds a market share of 65%–68% in 2025, growing with a CAGR of 13%–15% due to increasing adoption of visualization platforms, AI-enabled analytics, dashboard automation, and enterprise decision-support requirements.
  • High Growth Segment: Small Enterprises hold a market share of 18%–21% in 2025, advancing with a CAGR of 14%–16% due to affordable cloud-based solutions, self-service analytics platforms, and increasing need for data-driven decision-making.
  • Key Market Opportunity: AI-powered analytics platforms, self-service business intelligence solutions, and expanding adoption among small and medium-sized enterprises are creating opportunities for scalable visualization technologies.
  • Major Market Players: Microsoft, Salesforce (Tableau), Qlik, Oracle, SAP, IBM, TIBCO Software, SAS Institute, MicroStrategy, and Domo.
02 Strategic Insights

Data Visualization Market: Strategic Insights

data-visualization-market-market-strategic-framework
FREE PDF
Request your free sample
Request free sample
03 Stakeholder View

Key Takeaways

  • Enterprise analytics ecosystems are shifting toward integrated visualization platforms that connect multiple data sources and improve organizational decision-making.
  • Software-based visualization platforms represent the largest opportunity due to increasing adoption of cloud analytics, AI integration, and business intelligence solutions.
  • Innovation priorities include automated insights, natural language analytics, predictive visualization, embedded dashboards, and augmented analytics capabilities.
  • Asia Pacific offers strong investment potential due to rapid digital transformation, expanding enterprise technology adoption, and increasing data generation.
  • Market consolidation is increasing through strategic partnerships, platform integrations, and acquisitions focused on strengthening analytics capabilities.
  • Small and medium-sized enterprises are becoming important growth contributors due to affordable subscription-based analytics platforms and simplified deployment models.
04 Geographic Outlook

Data Visualization Market Regional Highlights

North America Data Visualization Market

North America accounted for a 36%–39% share in 2025 and is projected to register a CAGR of 12%–14% from 2026–2033. The region maintains leadership due to advanced technology infrastructure, strong enterprise analytics adoption, and widespread use of business intelligence platforms. The Data Visualization Market share reflects significant demand from financial services, healthcare, technology, and government organizations. The United States remains the largest contributor due to high digital maturity.

  • The United States is expanding adoption through enterprise analytics investments, AI integration, and cloud transformation initiatives.
  • Canada is increasing visualization platform adoption through digital government programs and enterprise modernization.
  • Organizations are prioritizing real-time dashboards to improve operational efficiency and strategic planning.
  • Technology providers are investing in advanced analytics capabilities and industry-specific solutions.

US Data Visualization Market

The United States represented a 31%–34% share in 2025 and is expected to achieve a CAGR of 12%–14% between 2026–2033. The country benefits from strong technology spending, widespread cloud adoption, and high demand for advanced analytics tools. The Data Visualization Market growth is supported by enterprise digital transformation, AI-powered analytics adoption, and increasing requirements for real-time business insights.

  • Enterprises are adopting visualization tools to improve data accessibility across business functions.
  • Technology companies are integrating artificial intelligence into analytics platforms to enhance automation.
  • Financial institutions and healthcare organizations are increasing investments in data-driven decision systems.

Europe Data Visualization Market

Europe accounted for a 27%–30% share in 2025 and is forecast to grow at a CAGR of 11%–13% during 2026–2033. The region benefits from increasing digital transformation, regulatory emphasis on data management, and growing enterprise analytics adoption. Germany, the United Kingdom, and France represent leading markets, while Nordic countries demonstrate strong demand due to technology advancement and data-driven business practices.

  • Germany is expanding adoption through industrial digitalization and enterprise intelligence initiatives.
  • The United Kingdom is increasing analytics investments across financial services and government sectors.
  • France is adopting visualization platforms through business modernization and cloud technology deployment.
  • European organizations are emphasizing secure analytics solutions due to evolving data regulations.

Asia Pacific Data Visualization Market

Asia Pacific represented a 24%–27% share in 2025 and is projected to grow at a CAGR of 14%–16% between 2026–2033. The region demonstrates strong growth potential due to rapid digitalization, increasing enterprise data generation, expanding cloud infrastructure, and rising technology investments. China, India, Japan, and South Korea are key contributors, with businesses adopting analytics platforms to improve competitiveness and operational efficiency.

  • China is expanding adoption through enterprise digital transformation and artificial intelligence investments.
  • India is witnessing increasing demand through growing IT services and startup ecosystems.
  • Japan and South Korea are adopting advanced analytics solutions across technology-driven industries.
  • Southeast Asian markets are improving data capabilities through cloud technology adoption.

Rest of World Data Visualization Market

South and Central America accounted for a 6%–8% share in 2025, while the Middle East and Africa contributed a combined 4%–6% share. These regions are expected to grow at CAGRs of 11%–13% and 12%–14%, respectively, supported by digital transformation initiatives, expanding cloud infrastructure, business intelligence adoption, and increasing enterprise technology investments. Brazil, Mexico, UAE, and South Africa represent emerging markets with growing demand for analytics capabilities.

  • Brazil is expanding visualization adoption through enterprise digitization and increasing investments in analytics infrastructure.
  • Mexico is witnessing growth through cloud adoption and improved business intelligence deployment across industries.
  • UAE is strengthening analytics capabilities through smart government initiatives and digital transformation programs.
  • South Africa is adopting visualization platforms through improving enterprise technology modernization efforts.
global-market-geography
FREE PDF
Request your free sample
Request free sample
05 Segment Analysis

Data Visualization Market Segmentation

Component

Component segmentation is driven by increasing demand for advanced analytics platforms, implementation support, and customized enterprise solutions. Software dominated the segment with a 65%–68% share in 2025 and is projected to grow at a CAGR of 13%–15% between 2026–2033. The Data Visualization Market scope continues expanding as organizations prioritize interactive dashboards, automated reporting, cloud analytics, and scalable visualization capabilities for improved business intelligence.

  • Software: Represents the leading component due to widespread adoption of visualization platforms, dashboard solutions, analytics automation, and enterprise data interpretation tools.
  • Services: Supports deployment, integration, consulting, customization, and maintenance requirements. Demand is increasing as organizations seek optimized analytics implementation and technical expertise.

Solution

Solution segmentation highlights increasing adoption of standalone platforms and embedded analytics capabilities across enterprises. Standalone Visualization Software accounted for a 55%–58% share in 2025 and is expected to grow at a CAGR of 12%–14% between 2026–2033. Organizations increasingly adopt dedicated visualization platforms to improve reporting efficiency, data exploration, and decision-making processes across multiple business functions.

  • Standalone Visualization Software: Enables independent analytics capabilities through dashboards, reporting tools, and interactive data exploration features for enterprise users.
  • Embedded Data Visualization Module: Provides visualization capabilities within existing business applications, improving workflow integration and user accessibility.

Enterprise Size

Enterprise Size segmentation reflects growing adoption among organizations of different scales seeking improved data utilization. Large Enterprises represented a 55%–58% share in 2025 and are projected to grow at a CAGR of 12%–14% between 2026–2033. Large organizations continue investing in visualization platforms due to complex data environments, global operations, and requirements for centralized analytics management.

  • Small Enterprises: Adopt affordable cloud-based visualization tools to improve operational insights and compete through data-driven strategies.
  • Medium Enterprises: Increase adoption through scalable analytics platforms supporting business growth, process optimization, and improved reporting capabilities.
  • Large Enterprises: Utilize advanced visualization solutions for enterprise-wide analytics, strategic planning, and integration of complex data ecosystems.

Industry

Industry segmentation demonstrates widespread adoption across sectors requiring real-time insights and operational intelligence. Information Technology represented a 20%–23% share in 2025 and is expected to grow at a CAGR of 13%–15% between 2026–2033. Increasing data complexity, digital transformation, and demand for analytics-driven decisions are encouraging organizations across industries to implement visualization technologies.

  • BFSI: Uses visualization platforms for risk analysis, customer insights, fraud detection, and financial performance monitoring.
  • Construction and Real Estate: Adopts analytics solutions for project tracking, resource planning, and operational efficiency improvement.
  • Consumer Goods: Utilizes visualization tools for customer analysis, sales optimization, and market trend evaluation.
  • Education: Implements analytics platforms for performance monitoring, resource management, and institutional decision-making.
  • Government: Uses visualization technologies for public data analysis, policy planning, and service improvement initiatives.
  • Healthcare and Pharmaceuticals: Applies analytics for patient insights, research analysis, and healthcare management optimization.
  • Information Technology: Drives adoption through complex data environments, digital services, and enterprise analytics requirements.
  • Services: Uses visualization solutions for operational reporting, customer analysis, and business performance management.
06 Market Forces

Data Visualization Market Dynamics

Key Market Drivers

Growing Adoption of Business Intelligence Solutions

The growing adoption of business intelligence solutions is a major driver as organizations increasingly rely on analytics platforms to improve strategic planning and operational efficiency. Businesses are moving beyond traditional reporting methods toward interactive dashboards and real-time visualization systems that enable faster decision-making. Integration with cloud platforms and artificial intelligence is enhancing the capabilities of business intelligence solutions. The Data Visualization Market trends indicate increasing demand for tools that simplify complex datasets and provide actionable insights across departments. Enterprises across BFSI, healthcare, retail, and technology sectors are investing in analytics infrastructure to strengthen competitive positioning.

Increasing Volume of Enterprise Data

The continuous expansion of enterprise data is increasing demand for advanced visualization technologies capable of processing and presenting complex information effectively. Organizations generate large volumes of structured and unstructured data through digital platforms, customer interactions, operational systems, and connected devices. Visualization tools assist organizations in recognizing patterns, tracking performances, and making better decisions. The growing use of cloud computing, IoT applications, and digitization is making it even more difficult to work with data. Firms need powerful analytics software to turn big data into actionable insights, thereby sustaining the need for visualization solutions.

Rising Demand for Real-Time Data-Driven Decision-Making

There is a rising need for immediate, data-driven decisions, which is leading companies to invest in visualization platforms that offer instant insight into their businesses. Corporations need interactive dashboards and automated reporting tools that can track changes in the market environment, operational performance, and customer activities. Real-time analytics help to respond to any business situation more quickly and allocate resources better. The increasing competition in various industries is making corporations invest in advanced visualization tools that can facilitate quick decision-making.

Key Market Opportunities

Growing Adoption of AI-Powered Analytics Platforms

The increasing use of artificial intelligence-based analytics platform is presenting many opportunities as organizations look to gain automated insights, predictive power, and intelligence through their data. With the use of artificial intelligence, visualization tools will be able to recognize patterns, give recommendations, and make the process of analysis easier. Businesses are turning to augmented analytics platforms that include machine learning algorithms with interactive dashboards. The Data Visualization Market Forecasts indicate expanding opportunities for vendors developing AI-driven visualization capabilities, natural language analytics, and automated reporting solutions. Companies investing in intelligent analytics platforms can address rising demand for faster, more accessible, and actionable business intelligence.

Expansion of Self-Service Business Intelligence Solutions

The growth of self-service business intelligence solutions presents new opportunities in terms of helping non-technical staff members analyze data and derive actionable insights. Organizations are becoming less dependent on specialist analytics teams with self-service visualizations that are easy to use and include automatic functions. Self-service business intelligence solutions facilitate collaboration, enhance data availability and help make decisions quickly. Companies of all sizes, including small and medium-sized organizations, are beginning to use such solutions owing to their flexible pricing structure and simple installation procedures.

Increasing Demand from Small and Medium-Sized Enterprises

The expanding scope of opportunities for small and medium-sized businesses can be attributed to the increasing recognition of the advantages of analytics tools and the availability of low-cost cloud computing services. Smaller firms are now taking advantage of visualization technologies that were previously difficult and expensive to implement. Subscription-based business models, simpler implementations, and scalable systems have lowered the barriers to entry for small businesses. Technology vendors are developing products that cater to SMEs' needs through simpler implementations and industry-specific solutions. The increasing digitalization of small businesses will help in the adoption of visualization technology.

Market Restraints and Challenges

High Implementation and Integration Costs

Factor: Advanced visualization platforms often require significant investment in software deployment, data integration, infrastructure upgrades, and employee training. Impact: High implementation costs can delay adoption among small and medium-sized enterprises with limited technology budgets. Incorporating visualization systems within the database or other enterprise applications may pose difficulty for the organization due to complex installation requirements. This may prolong the process and require highly specialized technical expertise. The vendors are solving this problem by developing cloud solutions and implementing affordable pricing models. Cost continues to play a significant role in purchase decisions, especially for companies with limited analytics capabilities.

Data Privacy and Security Concerns

Factor: Visualization platforms process large volumes of business information, including sensitive operational, financial, and customer data, increasing cybersecurity risks. Impact: Data privacy concerns can restrict adoption and require organizations to implement strict governance frameworks, compliance measures, and security controls. Companies must consider securing their data storage, data access control, and comply with various legal requirements during the use of business analytics solutions. Growing cybersecurity risks along with new laws governing data protection add more layers of complexity. The technology companies are now developing solutions in encryption, identity management, and cloud security.

07 Company Analysis

Competitive Landscape

The competitive environment is characterized by platform innovation, cloud analytics expansion, artificial intelligence integration, and enterprise-focused visualization capabilities. Data Visualization Market analysis indicates that leading technology providers are investing in advanced dashboards, embedded analytics, automated insights, and self-service business intelligence solutions. Companies are strengthening market positions through product enhancements, strategic partnerships, ecosystem integrations, and industry-specific analytics offerings.

Company Name

Overview

Products and Services relevant to this market

Microsoft

Global technology company providing enterprise software and cloud solutions.

Power BI, analytics dashboards, business intelligence visualization tools.

Salesforce (Tableau)

Cloud technology company offering customer and analytics platforms.

Tableau visualization software, analytics solutions, enterprise dashboards.

Qlik

Analytics company focused on data integration and visualization.

Data visualization platforms, self-service analytics, business intelligence tools.

Oracle

Enterprise technology provider offering database and analytics solutions.

Oracle Analytics Cloud, visualization tools, enterprise analytics platforms.

SAP

Business software company supporting enterprise data management.

SAP Analytics Cloud, dashboards, business intelligence solutions.

IBM

Technology company providing artificial intelligence and analytics solutions.

Cognos Analytics, AI-powered visualization, enterprise reporting tools.

TIBCO Software

Analytics software provider focused on data-driven solutions.

Spotfire analytics, visualization platforms, predictive analytics solutions.

SAS Institute

Analytics company specializing in advanced data solutions.

Visual analytics, business intelligence, statistical visualization tools.

MicroStrategy

Enterprise analytics company providing business intelligence platforms.

Analytics dashboards, enterprise reporting, visualization solutions.

Domo

Cloud-based business intelligence company focused on data accessibility.

Cloud dashboards, business analytics, visualization applications.

10 Trust & Transparency

Research Methodology

The market analysis combines proprietary research with secondary data from government agencies, company disclosures, regulatory filings, industry databases and expert interviews. Market estimates are validated through data triangulation, cross-market benchmarking and analyst review.

View Full Research Methodology

11 Questions Answered

Frequently Asked Questions

Why are SMEs adopting data visualization platforms?

SMEs are adopting visualization platforms due to affordable cloud solutions, simplified deployment, improved operational visibility, and increasing need for data-driven strategies.

What does the Data Visualization Market Report cover?

The report covers market size, segmentation, regional analysis, competitive landscape, growth factors, challenges, and future technology opportunities.

How is artificial intelligence influencing visualization solutions?

Artificial intelligence improves visualization platforms through automated insights, predictive analytics, natural language queries, and enhanced decision-support capabilities.

Which component dominates the data visualization industry?

Software represents the leading component due to widespread adoption of visualization platforms, analytics dashboards, cloud solutions, and automated reporting capabilities.

What factors are driving the Data Visualization Market growth?

The market is driven by increasing enterprise data volumes, business intelligence adoption, real-time analytics demand, AI integration, and the need for faster data-driven decision-making.

Access the Full Data Visualization Market Report

Get segment-level forecasts, regional estimates, competitive benchmarking, company profiles and downloadable Excel datasets.

Access the full Data Visualization Market Report
350 pages PDF & Excel | 2026-08-05