South & Central America Virtual Pipeline Systems Market Forecast to 2028 – COVID-19 Impact and Regional Analysis – by Type (Standard Trailer and Towable Trailer), Gas (CNG, Hydrogen, and Others), Pressure Rating (Less than 3000 Psi, 3001 Psi to 5000 Psi, and More than 5001 Psi), and Application (Industrial, Transportation, and Commercial & Residential)   

BMIRE00027640 | Pages: 102 | Energy and Power | Dec 2022 | Type: Regional | Status: Published

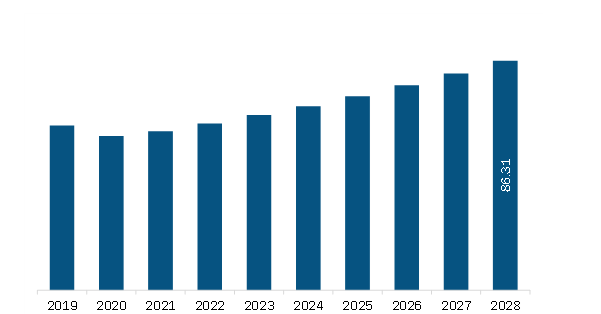
The virtual pipeline systems  market in South & Central America is expected to grow from US$ 62.67 million in 2022 to US$ 86.31 million by 2028. It is estimated to grow at a CAGR of 5.5% from 2022 to 2028.


Increasing Energy Demands Creating Need for Virtual Pipeline Systems


In recent times, natural gas has gained prominence as it burns cleaner than conventional fossil fuels, such as coal, gasoline, and diesel. The world is facing serious repercussions of global warming, which is compelling a shift toward cleaner energy sources and natural gas. Virtual pipelines allow natural gas companies to extend their reach beyond their local market, thereby allowing them to expand their footprint. Virtual pipelines are designed for the land transport of gas shipments in containers by rail or road; they can also be transported on the water in coastal tankers and river ships. These systems can be employed to supply natural gas to power plants and private customers who cannot participate in pipeline development due to geological constraints. Virtual pipelines provide flexibility in transporting natural gas along with eliminating the need for large physical pipeline installations. The deployment of physical pipelines is not always feasible due to terrain or geopolitical issues, which further drives the virtual pipeline market.


Market Overview


Brazil and Argentina are among the key countries in South America. Despite many economic challenges, favourable government initiatives, the highest urbanization rate, and rapid industrialization propel the growth of the region’s economy. The proliferation of the industrial sector provides significant opportunities for the progress of the virtual pipeline system market in the region. The National Agency of Petroleum, Natural Gas, and Biofuels (ANP) estimates that 93% of the nation's total oil and gas output in 2019 will come from offshore sources, while just 7% will come from onshore sources. This is anticipated to boost the Brazilian upstream oil and gas market during the projected period.


 South & Central America Virtual Pipeline Systems Market  Revenue and Forecast to 2028 (US$ Million)


South & Central America Virtual Pipeline Systems Market  Segmentation


The South & Central America virtual pipeline systems market is segmented into type, gas, pressure rating, application, and country. 

  • Based on type, the market is bifurcated into standard trailer and towable trailer. The standard trailer segment registered the larger market share in 2022.
  • Based on gas, the market is segmented into CNG, hydrogen, and others. The CNG segment held the largest market share in 2022.
  • Based on pressure rating, the market is segmented into less than 3000 Psi, 3001 Psi to 5000 Psi, and more than 5001 Psi. The 3001 Psi to 5000 Psi segment held the largest market share in 2022.
  • Based on application, the market is segmented into industrial, transportation, and commercial & residential. The transportation segment held the largest market share in 2022.
  • Based on country, the market is segmented into Brazil, Argentina, and the Rest of South & Central America. Brazil dominated the market share in 2022.

Galileo Technologies S.A.; Bayotech, Inc.; Petroliam Nasional Berhad (PETRONAS); Quantum Fuel Systems LLC.; Chart Industries, Inc.; Fiba Technologies Inc.; Hexagon Agility; and Composite Advanced Technologies, LLC. are the leading companies operating in the virtual pipeline systems market in the region.  

1.           Introduction

1.1         Study Scope

1.2         The Insight Partners Research Report Guidance

1.3         Market Segmentation

2.           Key Takeaways

3.        Research Methodology

3.1         Coverage

3.2         Secondary Research

3.3         Primary Research

4.           South & Central America Virtual Pipeline Systems Market Landscape

4.1         Market Overview

4.2         PEST Analysis

4.2.1        South America

4.3         Ecosystem Analysis

4.4         Expert Opinions

5.           South & Central America Virtual Pipeline Systems Market – Key Market Dynamics

5.1         Market Drivers

5.1.1        Increasing Energy Demands Creating Need for Virtual Pipeline Systems

5.1.2        Rising Shale Gas Extraction Driving Demand for Virtual Pipeline System

5.2         Market Restraints

5.2.1        Significant Dominance of Conventional Pipeline Infrastructure

5.3         Market Opportunities

5.3.1        Growing Inclination towards Consumption of Natural Gas

5.4         Future Trends

5.4.1        Growing Investment in VPS Technologies

5.5         Impact Analysis of Drivers And Restraints

6.           Virtual Pipeline Systems – South & Central America Market Analysis

6.1         South & Central America Virtual Pipeline Systems Market Overview

6.2         South & Central America Virtual Pipeline Systems Market Revenue Forecast and Analysis

7.           South & Central America Virtual Pipeline Systems Market – By Type

7.1         Overview

7.2         South & Central America Virtual Pipeline Systems Market, By Type (2021 and 2028)

7.3         Standard Trailer

7.3.1        Overview

7.3.2        South & Central America Standard Trailer: Virtual Pipeline Systems Market – Revenue and Forecast to 2028 (US$ Million)

7.4         Towable Trailer

7.4.1        Overview

7.4.2        South & Central America Towable Trailer: Virtual Pipeline Systems Market – Revenue and Forecast to 2028 (US$ Million)

8.           South & Central America Virtual Pipeline Systems Market – By Gas

8.1         Overview

8.2         South & Central America Virtual Pipeline Systems Market, By Gas (2021 and 2028)

8.3         CNG

8.3.1        Overview

8.3.2        South & Central America CNG: Virtual Pipeline Systems Market – Revenue and Forecast to 2028 (US$ Million)

8.4         Hydrogen

8.4.1        Overview

8.4.2        South & Central America Hydrogen: Virtual Pipeline Systems Market – Revenue and Forecast to 2028 (US$ Million)

8.5         Others

8.5.1        Overview

8.5.2        South & Central America Others: Virtual Pipeline Systems Market – Revenue and Forecast to 2028 (US$ Million)

9.           South & Central America Virtual Pipeline systems Market – By Pressure Rating

9.1         Overview

9.2         South & Central America Virtual Pipeline Systems Market, By Pressure Rating (2021 and 2028)

9.3         Less than 3000 Psi

9.3.1        Overview

9.3.2        South & Central America Less than 3000 Psi: Virtual Pipeline Systems Market – Revenue and Forecast to 2028 (US$ Million)

9.41 Psi to 5000 Psi

9.4.1        Overview

9.4.2        South & Central America 3001 Psi to 5000 Psi: Virtual Pipeline Systems Market – Revenue and Forecast to 2028 (US$ Million)

9.5         More than 5001 Psi

9.5.1        Overview

9.5.2        South & Central America More than 5001 Psi: Virtual Pipeline Systems Market – Revenue and Forecast to 2028 (US$ Million)

10.        South & Central America Virtual Pipeline Systems Market – By Application

10.1      Overview

10.2      South & Central America Virtual Pipeline Systems Market, By Application (2021 and 2028)

10.3      Industrial

10.3.1     Overview

10.3.2     South & Central America Industrial: Virtual Pipeline Systems Market – Revenue and Forecast to 2028 (US$ Million)

10.4      Transportation

10.4.1     Overview

10.4.2     South & Central America Transportation: Virtual Pipeline Systems Market – Revenue and Forecast to 2028 (US$ Million)

10.5      Commercial & Residential

10.5.1     Overview

10.5.2     South & Central America Commercial & Residential: Virtual Pipeline Systems Market – Revenue and Forecast to 2028 (US$ Million)

11.        South & Central America Virtual Pipeline Systems Market – Country Analysis

11.1      SAM: Virtual Pipeline Systems Market

11.1.1     SAM: Virtual Pipeline Systems Market – Revenue and Forecast to 2028 (US$ Million)

11.1.2     SAM: Virtual Pipeline Systems Market, By Key Country

11.1.2.1       Brazil: Virtual Pipeline Systems Market – Revenue and Forecast to 2028 (US$ Million)

11.1.2.1.1       Brazil: Virtual Pipeline Systems Market, By Type

11.1.2.1.2       Brazil: Virtual Pipeline Systems Market, By Gas

11.1.2.1.3       Brazil: Virtual Pipeline Systems Market, By Pressure Rating

11.1.2.1.4       Brazil: Virtual Pipeline Systems Market, By Application

11.1.2.2       Argentina: Virtual Pipeline Systems Market – Revenue and Forecast to 2028 (US$ Million)

11.1.2.2.1       Argentina: Virtual Pipeline Systems Market, By Type

11.1.2.2.2       Argentina: Virtual Pipeline Systems Market, By Gas

11.1.2.2.3       Argentina: Virtual Pipeline Systems Market, By Pressure Rating

11.1.2.2.4       Argentina: Virtual Pipeline Systems Market, By Application

11.1.2.3       Rest of SAM: Virtual Pipeline Systems Market – Revenue and Forecast to 2028 (US$ Million)

11.1.2.3.1       Rest of SAM: Virtual Pipeline Systems Market, By Type

11.1.2.3.2       Rest of SAM: Virtual Pipeline Systems Market, By Gas

11.1.2.3.3       Rest of SAM: Virtual Pipeline Systems Market, By Pressure Rating

11.1.2.3.4       Rest of SAM: Virtual Pipeline Systems Market, By Application

12.        Industry Landscape

12.1      Overview

12.2      New Product Launch

12.3      Merger and Acquisition

13.        Company Profiles

13.1      Galileo Technologies S.A.

13.1.1     Key Facts

13.1.2     Business Description

13.1.3     Products and Services

13.1.4     Financial Overview

13.1.5     SWOT Analysis

13.1.6     Key Developments

13.2      Bayotech, Inc.

13.2.1     Key Facts

13.2.2     Business Description

13.2.3     Products and Services

13.2.4     Financial Overview

13.2.5     SWOT Analysis

13.2.6     Key Developments

13.3      Petroliam Nasional Berhad (PETRONAS)

13.3.1     Key Facts

13.3.2     Business Description

13.3.3     Products and Services

13.3.4     Financial Overview

13.3.5     SWOT Analysis

13.3.6     Key Developments

13.4      Quantum Fuel Systems LLC.

13.4.1     Key Facts

13.4.2     Business Description

13.4.3     Products and Services

13.4.4     Financial Overview

13.4.5     SWOT Analysis

13.4.6     Key Developments

13.5      Chart Industries, Inc.

13.5.1     Key Facts

13.5.2     Business Description

13.5.3     Products and Services

13.5.4     Financial Overview

13.5.5     SWOT Analysis

13.5.6     Key Developments

13.6      Fiba Technologies Inc

13.6.1     Key Facts

13.6.2     Business Description

13.6.3     Products and Services

13.6.4     Financial Overview

13.6.5     SWOT Analysis

13.6.6     Key Developments

13.7      Hexagon Agility

13.7.1     Key Facts

13.7.2     Business Description

13.7.3     Products and Services

13.7.4     Financial Overview

13.7.5     SWOT Analysis

13.7.6     Key Developments

13.8      Composite Advanced Technologies, LLC.

13.8.1     Key Facts

13.8.2     Business Description

13.8.3     Products and Services

13.8.4     Financial Overview

13.8.5     SWOT Analysis

13.8.6     Key Developments

14.        Appendix

14.1      About The Insight Partners

14.2      Word Index


LIST OF TABLES

Table 1.             South & Central America Virtual Pipeline Systems Market Revenue and Forecast to 2028 (US$ Million)

Table 2.             SAM: Virtual Pipeline Systems Market, By Type – Revenue and Forecast to 2028 (US$ Million)

Table 3.             SAM: Virtual Pipeline Systems Market, By Gas – Revenue and Forecast to 2028 (US$ Million)

Table 4.             SAM: Virtual Pipeline Systems Market, By Pressure Rating – Revenue and Forecast to 2028 (US$ Million)

Table 5.             SAM: Virtual Pipeline Systems Market, By Application – Revenue and Forecast to 2028 (US$ Million)

Table 6.             SAM: Virtual Pipeline Systems Market, By Country – Revenue and Forecast to 2028 (US$ Million)

Table 7.             Brazil: Virtual Pipeline Systems Market, By Type – Revenue and Forecast to 2028 (US$ Million)

Table 8.             Brazil: Virtual Pipeline Systems Market, By Gas – Revenue and Forecast to 2028 (US$ Million)

Table 9.             Brazil: Virtual Pipeline Systems Market, By Pressure Rating – Revenue and Forecast to 2028 (US$ Million)

Table 10.          Brazil: Virtual Pipeline Systems Market, By Application – Revenue and Forecast to 2028 (US$ Million)

Table 11.          Argentina: Virtual Pipeline Systems Market, By Type – Revenue and Forecast to 2028 (US$ Million)

Table 12.          Argentina: Virtual Pipeline Systems Market, By Gas – Revenue and Forecast to 2028 (US$ Million)

Table 13.          Argentina: Virtual Pipeline Systems Market, By Pressure Rating – Revenue and Forecast to 2028 (US$ Million)

Table 14.          Argentina: Virtual Pipeline Systems Market, By Application – Revenue and Forecast to 2028 (US$ Million)

Table 15.          Rest of SAM: Virtual Pipeline Systems Market, By Type – Revenue and Forecast to 2028 (US$ Million)

Table 16.          Rest of SAM: Virtual Pipeline Systems Market, By Gas – Revenue and Forecast to 2028 (US$ Million)

Table 17.          Rest of SAM: Virtual Pipeline Systems Market, By Pressure Rating – Revenue and Forecast to 2028 (US$ Million)

Table 18.          Rest of SAM: Virtual Pipeline Systems Market, By Application – Revenue and Forecast to 2028 (US$ Million)

Table 19.          List of Abbreviation


LIST OF FIGURES

Figure 1.           South & Central America Virtual Pipeline Systems Market Segmentation

Figure 2.           South & Central America Virtual Pipeline Systems Market Segmentation – By Country

Figure 3.           South & Central America Virtual Pipeline Systems Market Overview

Figure 4.           South & Central America Virtual Pipeline Systems Market, By Type

Figure 5.           South & Central America Virtual Pipeline Systems Market, By Country

Figure 6.           South America – PEST Analysis

Figure 7.           Virtual Pipeline Systems Market- Ecosystem Analysis

Figure 8.           South & Central America Virtual Pipeline Systems Market Impact Analysis of Drivers and Restraints

Figure 9.           South & Central America Virtual Pipeline Systems Market Revenue Forecast and Analysis (US$ Million)

Figure 10.        SAM: Virtual Pipeline Systems Market Revenue Share, by Type (2021 & 2028)

Figure 11.        South & Central America Standard Trailer: Virtual Pipeline Systems Market – Revenue and Forecast to 2028 (US$ Million)

Figure 12.        South & Central America Towable Trailer: Virtual Pipeline Systems Market – Revenue and Forecast to 2028 (US$ Million)

Figure 13.        SAM: Virtual Pipeline Systems Market Revenue Share, by Gas (2021 & 2028)

Figure 14.        South & Central America CNG: Virtual Pipeline Systems Market – Revenue and Forecast to 2028 (US$ Million)

Figure 15.        South & Central America Hydrogen: Virtual Pipeline Systems Market – Revenue and Forecast to 2028 (US$ Million)

Figure 16.        South & Central America Others: Virtual Pipeline Systems Market – Revenue and Forecast to 2028 (US$ Million)

Figure 17.        SAM: Virtual Pipeline Systems Market Revenue Share, by Pressure Rating (2021 & 2028)

Figure 18.        South & Central America Less than 3000 Psi: Virtual Pipeline Systems Market – Revenue and Forecast to 2028 (US$ Million)

Figure 19.        South & Central America 3001 Psi to 5000 Psi: Virtual Pipeline Systems Market – Revenue and Forecast to 2028 (US$ Million)

Figure 20.        South & Central America More than 5001 Psi: Virtual Pipeline Systems Market – Revenue and Forecast to 2028 (US$ Million)

Figure 21.        SAM: Virtual Pipeline Systems Market Revenue Share, by Application (2021 & 2028)

Figure 22.        South & Central America Industrial: Virtual Pipeline Systems Market – Revenue and Forecast to 2028 (US$ Million)

Figure 23.        South & Central America Transportation: Virtual Pipeline Systems Market – Revenue and Forecast to 2028 (US$ Million)

Figure 24.        South & Central America Commercial & Residential: Virtual Pipeline Systems Market – Revenue and Forecast to 2028 (US$ Million)

Figure 25.        SAM: Virtual Pipeline Systems Market – Revenue and Forecast to 2028 (US$ Million)

Figure 26.        SAM: Virtual Pipeline Systems Market Revenue Share, by Key Country (2021 & 2028)

Figure 27.        Brazil: Virtual Pipeline Systems Market – Revenue and Forecast to 2028 (US$ Million)

Figure 28.        Argentina: Virtual Pipeline Systems Market – Revenue and Forecast to 2028 (US$ Million)

Figure 29.        Rest of SAM: Virtual Pipeline Systems Market – Revenue and Forecast to 2028 (US$ Million)

  1. Galileo Technologies S.A.                                            
  2. Bayotech, Inc.                                                                  
  3. Petroliam Nasional Berhad (PETRONAS)                               
  4. Quantum Fuel Systems LLC.                                       
  5. Chart Industries, Inc.                                                     
  6. Fiba Technologies Inc.                                                   
  7. Hexagon Agility       
  8. Composite Advanced Technologies, LLC.
  • Save and reduce time carrying out entry-level research by identifying the growth, size, leading players, and segments in the South & Central America virtual pipeline systems market.
  • Highlights key business priorities in order to assist companies to realign their business strategies.
  • The key findings and recommendations highlight crucial progressive industry trends in South & Central America virtual pipeline systems market, thereby allowing players across the value chain to develop effective long-term strategies.
  • Develop/modify business expansion plans by using substantial growth offering developed and emerging markets.
  • Scrutinize in-depth South & Central America market trends and outlook coupled with the factors driving the market, as well as those hindering it.
  • Enhance the decision-making process by understanding the strategies that underpin security interest with respect to client products, segmentation, pricing and distribution.
Report Code
Full Name
Country Name
Email Id
Phone Number
Job Title
Company
Requirement

Note : Your data will never be shared with third parties, however, we may send you information from time to time about our products that may be of interest to you. By submitting your details, you agree to be contacted by us. You may contact us at any time to opt-out.


Purchase Options
Single User License
$3000
$2400
Site License
$4000
$3200
Enterprise License
$5000
$4000