Asia Pacific Virtual Pipeline Systems Market Forecast to 2028 - COVID-19 Impact and Regional Analysis by Type (Standard Trailer and Towable Trailer), Gas (CNG, Hydrogen, and Others), Pressure Rating (Less than 3000 Psi, 3001 Psi to 5000 Psi, and More than 5001 Psi), and Application (Industrial, Transportation, and Commercial & Residential)

BMIRE00027665 | Pages: 117 | Energy and Power | Dec 2022 | Type: Regional | Status: Published

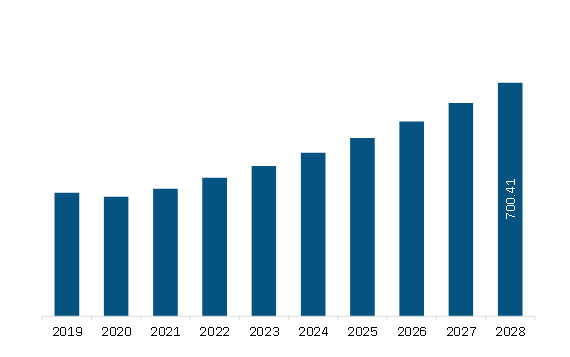
The virtual pipeline systems market in Asia Pacific is expected to grow from US$ 414.22 million in 2022 to US$ 700.41 million by 2028. It is estimated to grow at a CAGR of 9.1% from 2022 to 2028.

Growing Inclination towards Consumption of Natural Gas

Increased investments in natural gas research and development by oil & gas and energy businesses are anticipated to provide significant growth opportunities for the future growth of companies in the virtual pipeline system market. These R&D activities are mainly driven by their goal of promoting the use of low-emission natural gas products. Virtual pipeline vendors focus on technology innovations, new product launches, product approvals, and geographic expansion to capture larger consumer and market base volume. Furthermore, Asia Pacific countries have significantly transitioned towards natural gas consumption. For instance, Malaysia is on course to becoming an LNG bunkering hub, with Petronas' first LNG bunkering vessel (LBV). Malaysia is also expected to increase gas supply via its virtual pipeline system (VPS). In September, national gas company Petronas launched its first LNG VPS solution in Peninsular Malaysia via the regasification terminal in Pengerang, Johor. This follows the earlier success of micro-LNG VPS facilities by Sabah Energy Corp at the Kota Kinabalu Industrial Park (KKIP) that serves the Sabah state. Hence, the rising transition toward natural gas is anticipated to create lucrative opportunities for the virtual pipeline system market. Further, aging pipeline infrastructure has been a major concern for governments across the region. As a result, they are striving to find alternatives to the conventional methods of oil and gas transportation. Hence, strict government regulations for ensuring environmental protection from carbon emissions and oil spills are anticipated to create lucrative opportunities for the virtual pipeline market vendors.

Market Overview

China, India, South Korea, Japan, and Australia are among the key economies in APAC. The swift developments in technologies, favourable initiatives by governments, digitalization of economies, and increasing disposable income of the middle-income class group are among the factors propelling the region's overall economic growth. As a result of the massive network of CNG stations, the country has a sprawling virtual pipeline network. China and India are projected to be major natural gas consumers owing to their focus on creating a cleaner environment. Energy consumption of APAC is anticipated to rise by up to 48% by 2050. The IEA projects that China will lead the Asia Pacific energy consumption with a share of 30% by 2025. The natural gas imports of the country have been rising steadily and would reach 138.371 cm in 2020. CNPC, China National Offshore Oil Corporation, and other state-owned businesses in China have plans to increase output at nearby gas fields, increasing the demand for pipelines in the area. India is also updating its gas pipeline infrastructure to be able to effectively meet the rising energy demand. The Indian government planned a pipeline project for the union territory of Jammu and Kashmir in the annual budget for 2021. The country also expects to invest US$ 66 billion in the construction of the gas infrastructure, which includes gas pipelines, compressed natural gas (CGD), and LNG regasification terminals. It further intends to increase the share of natural gas in the energy mix to 15% by 2023. In December 2020, the Indian government announced an investment of US$ 60 billion for building gas pipeline infrastructure for the extension of CGD pipeline networks in 232 different regions in the nation by 2024. Thus, the expansion of pipeline infrastructure and rising demand for virtual pipeline system. are the key contributors to the growth of the virtual pipeline system market in APAC. In October 2019, Gas Malaysia Virtual Pipeline Sdn Bhd (GMVP) and Kulim Green Energy Ventures Sdn Bhd signed a gas purchase agreement. Kulim Green Energy Ventures Sdn Bhd is a joint venture between Kulim (M) Bhd, O'Rec IND Sdn Bhd, and MTC Engineering Sdn Bhd. According to the agreement, GMVP would purchase biomethane from Kulim Green Energy for injection into the Natural Gas Distribution System (NGDS) network of Gas Malaysia. The company plans to convert palm oil mill wastewater into biomethane, which would then be upgraded to NGDS network natural gas specifications. Such agreements and collaborations between energy companies are further expected to support the virtual pipeline system market growth in APAC countries in the coming years.

Asia Pacific Virtual Pipeline Systems Market Revenue and Forecast to 2028 (US$ Million)

Asia Pacific Virtual Pipeline Systems Market Revenue and Forecast to 2028 (US$ Million)

Get more information on this report :

Asia Pacific Virtual Pipeline Systems Market Segmentation

The Asia Pacific virtual pipeline systems market is segmented into type, gas, pressure rating, application, and country. 

Based on type, the market is segmented into standard trailer and towable trailer. The standard trailer segment held a larger market share in 2022.

Based on gas, the market is segmented into CNG, hydrogen, and others. The CNG segment held the largest market share in 2022.

Based on pressure rating, the market is segmented into less than 3000 Psi, 3001 Psi to 5000 Psi, and more than 5001 Psi. The 3001 Psi to 5000 Psi segment held the largest market share in 2022.

Based on application, the market is segmented into industrial, transportation, and commercial & residential. The transportation segment held the largest market share in 2022.

Based on country, the market is segmented into China, Japan, India, South Korea, Australia, and the Rest of Asia Pacific. China dominated the market share in 2022.

Galileo Technologies S.A.; Bayotech, Inc.; Petroliam Nasional Berhad (PETRONAS); RAG Austria AG; Quantum Fuel Systems LLC.; Chart Industries, Inc.; SHIJIAZHUANG ENRIC GAS EQUIPMENTCO.LTD; Fiba Technologies Inc.; Hexagon Agility; and Composite Advanced Technologies, LLC are the leading companies operating in the virtual pipeline systems market in the region.

1.           Introduction

1.1         Study Scope

1.2         The Insight Partners Research Report Guidance

1.3         Market Segmentation

2.           Key Takeaways

3.        Research Methodology

3.1         Coverage

3.2         Secondary Research

3.3         Primary Research

4.           Asia Pacific Virtual Pipeline Systems Market Landscape

4.1         Market Overview

4.2         PEST Analysis

4.2.1        Asia-Pacific

4.3         Ecosystem Analysis

4.4         Expert Opinions

5.           Asia Pacific Virtual Pipeline Systems Market –  Key Market Dynamics

5.1         Market Drivers

5.1.1        Increasing Energy Demands Creating Need for Virtual Pipeline Systems

5.1.2        Rising Shale Gas Extraction Driving Demand for Virtual Pipeline System

5.2         Market Restraints

5.2.1        Significant Dominance of Conventional Pipeline Infrastructure

5.3         Market Opportunities

5.3.1        Growing Inclination towards Consumption of Natural Gas

5.4         Future Trends

5.4.1        Growing Investment in VPS Technologies

5.5         Impact Analysis of Drivers And Restraints

6.           Virtual Pipeline Systems – Asia Pacific Market Analysis

6.1         Asia Pacific Virtual Pipeline Systems Market Overview

6.2         Asia Pacific Virtual Pipeline Systems Market Revenue Forecast and Analysis

7.           Asia Pacific Virtual Pipeline Systems Market –  By Type

7.1         Overview

7.2         Asia Pacific Virtual Pipeline Systems Market, By Type (2021 and 2028)

7.3         Standard Trailer

7.3.1        Overview

7.3.2        Asia Pacific Standard Trailer: Virtual Pipeline Systems Market – Revenue and Forecast to 2028 (US$ Million)

7.4         Towable Trailer

7.4.1        Overview

7.4.2        Asia Pacific Towable Trailer: Virtual Pipeline Systems Market – Revenue and Forecast to 2028 (US$ Million)

8.           Asia Pacific Virtual Pipeline Systems Market – By Gas

8.1         Overview

8.2         Asia Pacific Virtual Pipeline Systems Market, By Gas (2021 and 2028)

8.3         CNG

8.3.1        Overview

8.3.2        Asia Pacific CNG: Virtual Pipeline Systems Market – Revenue and Forecast to 2028 (US$ Million)

8.4         Hydrogen

8.4.1        Overview

8.4.2        Asia Pacific Hydrogen: Virtual Pipeline Systems Market – Revenue and Forecast to 2028 (US$ Million)

8.5         Others

8.5.1        Overview

8.5.2        Asia Pacific Others: Virtual Pipeline Systems Market – Revenue and Forecast to 2028 (US$ Million)

9.           Asia Pacific Virtual Pipeline systems Market – By Pressure Rating

9.1         Overview

9.2         Asia Pacific Virtual Pipeline Systems Market, By Pressure Rating (2021 and 2028)

9.3         Less than 3000 Psi

9.3.1        Overview

9.3.2        Asia Pacific Less than 3000 Psi: Virtual Pipeline Systems Market – Revenue and Forecast to 2028 (US$ Million)

9.41 Psi to 5000 Psi

9.4.1        Overview

9.4.2        Asia Pacific 3001 Psi to 5000 Psi: Virtual Pipeline Systems Market – Revenue and Forecast to 2028 (US$ Million)

9.5         More than 5001 Psi

9.5.1        Overview

9.5.2        Asia Pacific More than 5001 Psi: Virtual Pipeline Systems Market – Revenue and Forecast to 2028 (US$ Million)

10.        Asia Pacific Virtual Pipeline Systems Market –  By Application

10.1      Overview

10.2      Asia Pacific Virtual Pipeline Systems Market, By Application (2021 and 2028)

10.3      Industrial

10.3.1     Overview

10.3.2     Asia Pacific Industrial: Virtual Pipeline Systems Market – Revenue and Forecast to 2028 (US$ Million)

10.4      Transportation

10.4.1     Overview

10.4.2     Asia Pacific Transportation: Virtual Pipeline Systems Market – Revenue and Forecast to 2028 (US$ Million)

10.5      Commercial & Residential

10.5.1     Overview

10.5.2     Asia Pacific Commercial & Residential: Virtual Pipeline Systems Market – Revenue and Forecast to 2028 (US$ Million)

11.        Asia Pacific Virtual Pipeline Systems Market – Country Analysis

11.1      APAC: Virtual Pipeline Systems Market

11.1.1     APAC: Virtual Pipeline Systems Market – Revenue and Forecast to 2028 (US$ Million)

11.1.2     APAC: Virtual Pipeline Systems Market, By Key Country

11.1.2.1       Australia: Virtual Pipeline Systems Market – Revenue and Forecast to 2028 (US$ Million)

11.1.2.1.1       Australia: Virtual Pipeline Systems Market, By Type

11.1.2.1.2       Australia: Virtual Pipeline Systems Market, By Gas

11.1.2.1.3       Australia: Virtual Pipeline Systems Market, By Pressure Rating

11.1.2.1.4       Australia: Virtual Pipeline Systems Market, By Application

11.1.2.2       China: Virtual Pipeline Systems Market – Revenue and Forecast to 2028 (US$ Million)

11.1.2.2.1       China: Virtual Pipeline Systems Market, By Type

11.1.2.2.2       China: Virtual Pipeline Systems Market, By Gas

11.1.2.2.3       China: Virtual Pipeline Systems Market, By Pressure Rating

11.1.2.2.4       China: Virtual Pipeline Systems Market, By Application

11.1.2.3       India: Virtual Pipeline Systems Market – Revenue and Forecast to 2028 (US$ Million)

11.1.2.3.1       India: Virtual Pipeline Systems Market, By Type

11.1.2.3.2       India: Virtual Pipeline Systems Market, By Gas

11.1.2.3.3       India: Virtual Pipeline Systems Market, By Pressure Rating

11.1.2.3.4       India: Virtual Pipeline Systems Market, By Application

11.1.2.4       Japan: Virtual Pipeline Systems Market – Revenue and Forecast to 2028 (US$ Million)

11.1.2.4.1       Japan: Virtual Pipeline Systems Market, By Type

11.1.2.4.2       Japan: Virtual Pipeline Systems Market, By Gas

11.1.2.4.3       Japan: Virtual Pipeline Systems Market, By Pressure Rating

11.1.2.4.4       Japan: Virtual Pipeline Systems Market, By Application

11.1.2.5       South Korea: Virtual Pipeline Systems Market – Revenue and Forecast to 2028 (US$ Million)

11.1.2.5.1       South Korea: Virtual Pipeline Systems Market, By Type

11.1.2.5.2       South Korea: Virtual Pipeline Systems Market, By Gas

11.1.2.5.3       South Korea: Virtual Pipeline Systems Market, By Pressure Rating

11.1.2.5.4       South Korea: Virtual Pipeline Systems Market, By Application

11.1.2.6       Rest of APAC: Virtual Pipeline Systems Market – Revenue and Forecast to 2028 (US$ Million)

11.1.2.6.1       Rest of APAC: Virtual Pipeline Systems Market, By Type

11.1.2.6.2       Rest of APAC: Virtual Pipeline Systems Market, By Gas

11.1.2.6.3       Rest of APAC: Virtual Pipeline Systems Market, By Pressure Rating

11.1.2.6.4       Rest of APAC: Virtual Pipeline Systems Market, By Application

12.        Industry Landscape

12.1      Overview

12.2      New Product Launch

12.3      Merger and Acquisition

13.        Company Profiles

13.1      Bayotech, Inc.

13.1.1     Key Facts

13.1.2     Business Description

13.1.3     Products and Services

13.1.4     Financial Overview

13.1.5     SWOT Analysis

13.1.6     Key Developments

13.2      Petroliam Nasional Berhad (PETRONAS)

13.2.1     Key Facts

13.2.2     Business Description

13.2.3     Products and Services

13.2.4     Financial Overview

13.2.5     SWOT Analysis

13.2.6     Key Developments

13.3      RAG Austria AG

13.3.1     Key Facts

13.3.2     Business Description

13.3.3     Products and Services

13.3.4     Financial Overview

13.3.5     SWOT Analysis

13.3.6     Key Developments

13.4      Quantum Fuel Systems LLC.

13.4.1     Key Facts

13.4.2     Business Description

13.4.3     Products and Services

13.4.4     Financial Overview

13.4.5     SWOT Analysis

13.4.6     Key Developments

13.5      Chart Industries, Inc.

13.5.1     Key Facts

13.5.2     Business Description

13.5.3     Products and Services

13.5.4     Financial Overview

13.5.5     SWOT Analysis

13.5.6     Key Developments

13.6      SHIJIAZHUANG ENRIC GAS EQUIPMENT CO., LTD.

13.6.1     Key Facts

13.6.2     Business Description

13.6.3     Products and Services

13.6.4     Financial Overview

13.6.5     SWOT Analysis

13.6.6     Key Developments

13.7      Fiba Technologies Inc

13.7.1     Key Facts

13.7.2     Business Description

13.7.3     Products and Services

13.7.4     Financial Overview

13.7.5     SWOT Analysis

13.7.6     Key Developments

13.8      Hexagon Agility

13.8.1     Key Facts

13.8.2     Business Description

13.8.3     Products and Services

13.8.4     Financial Overview

13.8.5     SWOT Analysis

13.8.6     Key Developments

14.        Appendix

14.1      About The Insight Partners

14.2      Word Index


LIST OF TABLES

Table 1.             Asia Pacific Virtual Pipeline Systems Market Revenue and Forecast to 2028 (US$ Million)

Table 2.             APAC: Virtual Pipeline Systems Market, By Type – Revenue and Forecast to 2028 (US$ Million)

Table 3.             APAC: Virtual Pipeline Systems Market, By Gas – Revenue and Forecast to 2028 (US$ Million)

Table 4.             APAC: Virtual Pipeline Systems Market, By Pressure Rating – Revenue and Forecast to 2028 (US$ Million)

Table 5.             APAC: Virtual Pipeline Systems Market, By Application – Revenue and Forecast to 2028 (US$ Million)

Table 6.             APAC: Virtual Pipeline Systems Market, By Country – Revenue and Forecast to 2028 (US$ Million)

Table 7.             Australia: Virtual Pipeline Systems Market, By Type – Revenue and Forecast to 2028 (US$ Million)

Table 8.             Australia: Virtual Pipeline Systems Market, By Gas – Revenue and Forecast to 2028 (US$ Million)

Table 9.             Australia: Virtual Pipeline Systems Market, By Pressure Rating – Revenue and Forecast to 2028 (US$ Million)

Table 10.          Australia: Virtual Pipeline Systems Market, By Application – Revenue and Forecast to 2028 (US$ Million)

Table 11.          China: Virtual Pipeline Systems Market, By Type – Revenue and Forecast to 2028 (US$ Million)

Table 12.          China: Virtual Pipeline Systems Market, By Gas – Revenue and Forecast to 2028 (US$ Million)

Table 13.          China: Virtual Pipeline Systems Market, By Pressure Rating – Revenue and Forecast to 2028 (US$ Million)

Table 14.          China: Virtual Pipeline Systems Market, By Application – Revenue and Forecast to 2028 (US$ Million)

Table 15.          India: Virtual Pipeline Systems Market, By Type – Revenue and Forecast to 2028 (US$ Million)

Table 16.          India: Virtual Pipeline Systems Market, By Gas – Revenue and Forecast to 2028 (US$ Million)

Table 17.          India: Virtual Pipeline Systems Market, By Pressure Rating – Revenue and Forecast to 2028 (US$ Million)

Table 18.          India: Virtual Pipeline Systems Market, By Application – Revenue and Forecast to 2028 (US$ Million)

Table 19.          Japan: Virtual Pipeline Systems Market, By Type – Revenue and Forecast to 2028 (US$ Million)

Table 20.          Japan: Virtual Pipeline Systems Market, By Gas – Revenue and Forecast to 2028 (US$ Million)

Table 21.          Japan: Virtual Pipeline Systems Market, By Pressure Rating – Revenue and Forecast to 2028 (US$ Million)

Table 22.          Japan: Virtual Pipeline Systems Market, By Application – Revenue and Forecast to 2028 (US$ Million)

Table 23.          South Korea: Virtual Pipeline Systems Market, By Type – Revenue and Forecast to 2028 (US$ Million)

Table 24.          South Korea: Virtual Pipeline Systems Market, By Gas – Revenue and Forecast to 2028 (US$ Million)

Table 25.          South Korea: Virtual Pipeline Systems Market, By Pressure Rating – Revenue and Forecast to 2028 (US$ Million)

Table 26.          South Korea: Virtual Pipeline Systems Market, By Application – Revenue and Forecast to 2028 (US$ Million)

Table 27.          Rest of APAC: Virtual Pipeline Systems Market, By Type – Revenue and Forecast to 2028 (US$ Million)

Table 28.          Rest of APAC: Virtual Pipeline Systems Market, By Gas – Revenue and Forecast to 2028 (US$ Million)

Table 29.          Rest of APAC: Virtual Pipeline Systems Market, By Pressure Rating – Revenue and Forecast to 2028 (US$ Million)

Table 30.          Rest of APAC: Virtual Pipeline Systems Market, By Application – Revenue and Forecast to 2028 (US$ Million)

Table 31.          List of Abbreviation


LIST OF FIGURES

Figure 1.           Asia Pacific Virtual Pipeline Systems Market Segmentation

Figure 2.           Asia Pacific Virtual Pipeline Systems Market Segmentation – By Country

Figure 3.           Asia Pacific Virtual Pipeline Systems Market Overview

Figure 4.           Asia Pacific Virtual Pipeline Systems Market, By Type

Figure 5.           Asia Pacific Virtual Pipeline Systems Market, By Country

Figure 6.           Asia-Pacific – PEST Analysis

Figure 7.           Asia Pacific Virtual Pipeline Systems Market- Ecosystem Analysis

Figure 8.           Asia Pacific Virtual Pipeline Systems Market Impact Analysis of Drivers and Restraints

Figure 9.           Asia Pacific Virtual Pipeline Systems Market Revenue Forecast and Analysis (US$ Million)

Figure 10.        APAC: Virtual Pipeline Systems Market Revenue Share, by Type (2021 & 2028)

Figure 11.        Asia Pacific Standard Trailer: Virtual Pipeline Systems Market – Revenue and Forecast to 2028 (US$ Million)

Figure 12.        Asia Pacific Towable Trailer: Virtual Pipeline Systems Market – Revenue and Forecast to 2028 (US$ Million)

Figure 13.        APAC: Virtual Pipeline Systems Market Revenue Share, by Gas (2021 & 2028)

Figure 14.        Asia Pacific CNG: Virtual Pipeline Systems Market – Revenue and Forecast to 2028 (US$ Million)

Figure 15.        Asia Pacific Hydrogen: Virtual Pipeline Systems Market – Revenue and Forecast to 2028 (US$ Million)

Figure 16.        Asia Pacific Others: Virtual Pipeline Systems Market – Revenue and Forecast to 2028 (US$ Million)

Figure 17.        APAC: Virtual Pipeline Systems Market Revenue Share, by Pressure Rating (2021 & 2028)

Figure 18.        Asia Pacific Less than 3000 Psi: Virtual Pipeline Systems Market – Revenue and Forecast to 2028 (US$ Million)

Figure 19.        Asia Pacific 3001 Psi to 5000 Psi: Virtual Pipeline Systems Market – Revenue and Forecast to 2028 (US$ Million)

Figure 20.        Asia Pacific More than 5001 Psi: Virtual Pipeline Systems Market – Revenue and Forecast to 2028 (US$ Million)

Figure 21.        APAC: Virtual Pipeline Systems Market Revenue Share, by Application (2021 & 2028)

Figure 22.        Asia Pacific Industrial: Virtual Pipeline Systems Market – Revenue and Forecast to 2028 (US$ Million)

Figure 23.        Asia Pacific Transportation: Virtual Pipeline Systems Market – Revenue and Forecast to 2028 (US$ Million)

Figure 24.        Asia Pacific Commercial & Residential: Virtual Pipeline Systems Market – Revenue and Forecast to 2028 (US$ Million)

Figure 25.        APAC: Virtual Pipeline Systems Market – Revenue and Forecast to 2028 (US$ Million)

Figure 26.        APAC: Virtual Pipeline Systems Market Revenue Share, by Key Country (2021 & 2028)

Figure 27.        Australia: Virtual Pipeline Systems Market – Revenue and Forecast to 2028 (US$ Million)

Figure 28.        China: Virtual Pipeline Systems Market – Revenue and Forecast to 2028 (US$ Million)

Figure 29.        India: Virtual Pipeline Systems Market – Revenue and Forecast to 2028 (US$ Million)

Figure 30.        Japan: Virtual Pipeline Systems Market – Revenue and Forecast to 2028 (US$ Million)

Figure 31.        South Korea: Virtual Pipeline Systems Market – Revenue and Forecast to 2028 (US$ Million)

Figure 32.        Rest of APAC: Virtual Pipeline Systems Market – Revenue and Forecast to 2028 (US$ Million)

  1. Galileo Technologies S.A.
  2. Bayotech, Inc.
  3. Petroliam Nasional Berhad (PETRONAS)
  4. RAG Austria AG
  5. Quantum Fuel Systems LLC.
  6. Chart Industries, Inc.
  7. SHIJIAZHUANG ENRIC GAS EQUIPMENT CO., LTD
  8. Fiba Technologies Inc.
  9. Hexagon Agility
  10. Composite Advanced Technologies, LLC.
  • Save and reduce time carrying out entry-level research by identifying the growth, size, leading players, and segments in the Asia Pacific virtual pipeline systems market.
  • Highlights key business priorities in order to assist companies to realign their business strategies.
  • The key findings and recommendations highlight crucial progressive industry trends in Asia Pacific virtual pipeline systems market, thereby allowing players across the value chain to develop effective long-term strategies.
  • Develop/modify business expansion plans by using substantial growth offering developed and emerging markets.
  • Scrutinize in-depth Asia Pacific market trends and outlook coupled with the factors driving the market, as well as those hindering it.
  • Enhance the decision-making process by understanding the strategies that underpin security interest with respect to client products, segmentation, pricing and distribution.
Report Code
Full Name
Country Name
Email Id
Phone Number
Job Title
Company
Requirement

Note : Your data will never be shared with third parties, however, we may send you information from time to time about our products that may be of interest to you. By submitting your details, you agree to be contacted by us. You may contact us at any time to opt-out.


Purchase Options
Single User License
$3000
$2400
Site License
$4000
$3200
Enterprise License
$5000
$4000