Europe Virtual Pipeline Systems Market Forecast to 2028 – COVID-19 Impact and Regional Analysis – by Type (Standard Trailer and Towable Trailer), Gas (CNG, Hydrogen, and Others), Pressure Rating (Less than 3000 Psi, 3001 Psi to 5000 Psi, and More than 5001 Psi), and Application (Industrial, Transportation, and Commercial & Residential)

BMIRE00027715 | Pages: 118 | Energy and Power | Dec 2022 | Type: Regional | Status: Published

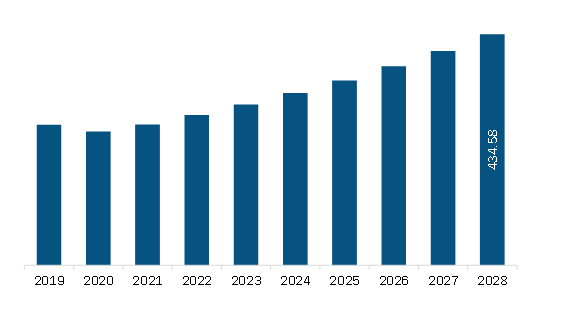
The virtual pipeline systems market in Europe is expected to grow from US$ 282.32 million in 2022 to US$ 434.58 million by 2028. It is estimated to grow at a CAGR of 7.5% from 2022 to 2028.


Rising Shale Gas Extraction Driving Demand for Virtual Pipeline System

Continuous advancements in shale drilling technologies have made shales the next reliable energy resource. Shale gas can be utilized as a greener energy option in countries that are dependent on coal as an energy source, as it emits less carbon than coal. Shale gas production has resulted in the abundance of natural gas supply across the region. The European Union (EU) is already profiting from the US shale gas boom owing to an increased supply of liquefied natural gas bond for the US and better contractual circumstances for pipeline imports. A new generation of shale gas exploitation methods, with lower costs and fewer environmental footprints, might make indigenous shale gas reserves in the EU appealing in the long term after 2030. Therefore, the increase in shell gas exploration and extraction projects due to developments in related technologies, coupled with the availability of many reserves, is boosting the demand for virtual pipeline systems, thereby boosting the market growth.


Market Overview


Germany, France, the UK, and Italy are among the major economies in Europe. Old pipeline infrastructure and stringent emission control regulations are the two significant factors driving the growth of the virtual pipeline system market in this region. Although the region has a large and rapidly growing pipeline infrastructure, it lacks a modern touch as the existing pipeline systems were set up decades ago. The proliferation of the natural gas sector in response to the growing concerns about sustainability, and the subsequent surge in demand for the transportation of energy resources, benefit the virtual pipeline system market in the region Energy supply sources choose pipes as a preferred mode of transportation due to their universal acceptance. Moreover, governments of several countries have taken various steps to offer notice to industries, comprising oil and gas. Norway and Russia have maintained their position as natural gas suppliers, whereas Germany, France, and Italy are the main importers of natural gas. Thus, many offshore projects for oil & gas would accelerate the demand for the virtual pipeline system market. The European Union is committed to reducing its carbon emissions to meet its EU2020 goal. Private and government organizations are investing heavily in virtual pipelines to supply cleaner energy. Moreover, to fulfil the increased energy demands of the UK, Germany, Italy, and France, among others, Russia is investing significantly in natural gas production.


Europe Virtual Pipeline Systems Market Revenue and Forecast to 2028 (US$ Million)

Europe Virtual Pipeline Systems Market Revenue and Forecast to 2028 (US$ Million)

Get more information on this report :

Europe Virtual Pipeline Systems Market Segmentation


The Europe virtual pipeline systems market is segmented into type, gas, pressure rating, application, and country. 


Based on type, the market is segmented into standard trailer and towable trailer. The standard trailer segment registered a larger market share in 2022.


Based on gas, the market is segmented into CNG, hydrogen, and others. The CNG segment held the largest market share in 2022.


Based on pressure rating, the market is segmented into less than 3000 Psi, 3001 Psi to 5000 Psi, and more than 5001 Psi. The 3001 Psi to 5000 Psi segment held the largest market share in 2022.


Based on application, the market is segmented into industrial, transportation, and commercial & residential. The transportation segment held the largest market share in 2022.


Based on country, the market is segmented into France, Germany, the UK, Italy, Russia, and the Rest of Europe. Germany dominated the market share in 2022.


Galileo Technologies S.A.; Bayotech, Inc.; Petroliam Nasional Berhad (PETRONAS); RAG Austria AG; Quantum Fuel Systems LLC.; Chart Industries, Inc.; SHIJIAZHUANG ENRIC GAS EQUIPMENTCO.LTD; Fiba Technologies Inc.; Hexagon Agility; and Composite Advanced Technologies, LLC are the leading companies operating in the virtual pipeline systems market in the region.

1.           Introduction

1.1         Study Scope

1.2         The Insight Partners Research Report Guidance

1.3         Market Segmentation

2.           Key Takeaways

3.        Research Methodology

3.1         Coverage

3.2         Secondary Research

3.3         Primary Research

4.           Europe Virtual Pipeline Systems Market Landscape

4.1         Market Overview

4.2         PEST Analysis

4.2.1        Europe

4.3         Ecosystem Analysis

4.4         Expert Opinions

5.           Europe Virtual Pipeline Systems Market – Key Market Dynamics

5.1         Market Drivers

5.1.1        Increasing Energy Demands Creating Need for Virtual Pipeline Systems

5.1.2        Rising Shale Gas Extraction Driving Demand for Virtual Pipeline System

5.2         Market Restraints

5.2.1        Significant Dominance of Conventional Pipeline Infrastructure

5.3         Market Opportunities

5.3.1        Growing Inclination towards Consumption of Natural Gas

5.4         Future Trends

5.4.1        Growing Investment in VPS Technologies

5.5         Impact Analysis of Drivers and Restraints

6.           Virtual Pipeline Systems – Europe Market Analysis

6.1         Europe Virtual Pipeline Systems Market Overview

6.2         Europe Virtual Pipeline Systems Market Revenue Forecast and Analysis

7.           Europe Virtual Pipeline Systems Market – By Type

7.1         Overview

7.2         Europe Virtual Pipeline Systems Market, By Type (2021 and 2028)

7.3         Standard Trailer

7.3.1        Overview

7.3.2        Europe Standard Trailer: Virtual Pipeline Systems Market – Revenue and Forecast to 2028 (US$ Million)

7.4         Towable Trailer

7.4.1        Overview

7.4.2        Europe Towable Trailer: Virtual Pipeline Systems Market – Revenue and Forecast to 2028 (US$ Million)

8.           Europe Virtual Pipeline Systems Market – By Gas

8.1         Overview

8.2         Europe Virtual Pipeline Systems Market, By Gas (2021 and 2028)

8.3         CNG

8.3.1        Overview

8.3.2        Europe CNG: Virtual Pipeline Systems Market – Revenue and Forecast to 2028 (US$ Million)

8.4         Hydrogen

8.4.1        Overview

8.4.2        Europe Hydrogen: Virtual Pipeline Systems Market – Revenue and Forecast to 2028 (US$ Million)

8.5         Others

8.5.1        Overview

8.5.2        Europe Others: Virtual Pipeline Systems Market – Revenue and Forecast to 2028 (US$ Million)

9.           Europe Virtual pipeline systems Market – By Pressure Rating

9.1         Overview

9.2         Europe Virtual Pipeline Systems Market, By Pressure Rating (2021 and 2028)

9.3         Less than 3000 Psi

9.3.1        Overview

9.3.2        Europe Less than 3000 Psi: Virtual Pipeline Systems Market – Revenue and Forecast to 2028 (US$ Million)

9.41 Psi to 5000 Psi

9.4.1        Overview

9.4.2        Europe 3001 Psi to 5000 Psi: Virtual Pipeline Systems Market – Revenue and Forecast to 2028 (US$ Million)

9.5         More than 5001 Psi

9.5.1        Overview

9.5.2        Europe More than 5001 Psi: Virtual Pipeline Systems Market – Revenue and Forecast to 2028 (US$ Million)

10.        Europe Virtual Pipeline Systems Market – By Application

10.1      Overview

10.2      Europe Virtual Pipeline Systems Market, By Application (2021 and 2028)

10.3      Industrial

10.3.1     Overview

10.3.2     Europe Industrial: Virtual Pipeline Systems Market – Revenue and Forecast to 2028 (US$ Million)

10.4      Transportation

10.4.1     Overview

10.4.2     Europe Transportation: Virtual Pipeline Systems Market – Revenue and Forecast to 2028 (US$ Million)

10.5      Commercial & Residential

10.5.1     Overview

10.5.2     Europe Commercial & Residential: Virtual Pipeline Systems Market – Revenue and Forecast to 2028 (US$ Million)

11.        Europe Virtual Pipeline Systems Market – Country Analysis

11.1      Europe: Virtual Pipeline Systems Market

11.1.1     Europe: Virtual Pipeline Systems Market – Revenue and Forecast to 2028 (US$ Million)

11.1.2     Europe: Virtual Pipeline Systems Market, By Key Country

11.1.2.1       Germany: Virtual Pipeline Systems Market – Revenue and Forecast to 2028 (US$ Million)

11.1.2.1.1       Germany: Virtual Pipeline Systems Market, By Type

11.1.2.1.2       Germany: Virtual Pipeline Systems Market, By Gas

11.1.2.1.3       Germany: Virtual Pipeline Systems Market, By Pressure Rating

11.1.2.1.4       Germany: Virtual Pipeline Systems Market, By Application

11.1.2.2       France: Virtual Pipeline Systems Market – Revenue and Forecast to 2028 (US$ Million)

11.1.2.2.1       France: Virtual Pipeline Systems Market, By Type

11.1.2.2.2       France: Virtual Pipeline Systems Market, By Gas

11.1.2.2.3       France: Virtual Pipeline Systems Market, By Pressure Rating

11.1.2.2.4       France: Virtual Pipeline Systems Market, By Application

11.1.2.3       Italy: Virtual Pipeline Systems Market – Revenue and Forecast to 2028 (US$ Million)

11.1.2.3.1       Italy: Virtual Pipeline Systems Market, By Type

11.1.2.3.2       Italy: Virtual Pipeline Systems Market, By Gas

11.1.2.3.3       Italy: Virtual Pipeline Systems Market, By Pressure Rating

11.1.2.3.4       Italy: Virtual Pipeline Systems Market, By Application

11.1.2.4       UK: Virtual Pipeline Systems Market – Revenue and Forecast to 2028 (US$ Million)

11.1.2.4.1       UK: Virtual Pipeline Systems Market, By Type

11.1.2.4.2       UK: Virtual Pipeline Systems Market, By Gas

11.1.2.4.3       UK: Virtual Pipeline Systems Market, By Pressure Rating

11.1.2.4.4       UK: Virtual Pipeline Systems Market, By Application

11.1.2.5       Russia: Virtual Pipeline Systems Market – Revenue and Forecast to 2028 (US$ Million)

11.1.2.5.1       Russia: Virtual Pipeline Systems Market, By Type

11.1.2.5.2       Russia: Virtual Pipeline Systems Market, By Gas

11.1.2.5.3       Russia: Virtual Pipeline Systems Market, By Pressure Rating

11.1.2.5.4       Russia: Virtual Pipeline Systems Market, By Application

11.1.2.6       Rest of Europe: Virtual Pipeline Systems Market – Revenue and Forecast to 2028 (US$ Million)

11.1.2.6.1       Rest of Europe: Virtual Pipeline Systems Market, By Type

11.1.2.6.2       Rest of Europe: Virtual Pipeline Systems Market, By Gas

11.1.2.6.3       Rest of Europe: Virtual Pipeline Systems Market, By Pressure Rating

11.1.2.6.4       Rest of Europe: Virtual Pipeline Systems Market, By Application

12.        Industry Landscape

12.1      Overview

12.2      New Product Launch

12.3      Merger and Acquisition

13.        Company Profiles

13.1      Galileo Technologies S.A.

13.1.1     Key Facts

13.1.2     Business Description

13.1.3     Products and Services

13.1.4     Financial Overview

13.1.5     SWOT Analysis

13.1.6     Key Developments

13.2      Bayotech, Inc.

13.2.1     Key Facts

13.2.2     Business Description

13.2.3     Products and Services

13.2.4     Financial Overview

13.2.5     SWOT Analysis

13.2.6     Key Developments

13.3      Petroliam Nasional Berhad (PETRONAS)

13.3.1     Key Facts

13.3.2     Business Description

13.3.3     Products and Services

13.3.4     Financial Overview

13.3.5     SWOT Analysis

13.3.6     Key Developments

13.4      RAG Austria AG

13.4.1     Key Facts

13.4.2     Business Description

13.4.3     Products and Services

13.4.4     Financial Overview

13.4.5     SWOT Analysis

13.4.6     Key Developments

13.5      Quantum Fuel Systems LLC.

13.5.1     Key Facts

13.5.2     Business Description

13.5.3     Products and Services

13.5.4     Financial Overview

13.5.5     SWOT Analysis

13.5.6     Key Developments

13.6      Chart Industries, Inc.

13.6.1     Key Facts

13.6.2     Business Description

13.6.3     Products and Services

13.6.4     Financial Overview

13.6.5     SWOT Analysis

13.6.6     Key Developments

13.7      SHIJIAZHUANG ENRIC GAS EQUIPMENT CO., LTD.

13.7.1     Key Facts

13.7.2     Business Description

13.7.3     Products and Services

13.7.4     Financial Overview

13.7.5     SWOT Analysis

13.7.6     Key Developments

13.8      Fiba Technologies Inc

13.8.1     Key Facts

13.8.2     Business Description

13.8.3     Products and Services

13.8.4     Financial Overview

13.8.5     SWOT Analysis

13.8.6     Key Developments

13.9      Hexagon Agility

13.9.1     Key Facts

13.9.2     Business Description

13.9.3     Products and Services

13.9.4     Financial Overview

13.9.5     SWOT Analysis

13.9.6     Key Developments

13.10   Composite Advanced Technologies, LLC.

13.10.1  Key Facts

13.10.2  Business Description

13.10.3  Products and Services

13.10.4  Financial Overview

13.10.5  SWOT Analysis

13.10.6  Key Developments

14.        Appendix

14.1      About The Insight Partners

14.2      Word Index


LIST OF TABLES

Table 1.             Europe Virtual Pipeline Systems Market Revenue and Forecast to 2028 (US$ Million)

Table 2.             Europe: Virtual Pipeline Systems Market, By Type – Revenue and Forecast to 2028 (US$ Million)

Table 3.             Europe: Virtual Pipeline Systems Market, By Gas – Revenue and Forecast to 2028 (US$ Million)

Table 4.             Europe: Virtual Pipeline Systems Market, By Pressure Rating – Revenue and Forecast to 2028 (US$ Million)

Table 5.             Europe: Virtual Pipeline Systems Market, By Application – Revenue and Forecast to 2028 (US$ Million)

Table 6.             Europe: Virtual Pipeline Systems Market, By Country – Revenue and Forecast to 2028 (US$ Million)

Table 7.             Germany: Virtual Pipeline Systems Market, By Type – Revenue and Forecast to 2028 (US$ Million)

Table 8.             Germany: Virtual Pipeline Systems Market, By Gas – Revenue and Forecast to 2028 (US$ Million)

Table 9.             Germany: Virtual Pipeline Systems Market, By Pressure Rating – Revenue and Forecast to 2028 (US$ Million)

Table 10.          Germany: Virtual Pipeline Systems Market, By Application – Revenue and Forecast to 2028 (US$ Million)

Table 11.          France: Virtual Pipeline Systems Market, By Type – Revenue and Forecast to 2028 (US$ Million)

Table 12.          France: Virtual Pipeline Systems Market, By Gas – Revenue and Forecast to 2028 (US$ Million)

Table 13.          France: Virtual Pipeline Systems Market, By Pressure Rating – Revenue and Forecast to 2028 (US$ Million)

Table 14.          France: Virtual Pipeline Systems Market, By Application – Revenue and Forecast to 2028 (US$ Million)

Table 15.          Italy: Virtual Pipeline Systems Market, By Type – Revenue and Forecast to 2028 (US$ Million)

Table 16.          Italy: Virtual Pipeline Systems Market, By Gas – Revenue and Forecast to 2028 (US$ Million)

Table 17.          Italy: Virtual Pipeline Systems Market, By Pressure Rating – Revenue and Forecast to 2028 (US$ Million)

Table 18.          Italy: Virtual Pipeline Systems Market, By Application – Revenue and Forecast to 2028 (US$ Million)

Table 19.          UK: Virtual Pipeline Systems Market, By Type – Revenue and Forecast to 2028 (US$ Million)

Table 20.          UK: Virtual Pipeline Systems Market, By Gas – Revenue and Forecast to 2028 (US$ Million)

Table 21.          UK: Virtual Pipeline Systems Market, By Pressure Rating – Revenue and Forecast to 2028 (US$ Million)

Table 22.          UK: Virtual Pipeline Systems Market, By Application – Revenue and Forecast to 2028 (US$ Million)

Table 23.          Russia: Virtual Pipeline Systems Market, By Type – Revenue and Forecast to 2028 (US$ Million)

Table 24.          Russia: Virtual Pipeline Systems Market, By Gas – Revenue and Forecast to 2028 (US$ Million)

Table 25.          Russia: Virtual Pipeline Systems Market, By Pressure Rating – Revenue and Forecast to 2028 (US$ Million)

Table 26.          Russia: Virtual Pipeline Systems Market, By Application – Revenue and Forecast to 2028 (US$ Million)

Table 27.          Rest of Europe: Virtual Pipeline Systems Market, By Type – Revenue and Forecast to 2028 (US$ Million)

Table 28.          Rest of Europe: Virtual Pipeline Systems Market, By Gas – Revenue and Forecast to 2028 (US$ Million)

Table 29.          Rest of Europe: Virtual Pipeline Systems Market, By Pressure Rating – Revenue and Forecast to 2028 (US$ Million)

Table 30.          Rest of Europe: Virtual Pipeline Systems Market, By Application – Revenue and Forecast to 2028 (US$ Million)

Table 31.          List of Abbreviation


LIST OF FIGURES

Figure 1.           Europe Virtual Pipeline Systems Market Segmentation

Figure 2.           Europe Virtual Pipeline Systems Market Segmentation – By Country

Figure 3.           Europe Virtual Pipeline Systems Market Overview

Figure 4.           Europe Virtual Pipeline Systems Market, By Type

Figure 5.           Europe Virtual Pipeline Systems Market, By Country

Figure 6.           Europe – PEST Analysis

Figure 7.           Europe Virtual Pipeline Systems Market- Ecosystem Analysis

Figure 8.           Europe Virtual Pipeline Systems Market Impact Analysis of Drivers and Restraints

Figure 9.           Europe Virtual Pipeline Systems Market Revenue Forecast and Analysis (US$ Million)

Figure 10.        Europe: Virtual Pipeline Systems Market Revenue Share, by Type (2021 & 2028)

Figure 11.        Europe Standard Trailer: Virtual Pipeline Systems Market – Revenue and Forecast to 2028 (US$ Million)

Figure 12.        Europe Towable Trailer: Virtual Pipeline Systems Market – Revenue and Forecast to 2028 (US$ Million)

Figure 13.        Europe: Virtual Pipeline Systems Market Revenue Share, by Gas (2021 & 2028)

Figure 14.        Europe CNG: Virtual Pipeline Systems Market – Revenue and Forecast to 2028 (US$ Million)

Figure 15.        Europe Hydrogen: Virtual Pipeline Systems Market – Revenue and Forecast to 2028 (US$ Million)

Figure 16.        Europe Others: Virtual Pipeline Systems Market – Revenue and Forecast to 2028 (US$ Million)

Figure 17.        Europe: Virtual Pipeline Systems Market Revenue Share, by Pressure Rating (2021 & 2028)

Figure 18.        Europe Less than 3000 Psi: Virtual Pipeline Systems Market – Revenue and Forecast to 2028 (US$ Million)

Figure 19.        Europe 3001 Psi to 5000 Psi: Virtual Pipeline Systems Market – Revenue and Forecast to 2028 (US$ Million)

Figure 20.        Europe More than 5001 Psi: Virtual Pipeline Systems Market – Revenue and Forecast to 2028 (US$ Million)

Figure 21.        Europe: Virtual Pipeline Systems Market Revenue Share, by Application (2021 & 2028)

Figure 22.        Europe Industrial: Virtual Pipeline Systems Market – Revenue and Forecast to 2028 (US$ Million)

Figure 23.        Europe Transportation: Virtual Pipeline Systems Market – Revenue and Forecast to 2028 (US$ Million)

Figure 24.        Europe Commercial & Residential: Virtual Pipeline Systems Market – Revenue and Forecast to 2028 (US$ Million)

Figure 25.        Europe: Virtual Pipeline Systems Market – Revenue and Forecast to 2028 (US$ Million)

Figure 26.        Europe: Virtual Pipeline Systems Market Revenue Share, by Key Country (2021 & 2028)

Figure 27.        Germany: Virtual Pipeline Systems Market – Revenue and Forecast to 2028 (US$ Million)

Figure 28.        France: Virtual Pipeline Systems Market – Revenue and Forecast to 2028 (US$ Million)

Figure 29.        Italy: Virtual Pipeline Systems Market – Revenue and Forecast to 2028 (US$ Million)

Figure 30.        UK: Virtual Pipeline Systems Market – Revenue and Forecast to 2028 (US$ Million)

Figure 31.        Russia: Virtual Pipeline Systems Market – Revenue and Forecast to 2028 (US$ Million)

Figure 32.        Rest of Europe: Virtual Pipeline Systems Market – Revenue and Forecast to 2028 (US$ Million)

  1.  Galileo Technologies S.A.                                           
  2. Bayotech, Inc.                                                                  
  3. Petroliam Nasional Berhad (PETRONAS)                               
  4. RAG Austria AG                                                               
  5. Quantum Fuel Systems LLC.                                       
  6. Chart Industries, Inc.                                                     
  7. SHIJIAZHUANG ENRIC GAS EQUIPMENT CO., LTD   
  8. Fiba Technologies Inc.                                                   
  9. Hexagon Agility                                                
  10. Composite Advanced Technologies, LLC.                              
  • Save and reduce time carrying out entry-level research by identifying the growth, size, leading players, and segments in the Europe virtual pipeline systems market.
  • Highlights key business priorities in order to assist companies to realign their business strategies.
  • The key findings and recommendations highlight crucial progressive industry trends in Europe virtual pipeline systems market, thereby allowing players across the value chain to develop effective long-term strategies.
  • Develop/modify business expansion plans by using substantial growth offering developed and emerging markets.
  • Scrutinize in-depth Europe market trends and outlook coupled with the factors driving the market, as well as those hindering it.
  • Enhance the decision-making process by understanding the strategies that underpin security interest with respect to client products, segmentation, pricing and distribution.
Report Code
Full Name
Country Name
Email Id
Phone Number
Job Title
Company
Requirement

Note : Your data will never be shared with third parties, however, we may send you information from time to time about our products that may be of interest to you. By submitting your details, you agree to be contacted by us. You may contact us at any time to opt-out.


Purchase Options
Single User License
$3000
$2400
Site License
$4000
$3200
Enterprise License
$5000
$4000