Middle East & Africa Virtual Pipeline Systems Market Forecast to 2028 – COVID-19 Impact and Regional Analysis – by Type (Standard Trailer and Towable Trailer), Gas (CNG, Hydrogen, and Others), Pressure Rating (Less than 3000 Psi, 3001 Psi to 5000 Psi, and More than 5001 Psi), and Application (Industrial, Transportation, and Commercial & Residential)

BMIRE00027717 | Pages: 98 | Energy and Power | Dec 2022 | Type: Regional | Status: Published

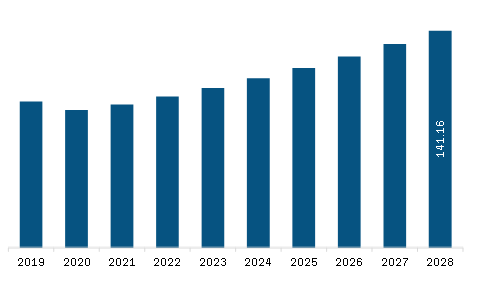
The virtual pipeline systems market in Middle East & Africa is expected to grow from US$ 98.20 million in 2022 to US$ 141.16 million by 2028. It is estimated to grow at a CAGR of 6.2% from 2022 to 2028.


Growing Investment in VPS Technologies


The advancement in technology is reducing the oil and gas industry's environmental impact substantially, from increased efficiency to reduced safety risk and travel. Oil and gas firms are paying attention to new emerging technologies because it can help them save energy, avoid oil spills and other catastrophes, and emit less carbon. Hence, such trends towards safety and flexibility towards gas transportation is anticipated to gain transaction over the forecast period.


Market Overview


The virtual pipeline system market in the MEA is segmented into South Africa, Saudi Arabia, the UAE, and the Rest of MEA. Gulf countries are economically developed unlike African nations, which have not yet achieved economic equilibrium. Factors such as increasing per capita income, improving economic conditions, and government spending infrastructure development are likely to contribute to the virtual pipeline system market in the MEA. A rise in natural gas projects, advancements and innovations in flexible pipe technology, and the discovery of new oil resources, particularly in remote areas, are particularly benefitting the MEA virtual pipeline system market. Saudi Arabia has the fifth-largest shale gas reservoir in the world, which provides the country with a scope to develop unconventional reserves, like North America. The demand for virtual pipeline systems in gathering and treatment stations is anticipated to increase with the rise in the exploration of unconventional reserves. Saudi Aramco intends to focus on unconventional gas reserves in North Arabia (South Ghawar) and the Jafurah Basin (East of Ghawar) to be able to generate 0.65 bcm of natural gas per day by 2028. The resultant rise in the extraction of unconventional deposits is likely to boost the adoption of virtual pipeline systems in gathering and treatment facilities.


Middle East & Africa Virtual Pipeline Systems Market Revenue and Forecast to 2028 (US$ Million)

Middle East & Africa Virtual Pipeline Systems Market Revenue and Forecast to 2028 (US$ Million)

Get more information on this report :

Middle East & Africa Virtual Pipeline Systems Market Segmentation


The Middle East & Africa virtual pipeline systems market is segmented into type, gas, pressure rating, application, and country. 


Based on type, the market is segmented into standard trailer and towable trailer. The standard trailer segment registered a larger market share in 2022.


Based on gas, the market is segmented into CNG, hydrogen, and others. The CNG segment held the largest market share in 2022.


Based on pressure rating, the market is segmented into less than 3000 Psi, 3001 Psi to 5000 Psi, and more than 5001 Psi. The 3001 Psi to 5000 Psi segment held the largest market share in 2022.


Based on application, the market is segmented into industrial, transportation, and commercial & residential. The transportation segment held the largest market share in 2022.


Based on country, the market is segmented into South Africa, the UAE, Saudi Arabia, and the Rest of Middle East & Africa. The UAE dominated the market share in 2022.


Petroliam Nasional Berhad (PETRONAS); RAG Austria AG; Quantum Fuel Systems LLC.; Chart Industries, Inc.; and Fiba Technologies Inc. are the leading companies operating in the virtual pipeline systems market in the region.

1.           Introduction

1.1         Study Scope

1.2         The Insight Partners Research Report Guidance

1.3         Market Segmentation

2.           Key Takeaways

3.        Research Methodology

3.1         Coverage

3.2         Secondary Research

3.3         Primary Research

4.           Middle East & Africa Virtual Pipeline Systems Market Landscape

4.1         Market Overview

4.2         PEST Analysis

4.2.1        Middle East and Africa

4.3         Ecosystem Analysis

4.4         Expert Opinions

5.           Middle East & Africa Virtual Pipeline Systems Market – Key Market Dynamics

5.1         Market Drivers

5.1.1        Increasing Energy Demands Creating Need for Virtual Pipeline Systems

5.1.2        Rising Shale Gas Extraction Driving Demand for Virtual Pipeline System

5.2         Market Restraints

5.2.1        Significant Dominance of Conventional Pipeline Infrastructure

5.3         Market Opportunities

5.3.1        Growing Inclination towards Consumption of Natural Gas

5.4         Future Trends

5.4.1        Growing Investment in VPS Technologies

5.5         Impact Analysis of Drivers And Restraints

6.           Virtual Pipeline Systems – Middle East & Africa Market Analysis

6.1         Middle East & Africa Virtual Pipeline Systems Market Overview

6.2         Middle East & Africa Virtual Pipeline Systems Market Revenue Forecast and Analysis

7.           Middle East & Africa Virtual Pipeline Systems Market – By Type

7.1         Overview

7.2         Middle East & Africa Virtual Pipeline Systems Market, By Type (2021 and 2028)

7.3         Standard Trailer

7.3.1        Overview

7.3.2        Middle East & Africa Standard Trailer: Virtual Pipeline Systems Market – Revenue and Forecast to 2028 (US$ Million)

7.4         Towable Trailer

7.4.1        Overview

7.4.2        Middle East & Africa Towable Trailer: Virtual Pipeline Systems Market – Revenue and Forecast to 2028 (US$ Million)

8.           Middle East & Africa Virtual Pipeline Systems Market – By Gas

8.1         Overview

8.2         Middle East & Africa Virtual Pipeline Systems Market, By Gas (2021 and 2028)

8.3         CNG

8.3.1        Overview

8.3.2        Middle East & Africa CNG: Virtual Pipeline Systems Market – Revenue and Forecast to 2028 (US$ Million)

8.4         Hydrogen

8.4.1        Overview

8.4.2        Middle East & Africa Hydrogen: Virtual Pipeline Systems Market – Revenue and Forecast to 2028 (US$ Million)

8.5         Others

8.5.1        Overview

8.5.2        Middle East & Africa Others: Virtual Pipeline Systems Market – Revenue and Forecast to 2028 (US$ Million)

9.           Middle East & Africa Virtual pipeline systems Market – By Pressure Rating

9.1         Overview

9.2         Middle East & Africa Virtual Pipeline Systems Market, By Pressure Rating (2021 and 2028)

9.3         Less than 3000 Psi

9.3.1        Overview

9.3.2        Middle East & Africa Less than 3000 Psi: Virtual Pipeline Systems Market – Revenue and Forecast to 2028 (US$ Million)

9.41 Psi to 5000 Psi

9.4.1        Overview

9.4.2        Middle East & Africa 3001 Psi to 5000 Psi: Virtual Pipeline Systems Market – Revenue and Forecast to 2028 (US$ Million)

9.5         More than 5001 Psi

9.5.1        Overview

9.5.2        Middle East & Africa More than 5001 Psi: Virtual Pipeline Systems Market – Revenue and Forecast to 2028 (US$ Million)

10.        Middle East & Africa Virtual Pipeline Systems Market – By Application

10.1      Overview

10.2      Middle East & Africa Virtual Pipeline Systems Market, By Application (2021 and 2028)

10.3      Industrial

10.3.1     Overview

10.3.2     Middle East & Africa Industrial: Virtual Pipeline Systems Market – Revenue and Forecast to 2028 (US$ Million)

10.4      Transportation

10.4.1     Overview

10.4.2     Middle East & Africa Transportation: Virtual Pipeline Systems Market – Revenue and Forecast to 2028 (US$ Million)

10.5      Commercial & Residential

10.5.1     Overview

10.5.2     Middle East & Africa Commercial & Residential: Virtual Pipeline Systems Market – Revenue and Forecast to 2028 (US$ Million)

11.        Middle East & Africa Virtual Pipeline Systems Market – Country Analysis

11.1      MEA: Virtual Pipeline Systems Market

11.1.1     MEA: Virtual Pipeline Systems Market – Revenue and Forecast to 2028 (US$ Million)

11.1.2     MEA: Virtual Pipeline Systems Market, By Key Country

11.1.2.1       South Africa: Virtual Pipeline Systems Market – Revenue and Forecast to 2028 (US$ Million)

11.1.2.1.1       South Africa: Virtual Pipeline Systems Market, By Type

11.1.2.1.2       South Africa: Virtual Pipeline Systems Market, By Gas

11.1.2.1.3       South Africa: Virtual Pipeline Systems Market, By Application

11.1.2.2       Saudi Arabia: Virtual Pipeline Systems Market – Revenue and Forecast to 2028 (US$ Million)

11.1.2.2.1       Saudi Arabia: Virtual Pipeline Systems Market, By Type

11.1.2.2.2       Saudi Arabia: Virtual Pipeline Systems Market, By Gas

11.1.2.2.3       Saudi Arabia: Virtual Pipeline Systems Market, By Pressure Rating

11.1.2.2.4       Saudi Arabia: Virtual Pipeline Systems Market, By Application

11.1.2.3       UAE: Virtual Pipeline Systems Market – Revenue and Forecast to 2028 (US$ Million)

11.1.2.3.1       UAE: Virtual Pipeline Systems Market, By Type

11.1.2.3.2       UAE: Virtual Pipeline Systems Market, By Gas

11.1.2.3.3       UAE: Virtual Pipeline Systems Market, By Pressure Rating

11.1.2.3.4       UAE: Virtual Pipeline Systems Market, By Application

11.1.2.4       Rest of MEA: Virtual Pipeline Systems Market – Revenue and Forecast to 2028 (US$ Million)

11.1.2.4.1       Rest of MEA: Virtual Pipeline Systems Market, By Type

11.1.2.4.2       Rest of MEA: Virtual Pipeline Systems Market, By Gas

11.1.2.4.3       Rest of MEA: Virtual Pipeline Systems Market, By Pressure Rating

11.1.2.4.4       Rest of MEA: Virtual Pipeline Systems Market, By Application

12.        Industry Landscape

12.1      Overview

12.2      New Product Launch

12.3      Merger and Acquisition

13.        Company Profiles

13.1      Petroliam Nasional Berhad (PETRONAS)

13.1.1     Key Facts

13.1.2     Business Description

13.1.3     Products and Services

13.1.4     Financial Overview

13.1.5     SWOT Analysis

13.1.6     Key Developments

13.2      RAG Austria AG

13.2.1     Key Facts

13.2.2     Business Description

13.2.3     Products and Services

13.2.4     Financial Overview

13.2.5     SWOT Analysis

13.2.6     Key Developments

13.3      Quantum Fuel Systems LLC.

13.3.1     Key Facts

13.3.2     Business Description

13.3.3     Products and Services

13.3.4     Financial Overview

13.3.5     SWOT Analysis

13.3.6     Key Developments

13.4      Chart Industries, Inc.

13.4.1     Key Facts

13.4.2     Business Description

13.4.3     Products and Services

13.4.4     Financial Overview

13.4.5     SWOT Analysis

13.4.6     Key Developments

13.5      Fiba Technologies Inc

13.5.1     Key Facts

13.5.2     Business Description

13.5.3     Products and Services

13.5.4     Financial Overview

13.5.5     SWOT Analysis

13.5.6     Key Developments

14.        Appendix

14.1      About The Insight Partners

14.2      Word Index


LIST OF TABLES

Table 1.             Middle East & Africa Virtual Pipeline Systems Market Revenue and Forecast to 2028 (US$ Million)

Table 2.             MEA: Virtual Pipeline Systems Market, By Type – Revenue and Forecast to 2028 (US$ Million)

Table 3.             MEA: Virtual Pipeline Systems Market, By Gas – Revenue and Forecast to 2028 (US$ Million)

Table 4.             MEA: Virtual Pipeline Systems Market, By Pressure Rating – Revenue and Forecast to 2028 (US$ Million)

Table 5.             MEA: Virtual Pipeline Systems Market, By Application – Revenue and Forecast to 2028 (US$ Million)

Table 6.             MEA: Virtual Pipeline Systems Market, By Country – Revenue and Forecast to 2028 (US$ Million)

Table 7.             South Africa: Virtual Pipeline Systems Market, By Type – Revenue and Forecast to 2028 (US$ Million)

Table 8.             South Africa: Virtual Pipeline Systems Market, By Gas – Revenue and Forecast to 2028 (US$ Million)

Table 9.             South Africa: Virtual Pipeline Systems Market, By Pressure Rating – Revenue and Forecast to 2028 (US$ Million)

Table 10.          South Africa: Virtual Pipeline Systems Market, By Application – Revenue and Forecast to 2028 (US$ Million)

Table 11.          Saudi Arabia: Virtual Pipeline Systems Market, By Type – Revenue and Forecast to 2028 (US$ Million)

Table 12.          Saudi Arabia: Virtual Pipeline Systems Market, By Gas – Revenue and Forecast to 2028 (US$ Million)

Table 13.          Saudi Arabia: Virtual Pipeline Systems Market, By Pressure Rating – Revenue and Forecast to 2028 (US$ Million)

Table 14.          Saudi Arabia: Virtual Pipeline Systems Market, By Application – Revenue and Forecast to 2028 (US$ Million)

Table 15.          UAE: Virtual Pipeline Systems Market, By Type – Revenue and Forecast to 2028 (US$ Million)

Table 16.          UAE: Virtual Pipeline Systems Market, By Gas – Revenue and Forecast to 2028 (US$ Million)

Table 17.          UAE: Virtual Pipeline Systems Market, By Pressure Rating – Revenue and Forecast to 2028 (US$ Million)

Table 18.          UAE: Virtual Pipeline Systems Market, By Application – Revenue and Forecast to 2028 (US$ Million)

Table 19.          Rest of MEA: Virtual Pipeline Systems Market, By Type – Revenue and Forecast to 2028 (US$ Million)

Table 20.          Rest of MEA: Virtual Pipeline Systems Market, By Gas – Revenue and Forecast to 2028 (US$ Million)

Table 21.          Rest of MEA: Virtual Pipeline Systems Market, By Pressure Rating – Revenue and Forecast to 2028 (US$ Million)

Table 22.          Rest of MEA: Virtual Pipeline Systems Market, By Application – Revenue and Forecast to 2028 (US$ Million)

Table 23.          List of Abbreviation


LIST OF FIGURES

Figure 1.           Middle East & Africa Virtual Pipeline Systems Market Segmentation

Figure 2.           Middle East & Africa Virtual Pipeline Systems Market Segmentation – By Country

Figure 3.           Middle East & Africa Virtual Pipeline Systems Market Overview

Figure 4.           Middle East & Africa Virtual Pipeline Systems Market, By Type

Figure 5.           Middle East & Africa Virtual Pipeline Systems Market, By Country

Figure 6.           Middle East and Africa – PEST Analysis

Figure 7.           Middle East & Africa Virtual Pipeline Systems Market- Ecosystem Analysis

Figure 8.           Middle East & Africa Virtual Pipeline Systems Market Impact Analysis of Drivers and Restraints

Figure 9.           Middle East & Africa Virtual Pipeline Systems Market Revenue Forecast and Analysis (US$ Million)

Figure 10.        MEA: Virtual Pipeline Systems Market Revenue Share, by Type (2021 & 2028)

Figure 11.        Middle East & Africa Standard Trailer: Virtual Pipeline Systems Market – Revenue and Forecast to 2028 (US$ Million)

Figure 12.        Middle East & Africa Towable Trailer: Virtual Pipeline Systems Market – Revenue and Forecast to 2028 (US$ Million)

Figure 13.        MEA: Virtual Pipeline Systems Market Revenue Share, by Gas (2021 & 2028)

Figure 14.        Middle East & Africa CNG: Virtual Pipeline Systems Market – Revenue and Forecast to 2028 (US$ Million)

Figure 15.        Middle East & Africa Hydrogen: Virtual Pipeline Systems Market – Revenue and Forecast to 2028 (US$ Million)

Figure 16.        Middle East & Africa Others: Virtual Pipeline Systems Market – Revenue and Forecast to 2028 (US$ Million)

Figure 17.        MEA: Virtual Pipeline Systems Market Revenue Share, by Pressure Rating (2021 & 2028)

Figure 18.        Middle East & Africa Less than 3000 Psi: Virtual Pipeline Systems Market – Revenue and Forecast to 2028 (US$ Million)

Figure 19.        Middle East & Africa 3001 Psi to 5000 Psi: Virtual Pipeline Systems Market – Revenue and Forecast to 2028 (US$ Million)

Figure 20.        Middle East & Africa More than 5001 Psi: Virtual Pipeline Systems Market – Revenue and Forecast to 2028 (US$ Million)

Figure 21.        MEA: Virtual Pipeline Systems Market Revenue Share, by Application (2021 & 2028)

Figure 22.        Middle East & Africa Industrial: Virtual Pipeline Systems Market – Revenue and Forecast to 2028 (US$ Million)

Figure 23.        Middle East & Africa Transportation: Virtual Pipeline Systems Market – Revenue and Forecast to 2028 (US$ Million)

Figure 24.        Middle East & Africa Commercial & Residential: Virtual Pipeline Systems Market – Revenue and Forecast to 2028 (US$ Million)

Figure 25.        MEA: Virtual Pipeline Systems Market – Revenue and Forecast to 2028 (US$ Million)

Figure 26.        MEA: Virtual Pipeline Systems Market Revenue Share, by Key Country (2021 & 2028)

Figure 27.        South Africa: Virtual Pipeline Systems Market – Revenue and Forecast to 2028 (US$ Million)

Figure 28.        Saudi Arabia: Virtual Pipeline Systems Market – Revenue and Forecast to 2028 (US$ Million)

Figure 29.        UAE: Virtual Pipeline Systems Market – Revenue and Forecast to 2028 (US$ Million)

Figure 30.        Rest of MEA: Virtual Pipeline Systems Market – Revenue and Forecast to 2028 (US$ Million)

  1. Petroliam Nasional Berhad (PETRONAS)                               
  2. RAG Austria AG                                                               
  3. Quantum Fuel Systems LLC.                                       
  4. Chart Industries, Inc.       
  5. Fiba Technologies Inc.                                   
  • Save and reduce time carrying out entry-level research by identifying the growth, size, leading players, and segments in the Middle East & Africa virtual pipeline systems market.
  • Highlights key business priorities in order to assist companies to realign their business strategies.
  • The key findings and recommendations highlight crucial progressive industry trends in Middle East & Africa virtual pipeline systems market, thereby allowing players across the value chain to develop effective long-term strategies.
  • Develop/modify business expansion plans by using substantial growth offering developed and emerging markets.
  • Scrutinize in-depth Middle East & Africa market trends and outlook coupled with the factors driving the market, as well as those hindering it.
  • Enhance the decision-making process by understanding the strategies that underpin security interest with respect to client products, segmentation, pricing and distribution.
Report Code
Full Name
Country Name
Email Id
Phone Number
Job Title
Company
Requirement

Note : Your data will never be shared with third parties, however, we may send you information from time to time about our products that may be of interest to you. By submitting your details, you agree to be contacted by us. You may contact us at any time to opt-out.


Purchase Options
Single User License
$3000
$2400
Site License
$4000
$3200
Enterprise License
$5000
$4000