Asia Pacific Visualization & 3D Rendering Software Market
No. of Pages: 97 | Report Code: BMIRE00025286 | Category: Technology, Media and Telecommunications
No. of Pages: 97 | Report Code: BMIRE00025286 | Category: Technology, Media and Telecommunications
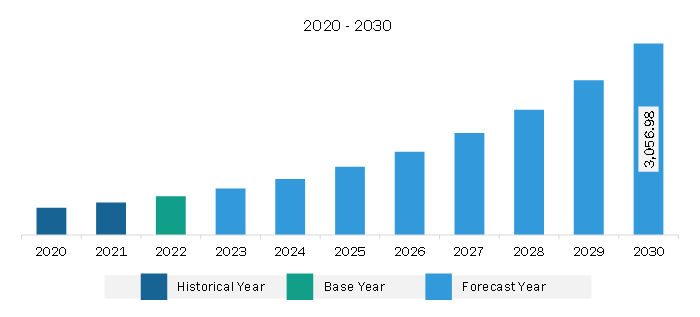
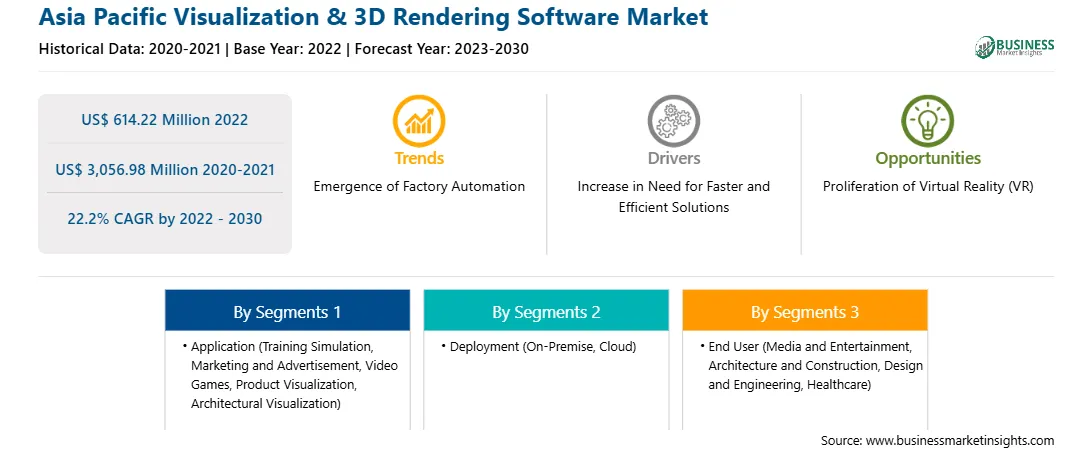
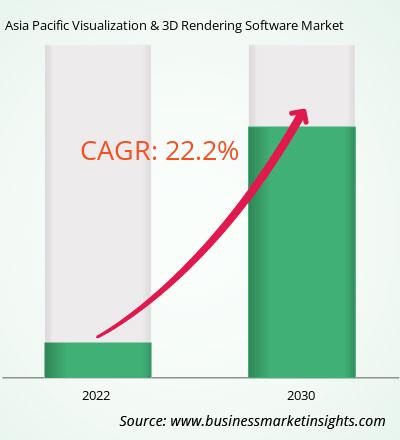
The Asia Pacific visualization & 3D rendering software market is expected to grow from US$ 614.22 million in 2022 to US$ 3,056.98 million by 2030. It is estimated to grow at a CAGR of 22.2% from 2022 to 2030.
Proliferation of Virtual Reality (VR) Fuels Asia Pacific Visualization & 3D Rendering Software Market
Virtual reality (VR) is gaining significant traction globally. The use of VR in the production and design of 3D animation has significantly increased the interactivity of 3D animation. VR technologies have developed considerably due to advancements in computer technology and societal requirements. The introduction of virtual reality might enhance the global 3D animation software industry. On the other hand, increased interest in viewing animated movies in virtual reality is expected to set the tone for the markets lucrative expansion. Furthermore, the adoption of VR technology is growing in various industries such as gaming, advertising, and home entertainment. Animators are using VR technology to produce similar effects. Players in the 3D animation market are seeing a rise in demand for 3D visualization due to increased work on more complicated animations and creating more engaging virtual environments. Both visual effects and virtual reality are primarily concerned with developing a new environment that may astonish spectators. For instance, in September 2022, Shanghai Disney Resort introduced an immersive virtual reality (VR) experience at its Disney town entertainment, dining, and shopping center. The increased popularity of VR in entertainment is expected to provide opportunities for visualization and 3D rendering software market growth.
Studios are increasing their tools for creating virtual production-a significant VR asset-using real-time graphics, motion capture, facial capture, and camera tracking techniques. VR is increasingly becoming important to most visual effects firms. For instance, Framestore Studios collaborated with HBO to launch "Ascend the Wall", a VR project based on the TV show "Game of Thrones." As virtual reality technology advances, more user-friendly interfaces are expected in the near future. Their applications are likely to become more common and be of higher quality. VR and other extended reality (XR) technologies are expected to undoubtedly make significant advances in animation during the next couple of years. Thus, the emergence of virtual reality technology opens new prospects in the 3D animation business.
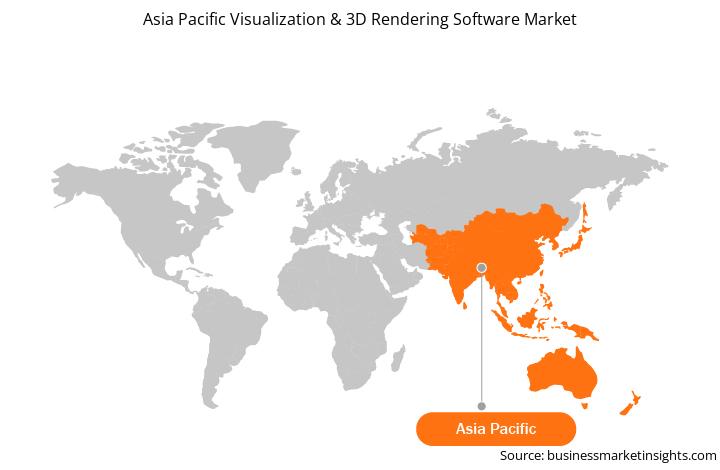
Asia Pacific Visualization & 3D Rendering Software Market Overview
APAC is a global manufacturing hub that comprises highly growing manufacturing sectors. Governments of APAC are making efforts to grab greater FDI opportunities. They offer tax rebates, subsidies, and funds to attract manufacturing companies to set up manufacturing facilities in their respective countries. Moreover, initiatives such as "Made in China 2025" and "Made in India" are propelling the growth of their respective manufacturing sectors. However, China, the largest manufacturing hub in the region, is witnessing a rise in labor costs. Amid its evolution into a high-skilled manufacturing hub, other developing countries-such as India, South Korea, Taiwan, and Vietnam-are attracting several businesses in a quest to relocate their low-to-medium-scaled manufacturing facilities to neighboring countries by offering lower labor costs. Improving infrastructure, rising domestic consumption, and lowering costs attract international manufacturing companies to establish their operating sites in APAC.
A large population has increased demand for residential and commercial construction in APAC. Further, regional governments are taking several initiatives to entice private investments in construction and infrastructure developments. For instance, the Malaysian Governments 2011-2020 Economic Transformation Program (ETP) was meant to attract a huge FDI in infrastructure and construction activities. The emerging economies in APAC are experiencing high growth in their GDPs every year, boosting the populations spending capacity. With the rising standard of living, there has been a considerable surge in infrastructural construction in the region in the last few decades. Moreover, the increased focus on modification, renovation, and aesthetic enhancement of homes facilitates the visualization and 3D rendering software market growth in APAC.
The growing adoption of virtual reality and similar trends is anticipated to boost the adoption of high-tech visualization and 3D rendering tools in APAC in the coming years. Owing to a large young population and the increasing affordability of smartphones, the mobile gaming industry has flourished in the region in the last several years. Meanwhile, the region also houses numerous content creators developing designing tools to produce graphically rich content. SMEs in the region are inclined toward using animated content in advertisement applications, which further propels the adoption of visualization and 3D rendering tools.
Asia Pacific Visualization & 3D Rendering Software Market Revenue and Forecast to 2030 (US$ Million)
Strategic insights for the Asia Pacific Visualization & 3D Rendering Software provides data-driven analysis of the industry landscape, including current trends, key players, and regional nuances. These insights offer actionable recommendations, enabling readers to differentiate themselves from competitors by identifying untapped segments or developing unique value propositions. Leveraging data analytics, these insights help industry players anticipate the market shifts, whether investors, manufacturers, or other stakeholders. A future-oriented perspective is essential, helping stakeholders anticipate market shifts and position themselves for long-term success in this dynamic region. Ultimately, effective strategic insights empower readers to make informed decisions that drive profitability and achieve their business objectives within the market.
| Report Attribute | Details |
|---|---|
| Market size in 2022 | US$ 614.22 Million |
| Market Size by 2030 | US$ 3,056.98 Million |
| Global CAGR (2022 - 2030) | 22.2% |
| Historical Data | 2020-2021 |
| Forecast period | 2023-2030 |
| Segments Covered |
By Application
|
| Regions and Countries Covered | Asia-Pacific
|
| Market leaders and key company profiles |
The geographic scope of the Asia Pacific Visualization & 3D Rendering Software refers to the specific areas in which a business operates and competes. Understanding local distinctions, such as diverse consumer preferences (e.g., demand for specific plug types or battery backup durations), varying economic conditions, and regulatory environments, is crucial for tailoring strategies to specific markets. Businesses can expand their reach by identifying underserved areas or adapting their offerings to meet local demands. A clear market focus allows for more effective resource allocation, targeted marketing campaigns, and better positioning against local competitors, ultimately driving growth in those targeted areas.
1. Autodesk Inc
2. Chaos Group
3. Christie Digital Systems
4. Dassault Systemes SE
5. NVIDIA Corp
6. Thea Render by Altair
The Asia Pacific Visualization & 3D Rendering Software Market is valued at US$ 614.22 Million in 2022, it is projected to reach US$ 3,056.98 Million by 2030.
As per our report Asia Pacific Visualization & 3D Rendering Software Market, the market size is valued at US$ 614.22 Million in 2022, projecting it to reach US$ 3,056.98 Million by 2030. This translates to a CAGR of approximately 22.2% during the forecast period.
The Asia Pacific Visualization & 3D Rendering Software Market report typically cover these key segments-
The historic period, base year, and forecast period can vary slightly depending on the specific market research report. However, for the Asia Pacific Visualization & 3D Rendering Software Market report:
The Asia Pacific Visualization & 3D Rendering Software Market is populated by several key players, each contributing to its growth and innovation. Some of the major players include:
The Asia Pacific Visualization & 3D Rendering Software Market report is valuable for diverse stakeholders, including:
Essentially, anyone involved in or considering involvement in the Asia Pacific Visualization & 3D Rendering Software Market value chain can benefit from the information contained in a comprehensive market report.
E 1803, Panchshil Towers, Vagholi, Haveli, Pune- 412207, Maharashtra, India
US:+16467917070
sales@businessmarketinsights.com


 Get Free Sample For Asia Pacific Visualization & 3D Rendering Software Market
