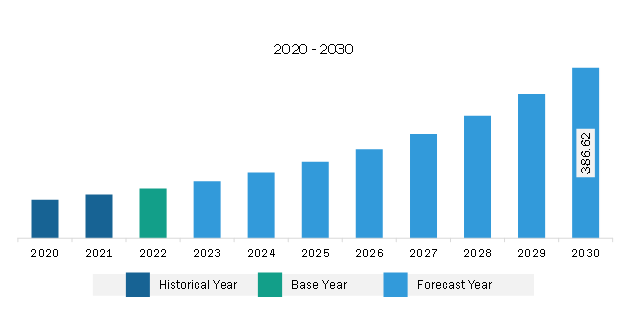
The South & Central America visualization & 3D rendering software market is expected to grow from US$ 112.53 million in 2022 to US$ 386.62 million by 2030. It is estimated to grow at a CAGR of 16.7% from 2022 to 2030.
Proliferation of Virtual Reality (VR) Fuels South & Central America Visualization & 3D Rendering Software Market
Virtual reality (VR) is gaining significant traction globally. The use of VR in the production and design of 3D animation has significantly increased the interactivity of 3D animation. VR technologies have developed considerably due to advancements in computer technology and societal requirements. The introduction of virtual reality might enhance the global 3D animation software industry. On the other hand, increased interest in viewing animated movies in virtual reality is expected to set the tone for the markets lucrative expansion. Furthermore, the adoption of VR technology is growing in various industries such as gaming, advertising, and home entertainment. Animators are using VR technology to produce similar effects. Players in the 3D animation market are seeing a rise in demand for 3D visualization due to increased work on more complicated animations and creating more engaging virtual environments. Both visual effects and virtual reality are primarily concerned with developing a new environment that may astonish spectators. The increased popularity of VR in entertainment is expected to provide opportunities for visualization and 3D rendering software market growth.
Studios are increasing their tools for creating virtual production-a significant VR asset-using real-time graphics, motion capture, facial capture, and camera tracking techniques. VR is increasingly becoming important to most visual effects firms. For instance, Framestore Studios collaborated with HBO to launch "Ascend the Wall", a VR project based on the TV show "Game of Thrones." As virtual reality technology advances, more user-friendly interfaces are expected in the near future. Their applications are likely to become more common and be of higher quality. VR and other extended reality (XR) technologies are expected to undoubtedly make significant advances in animation during the next couple of years. Thus, the emergence of virtual reality technology opens new prospects in the 3D animation business.
South & Central America Visualization & 3D Rendering Software Market Overview
The visualization and 3D rendering software market in SAM is segmented into Brazil, Argentina, and the Rest of South & Central America. Despite various economic challenges, favourable government initiatives continue to propel the growth of various regional economies. Brazil is the largest country in SAM and is considered one of the worlds largest economies in terms of nominal GDP and purchasing power parity. It is witnessing significant growth in the construction industry due to increased industrialization. In the last few decades, the construction sector in Brazil has been one of the most affected positively sectors by the deep economic recession faced by SAM.
Huge FDI opportunities presented by SAM countries owing to the availability of cheap labor and low entry barriers and interest rates bolstered the regions manufacturing sector. Argentina is concentrating on attracting greater FDI by taking several initiatives, such as easing import restrictions, signing international bilateral agreements, and lifting restrictions on foreign investments. Such initiatives further contribute to the development of the manufacturing sector in SAM. Moreover, the regions thriving architecture and healthcare sectors are contributing to the growth of the visualization and 3D rendering software market.
South & Central America Visualization & 3D Rendering Software Market Revenue and Forecast to 2030 (US$ Million)
South & Central America Visualization & 3D Rendering Software Market Segmentation
Based on application, the South & Central America visualization & 3D rendering software market is segmented into training simulation, marketing and advertisement, video games, product visualization, and architectural visualization. The architectural visualization segment held the largest share of the South & Central America visualization & 3D rendering software market in 2022.
Based on deployment, the South & Central America visualization & 3D rendering software market is segmented into on-premise and cloud. The on-premise segment held a larger share of the South & Central America visualization & 3D rendering software market in 2022.
Based on end user, the South & Central America visualization & 3D rendering software market is segmented into media and entertainment, architecture and construction, design and engineering, healthcare, and others. The architecture and construction segment held the largest share of the South & Central America visualization & 3D rendering software market in 2022.
Based on country, the South & Central America visualization & 3D rendering software market is segmented into Brazil, Argentina, and the Rest of South & Central America. Brazil dominated the South & Central America visualization & 3D rendering software market in 2022.
Autodesk Inc, Chaos Group, Christie Digital Systems, Dassault Systemes SE, and NVIDIA Corp are some of the leading companies operating in the South & Central America visualization & 3D rendering software market.
South & Central America Visualization & 3D Rendering Software Market Strategic Insights
Get more information on this report
South & Central America Visualization & 3D Rendering Software Market Segmentation Analysis
South & Central America Visualization & 3D Rendering Software Market Report Highlights
South & Central America Visualization & 3D Rendering Software Report Scope
Report Attribute
Details
Market size in 2022
US$ 112.53 Million
Market Size by 2030
US$ 386.62 Million
CAGR (2022 - 2030)
16.7%
Historical Data
2020-2021
Forecast period
2023-2030
Segments Covered
By Application
Training Simulation
Marketing and Advertisement
Video Games
Product Visualization
Architectural Visualization
By Deployment
On-Premise
Cloud
By End User
Media and Entertainment
Architecture and Construction
Design and Engineering
Healthcare
Regions and Countries Covered
South and Central America
Brazil, Argentina, Rest of South and Central America
Market leaders and key company profiles
Autodesk Inc
Chaos Group
Christie Digital Systems
Dassault Systemes SE
NVIDIA Corp
Get more information on this report
South & Central America Visualization & 3D Rendering Software Market Country and Regional Insights
Get more information on this report
Identical Market Reports with other Region/Countries
The List of Companies - South & Central America Visualization & 3D Rendering Software Market
1. Autodesk Inc 2. Chaos Group 3. Christie Digital Systems 4. Dassault Systemes SE 5. NVIDIA Corp
Frequently Asked Questions
How big is the South & Central America Visualization & 3D Rendering Software Market?
The South & Central America Visualization & 3D Rendering Software Market is valued at US$ 112.53 Million in 2022, it is projected to reach US$ 386.62 Million by 2030.
What is the CAGR for South & Central America Visualization & 3D Rendering Software Market by (2022 - 2030)?
As per our report South & Central America Visualization & 3D Rendering Software Market, the market size is valued at US$ 112.53 Million in 2022, projecting it to reach US$ 386.62 Million by 2030. This translates to a CAGR of approximately 16.7% during the forecast period.
What segments are covered in this report?
The South & Central America Visualization & 3D Rendering Software Market report typically cover these key segments-
Application (Training Simulation, Marketing and Advertisement, Video Games, Product Visualization, Architectural Visualization)
Deployment (On-Premise, Cloud)
End User (Media and Entertainment, Architecture and Construction, Design and Engineering, Healthcare)
What is the historic period, base year, and forecast period taken for South & Central America Visualization & 3D Rendering Software Market?
The historic period, base year, and forecast period can vary slightly depending on the specific market research report. However, for the South & Central America Visualization & 3D Rendering Software Market report:
Historic Period : 2020-2021
Base Year : 2022
Forecast Period : 2023-2030
Who are the major players in South & Central America Visualization & 3D Rendering Software Market?
The South & Central America Visualization & 3D Rendering Software Market is populated by several key players, each contributing to its growth and innovation. Some of the major players include:
Autodesk Inc
Chaos Group
Christie Digital Systems
Dassault Systemes SE
NVIDIA Corp
Who should buy this report?
The South & Central America Visualization & 3D Rendering Software Market report is valuable for diverse stakeholders, including:
Investors: Provides insights for investment decisions pertaining to market growth, companies, or industry insights. Helps assess market attractiveness and potential returns.
Industry Players: Offers competitive intelligence, market sizing, and trend analysis to inform strategic planning, product development, and sales strategies.
Suppliers and Manufacturers: Helps understand market demand for components, materials, and services related to concerned industry.
Researchers and Consultants: Provides data and analysis for academic research, consulting projects, and market studies.
Financial Institutions: Helps assess risks and opportunities associated with financing or investing in the concerned market.
Essentially, anyone involved in or considering involvement in the South & Central America Visualization & 3D Rendering Software Market value chain can benefit from the information contained in a comprehensive market report.


 Get Free Sample For South & Central America Visualization & 3D Rendering Software Market


