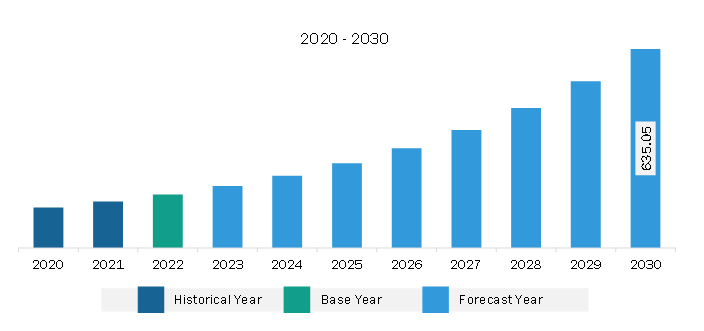
The Middle East & Africa visualization & 3D rendering software market is expected to grow from US$ 170.29 million in 2022 to US$ 635.05 million by 2030. It is estimated to grow at a CAGR of 17.9% from 2022 to 2030.
Emergence of Factory Automation Fuels Middle East & Africa Visualization & 3D Rendering Software Market
The concept of the connected factory has been developing over the past few years. In order to enable unprecedented levels of information monitoring, collecting, processing, and analysis, it is increasingly necessary to improve the Webs ability to connect devices, sensors, computers, and humans. Above mentioned devices provide more precision and can translate collected data into insights that, for example, help determine the amount of voltage used to produce a product or understand how temperature, pressure, and humidity impact the performance.
Industry 4.0 is expected to provide a long-term vision and future of manufacturing set-up during the forecast period. Traditional manufacturing is projected to transform due to the deployment of advanced technologies across manufacturing operations.
Middle East & Africa Visualization & 3D Rendering Software Market Overview
The visualization and 3D rendering software market in the MEA is segmented into South Africa, Saudi Arabia, the UAE, and the Rest of MEA. The infrastructural development and economic reinforcement in the MEA are driven by their frequent involvement in various global/international events. Huge investments in residential setups and government and private infrastructure projects are anticipated to boost the consumption of building materials across the Middle East. Commercial buildings, residential spaces, and offices are other constructions that have recently been found enhanced focus by the GCC and are one of the biggest end users in the Middle East. Several oil & gas refineries in the Middle Eastern countries contribute significantly to the regions overall GDP. However, the manufacturing sector of the Middle East is booming, and the governments in the region are taking several steps to encourage its growth further. For instance, Dubai has established one of the biggest industrial centers for attracting new manufacturers. According to the Department of Economic Development of the UAE, the manufacturing sector accounts for ~80% of the country's trade, excluding oil, and is gaining pace with time; the sector is projected to be the second-largest contributor to its economy. Major manufacturing industries in Dubai include rubber, plastics, F&B, printing & publishing, base metals, chemicals, metals, and electrical equipment & machinery. Several economies in the region are attracting large FDIs in their manufacturing sector. The Oman government supports manufacturing sector by introducing incentives and promoting FDIs. Also, the thriving media and entertainment industry, especially the OTT platforms, is fueling the adoption of visualization and 3D rendering tools.
Middle East & Africa Visualization & 3D Rendering Software Market Revenue and Forecast to 2030 (US$ Million)
Middle East & Africa Visualization & 3D Rendering Software Market Segmentation
Based on application, the Middle East & Africa visualization & 3D rendering software market is segmented into training simulation, marketing and advertisement, video games, product visualization, and architectural visualization. The architectural visualization segment held the largest share of the Middle East & Africa visualization & 3D rendering software market in 2022.
Based on deployment, the Middle East & Africa visualization & 3D rendering software market is segmented into on-premise and cloud. The on-premise segment held a larger share of the Middle East & Africa visualization & 3D rendering software market in 2022.
Based on end user, the Middle East & Africa visualization & 3D rendering software market is segmented into media and entertainment, architecture and construction, design and engineering, healthcare, and others. The architecture and construction segment held the largest share of the Middle East & Africa visualization & 3D rendering software market in 2022.
Based on country, the Middle East & Africa visualization & 3D rendering software market is segmented into Saudi Arabia, South Africa, the UAE, and the Rest of Middle East & Africa. Saudi Arabia dominated the Middle East & Africa visualization & 3D rendering software market in 2022.
Autodesk Inc, Chaos Group, Christie Digital Systems, Dassault Systemes SE, and NVIDIA Corp are some of the leading companies operating in the Middle East & Africa visualization & 3D rendering software market.
Middle East & Africa Visualization & 3D Rendering Software Market Strategic Insights
Get more information on this report
Middle East & Africa Visualization & 3D Rendering Software Market Segmentation Analysis
Middle East & Africa Visualization & 3D Rendering Software Market Report Highlights
Middle East & Africa Visualization & 3D Rendering Software Report Scope
Report Attribute
Details
Market size in 2022
US$ 170.29 Million
Market Size by 2030
US$ 635.05 Million
CAGR (2022 - 2030)
17.9%
Historical Data
2020-2021
Forecast period
2023-2030
Segments Covered
By Application
Training Simulation
Marketing and Advertisement
Video Games
Product Visualization
Architectural Visualization
By Deployment
On-Premise
Cloud
By End User
Media and Entertainment
Architecture and Construction
Design and Engineering
Healthcare
Regions and Countries Covered
Middle East and Africa
South Africa, Saudi Arabia, UAE, Rest of Middle East and Africa
Market leaders and key company profiles
Autodesk Inc
Chaos Group
Christie Digital Systems
Dassault Systemes SE
NVIDIA Corp
Get more information on this report
Middle East & Africa Visualization & 3D Rendering Software Market Country and Regional Insights
Get more information on this report
Identical Market Reports with other Region/Countries
The List of Companies - Middle East & Africa Visualization & 3D Rendering Software Market
1. Autodesk Inc 2. Chaos Group 3. Christie Digital Systems 4. Dassault Systemes SE 5. NVIDIA Corp
Frequently Asked Questions
How big is the Middle East & Africa Visualization & 3D Rendering Software Market?
The Middle East & Africa Visualization & 3D Rendering Software Market is valued at US$ 170.29 Million in 2022, it is projected to reach US$ 635.05 Million by 2030.
What is the CAGR for Middle East & Africa Visualization & 3D Rendering Software Market by (2022 - 2030)?
As per our report Middle East & Africa Visualization & 3D Rendering Software Market, the market size is valued at US$ 170.29 Million in 2022, projecting it to reach US$ 635.05 Million by 2030. This translates to a CAGR of approximately 17.9% during the forecast period.
What segments are covered in this report?
The Middle East & Africa Visualization & 3D Rendering Software Market report typically cover these key segments-
Application (Training Simulation, Marketing and Advertisement, Video Games, Product Visualization, Architectural Visualization)
Deployment (On-Premise, Cloud)
End User (Media and Entertainment, Architecture and Construction, Design and Engineering, Healthcare)
What is the historic period, base year, and forecast period taken for Middle East & Africa Visualization & 3D Rendering Software Market?
The historic period, base year, and forecast period can vary slightly depending on the specific market research report. However, for the Middle East & Africa Visualization & 3D Rendering Software Market report:
Historic Period : 2020-2021
Base Year : 2022
Forecast Period : 2023-2030
Who are the major players in Middle East & Africa Visualization & 3D Rendering Software Market?
The Middle East & Africa Visualization & 3D Rendering Software Market is populated by several key players, each contributing to its growth and innovation. Some of the major players include:
Autodesk Inc
Chaos Group
Christie Digital Systems
Dassault Systemes SE
NVIDIA Corp
Who should buy this report?
The Middle East & Africa Visualization & 3D Rendering Software Market report is valuable for diverse stakeholders, including:
Investors: Provides insights for investment decisions pertaining to market growth, companies, or industry insights. Helps assess market attractiveness and potential returns.
Industry Players: Offers competitive intelligence, market sizing, and trend analysis to inform strategic planning, product development, and sales strategies.
Suppliers and Manufacturers: Helps understand market demand for components, materials, and services related to concerned industry.
Researchers and Consultants: Provides data and analysis for academic research, consulting projects, and market studies.
Financial Institutions: Helps assess risks and opportunities associated with financing or investing in the concerned market.
Essentially, anyone involved in or considering involvement in the Middle East & Africa Visualization & 3D Rendering Software Market value chain can benefit from the information contained in a comprehensive market report.


 Get Free Sample For Middle East & Africa Visualization & 3D Rendering Software Market


