Asia Pacific Monoclonal Antibodies Market Forecast to 2028 - COVID-19 Impact and Regional Analysis By Source (Human, Humanized, Chimeric, and Murine), Production Method (In-Vitro, and In-Vivo), Indication (Cancer, Autoimmune Diseases, Infectious Diseases, Inflammatory Diseases, Microbial Diseases, and Others), Application (Therapeutic Applications, Diagnostic Applications, and Research Applications), End-User (Hospitals, Research Institutes, and Others)

TIPRE00028619 | Pages: 168 | Pharmaceuticals | Apr 2022 | Type: Regional | Status: Published

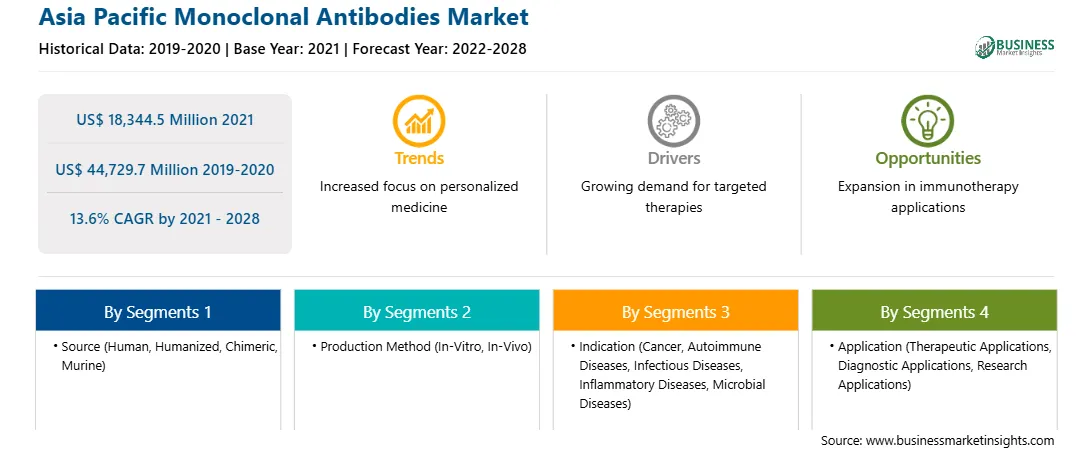
The Asia Pacific monoclonal antibodies market is expected to reach US$ 44,729.7 million by 2028 from US$ 18,344.5 million in 2021. The market is estimated to grow at a CAGR of 13.6% from 2021–2028.

Advancements in manufacturing technologies with packaging and delivery can lower mAB production costs and increase efficiency. For example, WHO policy guidelines play an important role in adopting new technologies and their integration in financing and procurement platforms. Therefore, novel technologies are expected to lower mAB development and manufacturing costs during the forecast period. For instance, the IAVI report states that many researchers are applying cost-effective technologies for optimizing HIV-specific bnmABs for increasing potency, thereby lowering the cost of the overall product. Additionally, recent technological advancements offer lucrative opportunities to quickly isolate, develop and produce therapeutic or preventative mABs as a complementary approach to vaccine development as part of preparing for or responding to current and future pandemic outbreaks. For example, incorporating technological advancements in the process of identifying, optimizing, and producing results in delivering more potent, lower-cost monoclonal antibody products. Together, such strategic actions are expected to make it possible to address the growing inequity to these products, saving or improving millions of lives in the process in the near future. Therefore, with the influx of advanced technology for the development of mABs, the mAB market will grow faster in the coming years. For example, as per the statistics released by Firestone, approx. 43% of mAB sales were intended to treat immune system diseases, while 35% were used for tumor therapy in 2015. The sales of mABs accounted for over half of the total sales of all biopharmaceutical products.


The supply chain disruptions, along with the massive demand for efficient treatments for the therapy of COVID-19, have put the healthcare research industry in a crucial situation in the Asia Pacific region. Prohibitive measures have been taken to control the spread of this pandemic. COVID-19 pandemic has broadly affected that economies in the Asia Pacific region. Countries such as India, China, Japan, South Korea were adversely affected by the pandemic. The socio-economics were severely affected, rising in negative inflation, GDPs, and a surge in unemployment in the region. The pandemic has affected three main aspects of the global economy: production, supply chain, and firms and financial markets. Japan, China, South Korea, India, and Australia are the most affected countries due to the increasing number of COVID-19 cases and the associated deaths. Manufacturers and suppliers of pharmaceuticals shift their focus from regular OTC and prescription drugs to developing and supplying COVID-19 essentials and medical devices used for respiratory issues. This scenario negatively impacts the monoclonal antibody. This pandemic is affecting the business operation of the various key players operating in this region.


With the new features and technologies, vendors can attract new customers and expand their footprints in emerging markets. This factor is likely to drive the monoclonal antibodies market. The Asia Pacific monoclonal antibodies market is expected to grow at a good CAGR during the forecast period.


Asia Pacific Monoclonal Antibodies Market Revenue and Forecast to 2028 (US$ Million)

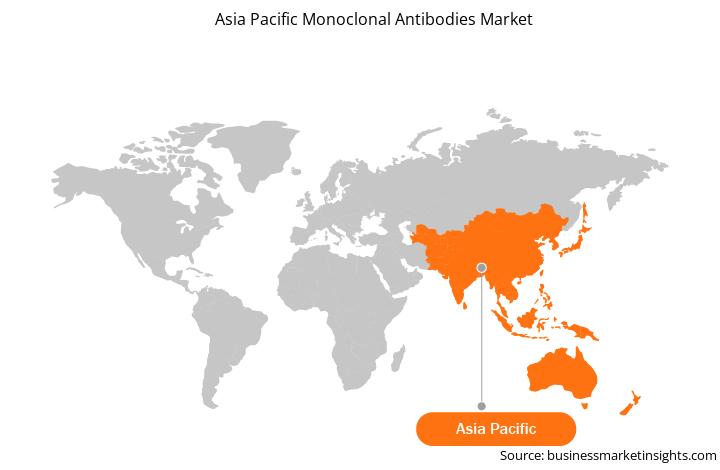
Asia Pacific Monoclonal Antibodies Market Revenue and Forecast to 2028 (US$ Million)

Get more information on this report :


Asia Pacific Monoclonal Antibodies Market Segmentation          

By Source

  • Human
  • Humanized
  • Chimeric
  • Murine 

By Production Method

  • In-Vitro
  • In-Vivo

By Indication

  • Cancer
  • Autoimmune Diseases
  • Infectious Diseases
  • Inflammatory Diseases
  • Microbial Diseases
  • Others

By Application

  • Therapeutic Applications
  • Diagnostic Applications
  • Research Applications

By End-User

  • Hospitals
  • Research Institutes
  • Others

By Country

  • Asia Pacific
  • China
  • Japan
  • India
  • South Korea
  • Australia
  • Rest of Asia Pacific

Companies Mentioned

  • Novartis AG
  • Pfizer Inc.
  • GlaxoSmithKline plc.
  • Amgen Inc
  • DAIICHI SANKYO COMPANY, LIMITED
  • F. Hoffmann-La Roche Ltd.
  • AstraZeneca
  • Eli Lilly and Company
  • Bayer AG
  • Bristol-Myers Squibb Company

1.           Introduction

1.1         Scope of the Study

1.2         The Insight Partners Research Report Guidance

1.3         Market Segmentation

1.3.1        Asia Pacific Monoclonal Antibodies (mAbs) Market – By Source

1.3.2        Asia Pacific Monoclonal Antibodies (mAbs) Market – By Production Method

1.3.3        Asia Pacific Monoclonal Antibodies (mAbs) Market – By Indication

1.3.4        Asia Pacific Monoclonal Antibodies (mAbs) Market – By Application

1.3.5        Asia Pacific Monoclonal Antibodies (mAbs) Market – By End-User

1.3.6        Asia Pacific Monoclonal Antibodies (mAbs) Market – By Geography

2.           Key Takeaways

3.        Research Methodology

3.1         Coverage

3.2         Secondary Research

3.3         Primary Research

4.           Monoclonal Antibodies (mAbs) Market – Market Landscape

4.1         Overview

4.2         PEST Analysis

4.2.1        Asia Pacific PEST Analysis

4.3         Experts Opinion

5.           Monoclonal Antibodies (mAbs) Market – Key Market Dynamics

5.1         Market Drivers

5.1.1        Rising Prevalence of Cancer and Other Chronic Diseases

5.1.2        mABs Uptake Proves to be Effective During Pandemic Outbreak

5.2         Market Restraints

5.2.1        Low Awareness, Accessibility, and High Cost

5.3         Market Opportunities

5.3.1        Cost-effective Advanced Technology for Developing mABs Presents Billion-Dollar Opportunity

5.4         Future Trends

5.4.1        Strategic Research Collaborations

5.5         Impact Analysis

6.           Monoclonal Antibodies (mAbs) Market– Asia Pacific Analysis

6.1         Asia Pacific Monoclonal Antibodies (mAbs) Market, By Geography - Forecast and Analysis

7.           Asia Pacific Monoclonal Antibodies (mAbs) Market Revenue and Forecasts To 2028– by Source

7.1         Overview

7.2         Asia Pacific Monoclonal Antibodies (mAbs) Market, By Source, 2020 & 2028 (%)

7.3         Murine

7.3.1        Overview

7.3.2        Murine: Monoclonal Antibodies (mAbs) Market Revenue and Forecasts to 2028 (US$ Million)

7.4         Chimeric

7.4.1        Overview

7.4.2        Chimeric: Monoclonal Antibodies (mAbs) Market Revenue and Forecasts to 2028 (US$ Million)

7.5         Humanized

7.5.1        Overview

7.5.2        Humanized: Monoclonal Antibodies (mAbs) Market Revenue and Forecasts to 2028 (US$ Million)

7.6         Human

7.6.1        Overview

7.6.2        Human: Monoclonal Antibodies (mAbs) Market Revenue and Forecasts to 2028 (US$ Million)

8.           Monoclonal Antibodies (mAbs) Market Revenue and Forecasts To 2028 – Production Method

8.1         Overview

8.2         Asia Pacific Monoclonal Antibodies (mAbs) Market Share by Production Method Segment - 2020 & 2028 (%)

8.3         In-Vivo

8.3.1        Overview

8.3.2        In-Vivo: Monoclonal Antibodies (mAbs) Market Revenue and Forecast to 2028 (US$ Million)

8.4         In-Vitro

8.4.1        Overview

8.4.2        In-Vitro: Monoclonal Antibodies (mAbs) Market Revenue and Forecast to 2028 (US$ Million)

9.           Monoclonal Antibodies (mAbs) Market Revenue and Forecasts To 2028 – Indication

9.1         Overview

9.2         Asia Pacific Monoclonal Antibodies (mAbs) Market Share by Indication Segment - 2020 & 2028 (%)

9.3         Cancer

9.3.1        Overview

9.3.2        Cancer: Monoclonal Antibodies (mAbs) Market Revenue and Forecast to 2028 (US$ Million)

9.4         Autoimmune Diseases

9.4.1        Overview

9.4.2        Autoimmune Diseases: Monoclonal Antibodies (mAbs) Market Revenue and Forecast to 2028 (US$ Million)

9.5         Inflammatory Diseases

9.5.1        Overview

9.5.2        Inflammatory Diseases: Monoclonal Antibodies (mAbs) Market Revenue and Forecast to 2028 (US$ Million)

9.6         Infectious Diseases

9.6.1        Overview

9.6.2        Infectious Diseases: Monoclonal Antibodies (mAbs) Market Revenue and Forecast to 2028 (US$ Million)

9.7         Microbial Diseases

9.7.1        Overview

9.7.2        Microbial Diseases: Monoclonal Antibodies (mAbs) Market Revenue and Forecast to 2028 (US$ Million)

9.8         Others

9.8.1        Overview

9.8.2        Others: Monoclonal Antibodies (mAbs) Market Revenue and Forecast to 2028 (US$ Million)

10.        Monoclonal Antibodies (mAbs) Market Revenue and Forecasts To 2028 – Application

10.1      Overview

10.2      Asia Pacific Monoclonal Antibodies (mAbs) Market Share by Application Segment - 2020 & 2028 (%)

10.3      Diagnostic Applications

10.3.1     Overview

10.3.2     Diagnostic Applications: Monoclonal Antibodies (mAbs) Market Revenue and Forecast to 2028 (US$ Million)

10.4      Therapeutic Applications

10.4.1     Overview

10.4.2     Therapeutic Applications: Monoclonal Antibodies (mAbs) Market Revenue and Forecast to 2028 (US$ Million)

10.5      Research Applications

10.5.1     Overview

10.5.2     Research Applications: Monoclonal Antibodies (mAbs) Market Revenue and Forecast to 2028 (US$ Million)

11.        Monoclonal Antibodies (mAbs) Market Revenue and Forecasts To 2028 – End-User

11.1      Overview

11.2      Asia Pacific Monoclonal Antibodies (mAbs) Market Share by End-User Segment - 2020 & 2028 (%)

11.3      Hospitals

11.3.1     Overview

11.3.2     Hospitals: Monoclonal Antibodies (mAbs) Market Revenue and Forecast to 2028 (US$ Million)

11.4      Research Institutes

11.4.1     Overview

11.4.2     Research Institutes: Monoclonal Antibodies (mAbs) Market Revenue and Forecast to 2028 (US$ Million)

11.5      Others

11.5.1     Overview

11.5.2     Others: Monoclonal Antibodies (mAbs) Market Revenue and Forecast to 2028 (US$ Million)

12.        Monoclonal Antibodies (mAbs) Market Revenue and Forecasts to 2028 – Geographical Analysis

12.1      Asia Pacific Monoclonal Antibodies (mAbs) Market Revenue and Forecasts To 2028

12.1.1     Overview

12.1.2     Asia Pacific: Monoclonal Antibodies (mAbs) Market - Revenue and Forecast to 2028 (USD Million)

12.1.3     Asia Pacific: Monoclonal Antibodies (mAbs) Market, by Source, 2019–2028 (USD Million)

12.1.4     Asia Pacific: Monoclonal Antibodies (mAbs) Market, by Production Method, 2019–2028 (USD Million)

12.1.5     Asia Pacific: Monoclonal Antibodies (mAbs) Market, by Indication, 2019–2028 (USD Million)

12.1.6     Asia Pacific: Monoclonal Antibodies (mAbs) Market, by Application, 2019–2028 (USD Million)

12.1.7     Asia Pacific: Monoclonal Antibodies (mAbs) Market, By End User, 2019–2028 (USD Million)

12.1.8     Asia Pacific: Monoclonal Antibodies (mAbs) Market, by Country, 2021 & 2028 (%)

12.1.8.1       China: Monoclonal Antibodies (mAbs) Market – Revenue and Forecast to 2028 (USD Million)

12.1.8.1.1       China: Monoclonal Antibodies (mAbs) Market – Revenue and Forecast to 2028 (USD Million)

12.1.8.1.2       China: Monoclonal Antibodies (mAbs) Market, by Source, 2019–2028 (USD Million)

12.1.8.1.3       China: Monoclonal Antibodies (mAbs) Market, by Production Method, 2019–2028 (USD Million)

12.1.8.1.4       China: Monoclonal Antibodies (mAbs) Market, by Indication, 2019–2028 (USD Million)

12.1.8.1.5       China: Monoclonal Antibodies (mAbs) Market, by Application, 2019–2028 (USD Million)

12.1.8.1.6       China: Monoclonal Antibodies (mAbs) Market, by Product, 2019–2028 (USD Million)

12.1.8.1.7       China: Monoclonal Antibodies (mAbs) Market, By End User, 2019–2028 (USD Million)

12.1.8.2       Japan: Monoclonal Antibodies (mAbs) Market – Revenue and Forecast to 2028 (USD Million)

12.1.8.2.1       Japan: Monoclonal Antibodies (mAbs) Market – Revenue and Forecast to 2028 (USD Million)

12.1.8.2.2       Japan: Monoclonal Antibodies (mAbs) Market, by Source, 2019–2028 (USD Million)

12.1.8.2.3       Japan: Monoclonal Antibodies (mAbs) Market, by Product, 2019–2028 (USD Million)

12.1.8.2.4       Japan: Monoclonal Antibodies (mAbs) Market, by Production Method, 2019–2028 (USD Million)

12.1.8.2.5       Japan: Monoclonal Antibodies (mAbs) Market, by Indication, 2019–2028 (USD Million)

12.1.8.2.6       Japan: Monoclonal Antibodies (mAbs) Market, by Application, 2019–2028 (USD Million)

12.1.8.2.7       Japan: Monoclonal Antibodies (mAbs) Market, By End User, 2019–2028 (USD Million)

12.1.8.3       India: Monoclonal Antibodies (mAbs) Market – Revenue and Forecast to 2028 (USD Million)

12.1.8.3.1       India: Monoclonal Antibodies (mAbs) Market – Revenue and Forecast to 2028 (USD Million)

12.1.8.3.2       India: Monoclonal Antibodies (mAbs) Market, by Source, 2019–2028 (USD Million)

12.1.8.3.3       India: Monoclonal Antibodies (mAbs) Market, by Production Method, 2019–2028 (USD Million)

12.1.8.3.4       India: Monoclonal Antibodies (mAbs) Market, by Indication, 2019–2028 (USD Million)

12.1.8.3.5       India: Monoclonal Antibodies (mAbs) Market, by Application, 2019–2028 (USD Million)

12.1.8.3.6       India: Monoclonal Antibodies (mAbs) Market, By End User, 2019–2028 (USD Million)

12.1.8.4       South Korea: Monoclonal Antibodies (mAbs) Market – Revenue and Forecast to 2028 (USD Million)

12.1.8.4.1       South Korea: Monoclonal Antibodies (mAbs) Market – Revenue and Forecast to 2028 (USD Million)

12.1.8.4.2       South Korea: Monoclonal Antibodies (mAbs) Market, by Source, 2019–2028 (USD Million)

12.1.8.4.3       South Korea: Monoclonal Antibodies (mAbs) Market, by Production Method, 2019–2028 (USD Million)

12.1.8.4.4       South Korea: Monoclonal Antibodies (mAbs) Market, by Indication, 2019–2028 (USD Million)

12.1.8.4.5       South Korea: Monoclonal Antibodies (mAbs) Market, By End User, 2019–2028 (USD Million)

12.1.8.5       Australia: Monoclonal Antibodies (mAbs) Market – Revenue and Forecast to 2028 (USD Million)

12.1.8.5.1       Australia: Monoclonal Antibodies (mAbs) Market – Revenue and Forecast to 2028 (USD Million)

12.1.8.5.2       Australia: Monoclonal Antibodies (mAbs) Market, by Source, 2019–2028 (USD Million)

12.1.8.5.3       Australia: Monoclonal Antibodies (mAbs) Market, By Production Method, 2019–2028 (USD Million)

12.1.8.5.4       Australia: Monoclonal Antibodies (mAbs) Market, By Indication, 2019–2028 (USD Million)

12.1.8.5.5       Australia: Monoclonal Antibodies (mAbs) Market, By Application, 2019–2028 (USD Million)

12.1.8.5.6       Australia: Monoclonal Antibodies (mAbs) Market, By End User, 2019–2028 (USD Million)

12.1.8.6       Rest of Asia Pacific: Monoclonal Antibodies (mAbs) Market – Revenue and Forecast to 2028 (USD Million)

12.1.8.6.1       Rest of Asia Pacific: Monoclonal Antibodies (mAbs) Market – Revenue and Forecast to 2028 (USD Million)

12.1.8.6.2       Rest of Asia Pacific: Monoclonal Antibodies (mAbs) Market, by Source, 2019–2028 (USD Million)

12.1.8.6.3       Rest of Asia Pacific: Monoclonal Antibodies (mAbs) Market, by Production Method, 2019–2028 (USD Million)

12.1.8.6.4       Rest of Asia Pacific: Monoclonal Antibodies (mAbs) Market, by Indication, 2019–2028 (USD Million)

12.1.8.6.5       Rest of Asia Pacific: Monoclonal Antibodies (mAbs) Market, by Application, 2019–2028 (USD Million)

12.1.8.6.6       Rest of Asia Pacific: Monoclonal Antibodies (mAbs) Market, By End User, 2019–2028 (USD Million)

13.        Impact Of COVID-19 Pandemic on Monoclonal Antibodies (mAbs) Market

13.1      Asia Pacific: Impact Assessment of COVID-19 Pandemic

14.        Monoclonal Antibodies (mAbs) Market–Industry Landscape

14.1      Overview

14.2      Growth Strategies Done by the Companies in the Market, (%)

14.3      Organic Developments

14.3.1     Overview

14.4      Inorganic Developments

14.4.1     Overview

15.        Company Profiles

15.1      Novartis AG

15.1.1     Key Facts

15.1.2     Business Description

15.1.3     Products and Services

15.1.4     Financial Overview

15.1.5     SWOT Analysis

15.1.6     Key Developments

15.2      Pfizer Inc.

15.2.1     Key Facts

15.2.2     Business Description

15.2.3     Products and Services

15.2.4     Financial Overview

15.2.5     SWOT Analysis

15.2.6     Key Developments

15.3      GlaxoSmithKline plc.

15.3.1     Key Facts

15.3.2     Business Description

15.3.3     Products and Services

15.3.4     Financial Overview

15.3.5     SWOT Analysis

15.3.6     Key Developments

15.4      Amgen Inc.

15.4.1     Key Facts

15.4.2     Business Description

15.4.3     Products and Services

15.4.4     Financial Overview

15.4.5     SWOT Analysis

15.4.6     Key Developments

15.5      DAIICHI SANKYO COMPANY LIMITED

15.5.1     Key Facts

15.5.2     Business Description

15.5.3     Products and Services

15.5.4     Financial Overview

15.5.5     SWOT Analysis

15.5.6     Key Developments

15.6      F. HOFFMANN-LA ROCHE LTD.

15.6.1     Key Facts

15.6.2     Business Description

15.6.3     Products and Services

15.6.4     Financial Overview

15.6.5     SWOT Analysis

15.6.6     Key Developments

15.7      AstraZeneca

15.7.1     Key Facts

15.7.2     Business Description

15.7.3     Products and Services

15.7.4     Financial Overview

15.7.5     SWOT Analysis

15.7.6     Key Developments

15.8      Eli Lilly and Company.

15.8.1     Key Facts

15.8.2     Business Description

15.8.3     Products and Services

15.8.4     Financial Overview

15.8.5     SWOT Analysis

15.8.6     Key Developments

15.9      Bayer AG

15.9.1     Key Facts

15.9.2     Business Description

15.9.3     Products and Services

15.9.4     Financial Overview

15.9.5     SWOT Analysis

15.9.6     Key Developments

15.10   Bristol-Myers Squibb Company

15.10.1  Key Facts

15.10.2  Business Description

15.10.3  Products and Services

15.10.4  Financial Overview

15.10.5  SWOT Analysis

15.10.6  Key Developments

16.        Appendix

16.1      About The Insight Partners

16.2      Glossary of Terms


LIST OF TABLES

Table 1.             Asia Pacific Monoclonal Antibodies (mAbs) Market, by Source – Revenue and Forecast to 2028 (USD Million)

Table 2.             Asia Pacific Monoclonal Antibodies (mAbs) Market, by Production Method – Revenue and Forecast to 2028 (USD Million)

Table 3.             Asia Pacific Monoclonal Antibodies (mAbs) Market, by Indication – Revenue and Forecast to 2028 (USD Million)

Table 4.             Asia Pacific Monoclonal Antibodies (mAbs) Market, by Application – Revenue and Forecast to 2028 (USD Million)

Table 5.             Asia Pacific Monoclonal Antibodies (mAbs) Market, By End User – Revenue and Forecast to 2028 (USD Million)

Table 6.             China Monoclonal Antibodies (mAbs) Market, by Source – Revenue and Forecast to 2028 (USD Million)

Table 7.             China Monoclonal Antibodies (mAbs) Market, by Production Method – Revenue and Forecast to 2028 (USD Million)

Table 8.             China Monoclonal Antibodies (mAbs) Market, by Indication – Revenue and Forecast to 2028 (USD Million)

Table 9.             China Monoclonal Antibodies (mAbs) Market, by Application – Revenue and Forecast to 2028 (USD Million)

Table 10.          China Monoclonal Antibodies (mAbs) Market, by Product – Revenue and Forecast to 2028 (USD Million)

Table 11.          China Monoclonal Antibodies (mAbs) Market, By End User – Revenue and Forecast to 2028 (USD Million)

Table 12.          Japan Monoclonal Antibodies (mAbs) Market, by Source – Revenue and Forecast to 2028 (USD Million)

Table 13.          Japan Monoclonal Antibodies (mAbs) Market, by Product – Revenue and Forecast to 2028 (USD Million)

Table 14.          Japan Monoclonal Antibodies (mAbs) Market, by Production Method – Revenue and Forecast to 2028 (USD Million)

Table 15.          Japan Monoclonal Antibodies (mAbs) Market, by Indication – Revenue and Forecast to 2028 (USD Million)

Table 16.          Japan Monoclonal Antibodies (mAbs) Market, by Application – Revenue and Forecast to 2028 (USD Million)

Table 17.          Japan Monoclonal Antibodies (mAbs) Market, By End User – Revenue and Forecast to 2028 (USD Million)

Table 18.          India Monoclonal Antibodies (mAbs) Market, by Source – Revenue and Forecast to 2028 (USD Million)

Table 19.          India Monoclonal Antibodies (mAbs) Market, by Production Method – Revenue and Forecast to 2028 (USD Million)

Table 20.          India Monoclonal Antibodies (mAbs) Market, by Indication – Revenue and Forecast to 2028 (USD Million)

Table 21.          India Monoclonal Antibodies (mAbs) Market, by Application – Revenue and Forecast to 2028 (USD Million)

Table 22.          India Monoclonal Antibodies (mAbs) Market, By End User – Revenue and Forecast to 2028 (USD Million)

Table 23.          South Korea Monoclonal Antibodies (mAbs) Market, by Product – Revenue and Forecast to 2028 (USD Million)

Table 24.          South Korea Monoclonal Antibodies (mAbs) Market, by Production Method – Revenue and Forecast to 2028 (USD Million)

Table 25.          South Korea Monoclonal Antibodies (mAbs) Market, by Indication – Revenue and Forecast to 2028 (USD Million)

Table 26.          South Korea Monoclonal Antibodies (mAbs) Market, By End User – Revenue and Forecast to 2028 (USD Million)

Table 27.          Australia Monoclonal Antibodies (mAbs) Market, by Source – Revenue and Forecast to 2028 (USD Million)

Table 28.          Australia Monoclonal Antibodies (mAbs) Market, By Production Method – Revenue and Forecast to 2028 (USD Million)

Table 29.          Australia Monoclonal Antibodies (mAbs) Market, By Indication – Revenue and Forecast to 2028 (USD Million)

Table 30.          Australia Monoclonal Antibodies (mAbs) Market, By Application – Revenue and Forecast to 2028 (USD Million)

Table 31.          Australia Monoclonal Antibodies (mAbs) Market, By End User – Revenue and Forecast to 2028 (USD Million)

Table 32.          Rest of Asia Pacific Monoclonal Antibodies (mAbs) Market, by Source – Revenue and Forecast to 2028 (USD Million)

Table 33.          Rest of Asia Pacific Monoclonal Antibodies (mAbs) Market, by Production Method – Revenue and Forecast to 2028 (USD Million)

Table 34.          Rest of Asia Pacific Monoclonal Antibodies (mAbs) Market, by Indication – Revenue and Forecast to 2028 (USD Million)

Table 35.          Rest of Asia Pacific Monoclonal Antibodies (mAbs) Market, by Application – Revenue and Forecast to 2028 (USD Million)

Table 36.          Rest of Asia Pacific Monoclonal Antibodies (mAbs) Market, By End User – Revenue and Forecast to 2028 (USD Million)

Table 37.          Organic Developments Done by Companies

Table 38.          Inorganic Developments Done by Companies

Table 39.          Glossary of Terms


LIST OF FIGURES

Figure 1.           Monoclonal Antibodies (mAbs) Market Segmentation

Figure 2.           Asia Pacific Monoclonal Antibodies (mAbs) Market Overview

Figure 3.           Human Segment Held Largest Share of Source Segment in Monoclonal Antibodies (mAbs) Market

Figure 4.           China is Expected to Show Remarkable Growth During the Forecast Period

Figure 5.           Asia Pacific Monoclonal Antibodies (mAbs) Market, Industry Landscape

Figure 6.           Asia Pacific: PEST Analysis

Figure 7.           Experts Opinion

Figure 8.           Impact Analysis of Drivers and Restraints Pertaining to Monoclonal Antibodies (mAbs) Market

Figure 9.           Asia Pacific Monoclonal Antibodies (mAbs) Market – By Geography Forecast and Analysis – 2021 - 2028

Figure 10.        Asia Pacific Monoclonal Antibodies (mAbs) Market, by Source, 2020 & 2028 (%)

Figure 11.        Murine: Monoclonal Antibodies (mAbs) Market Revenue and Forecasts to 2028 (US$ Million)

Figure 12.        Chimeric: Monoclonal Antibodies (mAbs) Market Revenue and Forecasts to 2028 (US$ Million)

Figure 13.        Humanized: Monoclonal Antibodies (mAbs) Market Revenue and Forecasts to 2028 (US$ Million)

Figure 14.        Human: Monoclonal Antibodies (mAbs) Market Revenue and Forecasts to 2028 (US$ Million)

Figure 15.        Asia Pacific Monoclonal Antibodies (mAbs) Market Share by Production Method Segment - 2020 & 2028 (%)

Figure 16.        In-Vivo: Monoclonal Antibodies (mAbs) Market Revenue and Forecasts To 2028 (US$ Million)

Figure 17.        In-Vitro: Monoclonal Antibodies (mAbs) Market Revenue and Forecasts To 2028 (US$ Million)

Figure 18.        Asia Pacific Monoclonal Antibodies (mAbs) Market Share by Indication Segment - 2020 & 2028 (%)

Figure 19.        Cancer: Monoclonal Antibodies (mAbs) Market Revenue and Forecasts To 2028 (US$ Million)

Figure 20.        Autoimmune Diseases: Monoclonal Antibodies (mAbs) Market Revenue and Forecasts To 2028 (US$ Million)

Figure 21.        Inflammatory Diseases: Monoclonal Antibodies (mAbs) Market Revenue and Forecasts To 2028 (US$ Million)

Figure 22.        Infectious Diseases: Monoclonal Antibodies (mAbs) Market Revenue and Forecasts To 2028 (US$ Million)

Figure 23.        Microbial Diseases: Monoclonal Antibodies (mAbs) Market Revenue and Forecasts To 2028 (US$ Million)

Figure 24.        Others: Monoclonal Antibodies (mAbs) Market Revenue and Forecasts To 2028 (US$ Million)

Figure 25.        Asia Pacific Monoclonal Antibodies (mAbs) Market Share by Application Segment - 2020 & 2028 (%)

Figure 26.        Diagnostic Applications: Monoclonal Antibodies (mAbs) Market Revenue and Forecasts To 2028 (US$ Million)

Figure 27.        Therapeutic Applications: Monoclonal Antibodies (mAbs) Market Revenue and Forecasts To 2028 (US$ Million)

Figure 28.        Research Applications: Monoclonal Antibodies (mAbs) Market Revenue and Forecasts To 2028 (US$ Million)

Figure 29.        Asia Pacific Monoclonal Antibodies (mAbs) Market Share by End-User Segment - 2020 & 2028 (%)

Figure 30.        Hospitals: Monoclonal Antibodies (mAbs) Market Revenue and Forecasts To 2028 (US$ Million)

Figure 31.        Research Institutes: Monoclonal Antibodies (mAbs) Market Revenue and Forecasts To 2028 (US$ Million)

Figure 32.        Others: Monoclonal Antibodies (mAbs) Market Revenue and Forecasts To 2028 (US$ Million)

Figure 33.        Asia Pacific: Monoclonal Antibodies (mAbs) Market, by Key Country – Revenue (2021) (USD Million)

Figure 34.        Asia Pacific Monoclonal Antibodies (mAbs) Market Revenue and Forecast to 2028 (USD Million)

Figure 35.        Impact of COVID-19 Pandemic in Asia Pacific Country Markets

Figure 36.        Growth Strategies Done by the Companies in the Market, (%)

  1. Novartis AG
  2. Pfizer Inc.
  3. GlaxoSmithKline plc.
  4. Amgen Inc
  5. DAIICHI SANKYO COMPANY, LIMITED
  6. F. Hoffmann-La Roche Ltd.
  7. AstraZeneca
  8. Eli Lilly and Company
  9. Bayer AG
  10. Bristol-Myers Squibb Company
  • Save and reduce time carrying out entry-level research by identifying the growth, size, leading players, and segments in the Asia Pacific monoclonal antibodies market.
  • Highlights key business priorities in order to assist companies to realign their business strategies.
  • The key findings and recommendations highlight crucial progressive industry trends in the Asia Pacific monoclonal antibodies market, thereby allowing players across the value chain to develop effective long-term strategies.
  • Develop/modify business expansion plans by using substantial growth offering developed and emerging markets.
  • Scrutinize in-depth global market trends and outlook coupled with the factors driving the market, as well as those hindering it.
  • Enhance the decision-making process by understanding the strategies that underpin security interest with respect to client products, segmentation, pricing and distribution.
Report Code
Full Name
Country Name
Email Id
Phone Number
Job Title
Company
Requirement

Note : Your data will never be shared with third parties, however, we may send you information from time to time about our products that may be of interest to you. By submitting your details, you agree to be contacted by us. You may contact us at any time to opt-out.


Purchase Options
Single User License
$3000
$1800
Site License
$4000
$2400
Enterprise License
$5000
$3000