The Insight Partners have analyzed the market in three different scenarios based on LiDAR application by upcoming wind farms. In the first scenario, we have estimated that all the upcoming wind farm projects will use LiDAR for wind assessment instead of a met mast. In the second scenario, we have estimated that 75% of the new wind farm projects will be utilizing LiDAR. And in the third scenario, we have estimated that ~50% of the new wind farm projects will use LiDAR.
Several governments are investing tremendous amounts in developing wind farm projects, as wind power is emerging as one of the best alternatives to meet future energy demands sustainably. Due to a highly expensive setup, wind projects require effective wind measurement systems to measure the wind speed to optimize the outputs. Wind LiDAR is a remote sensing technology that accurately measures the speed and direction of the wind with the help of low-noise laser lights. The escalating adoption of LiDAR systems for wind resource assessment to achieve the optimum yield out of wind farms and growing investments in exploring wind energy projects are the key factors driving the demand for this technology in South Africa. Increasing investments in new wind projects signify growth potential for the wind power LiDAR market in this country. As per the Global Wind Energy Council (GWEC) data, South Africa has the greatest amount of wind capacity in the MEA, followed by Egypt and Morocco. The South African government has pledged to reach net-zero CO2 emissions by 2050, and the investments in new wind projects support its clean energy goals with a pipeline of more than ~2.4 GW of new wind and solar projects.
The hub height and rotor diameter are the two crucial factors that help determine the cost of energy production. An increase in hub height has led to greater output from turbines under ideal conditions. Thus, increasing the hub height for greater exposure to wind speed is the prominent factor propelling the demand for wind LiDAR systems. The South African government has adopted initiatives to include renewable energy technology in the energy mix and direct the procurement and development of utility-scale renewable energy projects. Wind energy and solar energy are the most dominating renewable energy types in South Africa. The South African government is consistently working on the allocation of 1,600 MW for wind technology annually from 2022 to 2030, totaling 14,400 MW. Thus, the booming wind projects in South Africa hold a potential market for wind power LiDAR systems.
The growing initiatives for creating new wind projects hold potential growth opportunities for the wind power LiDAR market players. For instance, as per the Minister of Mineral Resources, the chosen 25 bidders accounted for 2.583 GW of capacity, divided into 1.608 GW of onshore wind and 975 MW of solar PV in November 2021. These allocated bidders are expected to start generating electricity from April 2024. Moreover, two huge wind projects, namely Kangnas Wind Farm and Perdekraal East Wind Farm, were connected to the country's national grid in August 2020 under its fourth window of Renewable Energy Industry Power Producer Procurement Programs. As per the Global Wind Energy Council (GWEC) data, South Africa has the greatest amount of wind capacity in the MEA, followed by Egypt and Morocco. However, the country is heavily reliant on coal to produce energy, making it one of the top emitters of CO2 worldwide. The South African government has pledged to reach net-zero CO2 emissions by 2050. In November 2021, the country received an investment worth US$ 578.20 million from five of the G20 members intending to cut its GHG emissions and facilitate the transition away from coal-centric power generation. Moreover, in March 2022, a Norwegian investment fund and the UK development finance institution committed investments worth US$ 1.87 billion and 1.24 billion, respectively. Such investments by stakeholders from other countries also support the clean energy goals of South Africa, as they will help create the pipeline of over ~2.4 GW of new wind and solar projects. Thus, such supportive initiatives from the government for creating new wind projects hold potential opportunities for the growth of the wind power LiDAR market.
The COVID-19 pandemic dramatically impacted the global economy in 2020. The global crisis hampered business activities in the energy & power industry significantly. Growing investments in the renewable energy sector of South Africa make this country one of the key markets for the future growth of the wind power LiDAR market. Before the outbreak of COVID-19, the wind power LiDAR market in South Africa was experiencing substantial growth due to the rising demand for clean energy sources, with increasing favorable initiatives and supportive regulatory policies and regulations by governments. Before 2020, significant investment initiatives supported the development of onshore and offshore wind farm projects. Johannesburg, Pretoria, Western Cape, and Durban are the prominent cities in South Africa that held significant potential for wind farms. As per the data published by the South African Wind Energy Association, in 2020, the operational wind projects have resulted in a reduction in CO2 emissions by 53% of the total 12.1 metric tons of annual P50 projection by wind Independent Power Producers. However, the emergence of the COVID-19 pandemic led to decreased investments in wind farms, thereby limiting their installations, which hampered the South Africa wind power LiDAR market proliferation.
During the initial days of the COVID-19 pandemic, the crisis restricted all business deals, collaborations, and partnerships. However, with ease in restrictions and reopening of business units, discontinued projects were resumed. From the second half of 2020, original equipment manufacturers (OEMs) and Independent Power Producers began investing in the development of advanced LiDAR systems, leveraging the demand for a clean source of renewable energy. The pandemic has forced businesses to restructure their business models, focusing on strategies to strengthen their market shares. Therefore, although the South Africa wind power LiDAR market plummeted initially due to the adverse impact of the COVID-19 pandemic and the related social restrictions, it has made a strong recovery since 2021.
Government initiatives supporting the revival of businesses and rising investments by several governments are likely to drive the South Africa wind power LiDAR market's growth after the COVID-19 pandemic. Economic stimulus packages prepared by South Africa mention companies/institutions in the energy sector, especially the renewable energies sector. The South African government took several measures to bolster its economy through stimulus packages. For instance, in June 2020, a US$ 34.46 billion economic response package was granted by the South African government. Moreover, the construction projects of new energy facilities in the renewable energy sector were delayed or discontinued indefinitely in 2020. Implementing lockdowns in South Africa was challenging because a huge portion of the population is engaged in informal sector activities for their livelihoods, has inadequate water and electricity infrastructures, and has higher risks of economic recession. Thus, the COVID-19 pandemic hampered the country's economic stability, which led to the delay and suspension of ongoing wind farm projects. Thus, the recovery of various enterprises from the repercussions of the COVID-19 pandemic was challenging, which restricted the growth prospects of the wind power LiDAR market in South Africa.
As per the study conducted by the South African Wind Energy Association, the government of South Africa is estimated to invest in new wind farms, especially in offshore wind projects, which is expected to boost the demand for wind power LiDAR from 2022. Further, in November 2021, the South African government allocated 12 onshore wind farms to the preferred bidder with a combined capacity of just over ~1.6GW.
Based on installation, the South Africa wind power LiDAR market is segmented into onshore wind farms and offshore wind farms. In 2021, the onshore wind farms segment led the wind power LiDAR market, accounting for the largest share in the market.
Based on installation, the South Africa wind power LiDAR market is segmented into onshore wind farms and offshore wind farms. In 2021, the onshore wind farms segment led the wind power LiDAR market, accounting for the largest share in the market.
Based on installation, the South Africa wind power LiDAR market is bifurcated into onshore wind farms and offshore wind farms. In 2021, the onshore wind farms segment led the wind power LiDAR market, accounting for the largest share in the market.
Strategic insights for the South Africa Wind Power LiDAR provides data-driven analysis of the industry landscape, including current trends, key players, and regional nuances. These insights offer actionable recommendations, enabling readers to differentiate themselves from competitors by identifying untapped segments or developing unique value propositions. Leveraging data analytics, these insights help industry players anticipate the market shifts, whether investors, manufacturers, or other stakeholders. A future-oriented perspective is essential, helping stakeholders anticipate market shifts and position themselves for long-term success in this dynamic region. Ultimately, effective strategic insights empower readers to make informed decisions that drive profitability and achieve their business objectives within the market.

| Report Attribute | Details |
|---|---|
| Market size in 2021 | US$ 4.45 Million |
| Market Size by 2030 | US$ 5.86 Million |
| CAGR (2021 - 2030) | 3.1% |
| Historical Data | 2019-2020 |
| Forecast period | 2022-2030 |
| Segments Covered |
By Installation
|
| Regions and Countries Covered | South Africa
|
| Market leaders and key company profiles |
|
The geographic scope of the South Africa Wind Power LiDAR refers to the specific areas in which a business operates and competes. Understanding local distinctions, such as diverse consumer preferences (e.g., demand for specific plug types or battery backup durations), varying economic conditions, and regulatory environments, is crucial for tailoring strategies to specific markets. Businesses can expand their reach by identifying underserved areas or adapting their offerings to meet local demands. A clear market focus allows for more effective resource allocation, targeted marketing campaigns, and better positioning against local competitors, ultimately driving growth in those targeted areas.

List of key Players
- Vaisala
- NRG Systems
- Fugro
- John Wood Group PLC
- HALO Photonics
- Windar Photonics A/S
- ZX Lidars
- Everise Technology Ltd.
- Meatech Solutions LLP
- Velodyne
- Geo-Net South Africa PTY Ltd
- GeoWIND
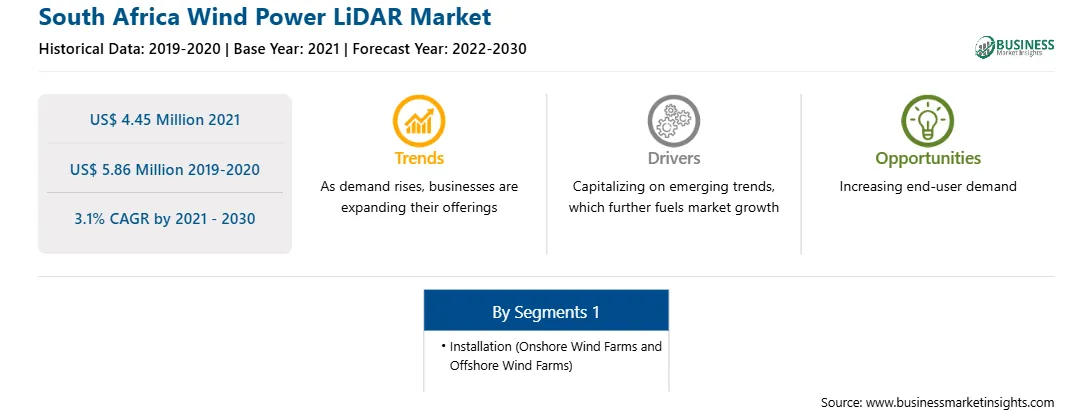
The South Africa Wind Power LiDAR Market is valued at US$ 4.45 Million in 2021, it is projected to reach US$ 5.86 Million by 2030.
As per our report South Africa Wind Power LiDAR Market, the market size is valued at US$ 4.45 Million in 2021, projecting it to reach US$ 5.86 Million by 2030. This translates to a CAGR of approximately 3.1% during the forecast period.
The South Africa Wind Power LiDAR Market report typically cover these key segments-
The historic period, base year, and forecast period can vary slightly depending on the specific market research report. However, for the South Africa Wind Power LiDAR Market report:
The South Africa Wind Power LiDAR Market is populated by several key players, each contributing to its growth and innovation. Some of the major players include:
The South Africa Wind Power LiDAR Market report is valuable for diverse stakeholders, including:
Essentially, anyone involved in or considering involvement in the South Africa Wind Power LiDAR Market value chain can benefit from the information contained in a comprehensive market report.