North America Photoacoustic Tomography Market Forecast to 2028 - COVID-19 Impact and Regional Analysis By Geometry (Planar, Cylindrical, and Spherical), Type (Intravascular Photoacoustic Tomography, Photoacoustic Microscopy, and Others), Application (Tumor Angiogenesis, Blood Oxygenation Mapping, Functional Brain Imaging, Skin Melanoma Detection, Methemoglobin Measuring, and Others), and End User (Hospitals, Diagnostic Imaging Centers, Academic & Research Institutes, and Others)
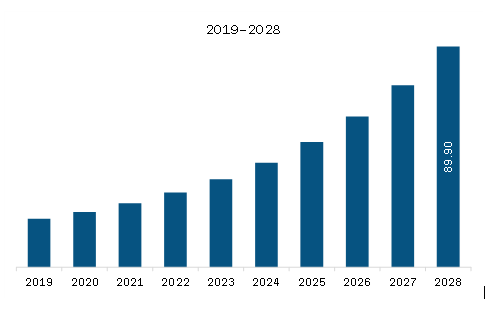
The photoacoustic tomography market in North America is expected to grow from US$ 26.06 million in 2021 to US$ 89.90 million by 2028; it is estimated to register a CAGR of 19.3% from 2021 to 2028.
Cancer is one of the medical conditions that significantly impact society, and it is one of the major causes of death worldwide. According to the data provided by the National Institute of Cancer, in 2020, ~1,806,590 were diagnosed suffering from cancer in the US, and ~606,520 people died from cancer. As per the American Institute of Cancer Research, in 2020, ~18.1k cases were active globally. Furthermore, the World Health Organization (WHO) stated that about 10 thousand deaths, or one in six death, were due to cancer. The most common cancers are lung cancer, breast cancer, colon cancer, rectum cancer, and prostate cancer. Every year, ~400,000 children develop cancer. Moreover, ~13% of cancers were diagnosed in 2018 globally due to carcinogenic infections, including Helicobacter pylori, hepatitis B virus, human papillomavirus (HPV), hepatitis C virus, and Epstein-Barr virus.
Diagnosing cancer during early stages increases the cure rate, decreases the recurrence rate, and reduces healthcare costs. Over the past few decades, the continual development of medical imaging modalities has been vital in diagnosing cancer, selecting therapies, and monitoring responses to selected treatments. Photoacoustic tomography (PAT) is a hybrid imaging modality combining optical contrast from absorption of light with the remarkable spatiotemporal resolution of ultrasound imaging, offering biomedical morphologic and functional information on early-stage cancer. PAT has shown tremendous potential in cellular and molecular-specific cancer imaging. The key advantages that make PAT a suitable diagnostic modality for clinical applications are its ability to offer molecular information at clinically relevant depths with a high resolution and real-time. Moreover, it can be easily combined with ultrasound (US) imaging as both imaging modalities share hardware components and a common signal detection regimen. Therefore, it is possible to obtain information on the anatomical, functional, and molecular content of diseased tissues using US imaging and PAT. PAT in cancer diagnosis relies on the enhanced optical absorption of tumors, the relatively high optical transparency of normal tissues, and low acoustic distortion and attenuation of tissues. Therefore, this accuracy of PAT for the detection of cancer tissue and increase in the prevalence of cancer is driving the growth of the photoacoustic tomography market.
With new features and technologies, vendors attract new customers and expand their footprints in upcoming markets. This factor is likely to boost the North America photoacoustic tomography market at a notable CAGR during the forecast period.
North America Photoacoustic Tomography Market Revenue and Forecast to 2028 (US$ Million)
North America Photoacoustic Tomography Market Segmentation
The North America photoacoustic tomography market is segmented into geometry, type, application, end user, and country. Based on geometry, the photoacoustic tomography market is segmented into planar, cylindrical, and spherical. The planar segment held the largest share of the market in 2021. Based on type, the market is categorized into intravascular photoacoustic tomography, photoacoustic microscopy, and others. The intravascular photoacoustic tomography segment held the largest share of the market in 2021. Based on application, the market is segmented into tumor angiogenesis, blood oxygenation mapping, functional brain imaging, skin melanoma detection, methemoglobin measuring, and others. The tumor angiogenesis segment held the largest market share in 2021. Based on end user, the market is segmented into hospitals, diagnostics imaging centers, academic and research institutes, and others. The hospital segment held the largest market share in 2021. Based on country, the North America photoacoustic tomography market is segmented into the US, Canada, and Mexico. The US held the largest market share in 2021.
Advantest Corporation; CYBERDYNE INC.; FUJIFILM Visualsonics Inc.; InnoLas Laser GmbH; OPOTEK LLC; Seno Medical; and TomoWave Laboratories, Inc. are among the leading companies operating in the North America photoacoustic tomography market.
1. Introduction
1.1 Study Scope
1.2 The Insight Partners Research Report Guidance
1.3 Market Segmentation
1.3.1 North America Photoacoustic Tomography Market – By Geometry
1.3.2 North America Photoacoustic Tomography Market – By Type
1.3.3 North America Photoacoustic Tomography Market – By Application
1.3.4 North America Photoacoustic Tomography Market – By End User
1.3.5 North America Photoacoustic Tomography Market – By Country
2. North America Photoacoustic Tomography Market – Key Takeaways
3. Research Methodology
3.1 Coverage
3.2 Secondary Research
3.3 Primary Research
4. North America Photoacoustic Tomography Market – Market Landscape
4.1 Overview
4.2 North America PEST Analysis
4.3 Experts Opinion
5. North America Photoacoustic Tomography Market – Key Market Dynamics
5.1 Market Drivers
5.1.1 Rising Cases of Cancer
5.1.2 Surging Instances of Cardiovascular Diseases
5.2 Market Restraints
5.2.1 Various Disadvantages of Photoacoustic Tomography (PAT)
5.3 Market Opportunities
5.3.1 Rising use of Photoacoustic Tomography in Clinical Research
5.4 Future Trends
5.4.1 Rising Deep Learning Photoacoustic Tomography
5.5 Impact Analysis
6. Photoacoustic Tomography Market – North America Analysis
6.1 North America Photoacoustic Tomography Market Revenue Forecast and Analysis
7. North America Photoacoustic Tomography Market Revenue and Forecasts To 2028– by Geometry
7.1 Overview
7.2 North America Photoacoustic Tomography Market Revenue Share, by Geometry (2021 and 2028)
7.3 Planar
7.3.1 Overview
7.3.2 Planar: Photoacoustic Tomography Market – Revenue and Forecast to 2028 (US$ Thousand)
7.4 Cylindrical
7.4.1 Overview
7.4.2 Cylindrical: Photoacoustic Tomography Market – Revenue and Forecast to 2028 (US$ Thousands)
7.5 Spherical
7.5.1 Overview
7.5.2 Spherical: Photoacoustic Tomography Market – Revenue and Forecast to 2028 (US$ Thousands)
8. North America Photoacoustic Tomography Market Analysis and Forecast to 2028 – By Type
8.1 North America Photoacoustic Tomography Market Revenue Share, by Type (2021 and 2028)
8.2 Intravascular Photoacoustic Tomography
8.2.1 Overview
8.2.2 Intravascular: Photoacoustic Tomography Market – Revenue and Forecast to 2028 (US$ Thousands)
8.3 Photoacoustic Microscopy
8.3.1 Overview
8.3.2 Photoacoustic Microscopy: Photoacoustic Tomography Market – Revenue and Forecast to 2028 (US$ Thousands)
8.4 Others
8.4.1 Overview
8.4.2 Others: Photoacoustic Tomography Market – Revenue and Forecast to 2028 (US$ Thousands)
9. North America Photoacoustic Tomography Market Analysis and Forecast to 2028 – By Application
9.1 North America Photoacoustic Tomography Market Revenue Share, by Application (2021 and 2028)
9.2 Tumor Angiogenesis
9.2.1 Overview
9.2.2 Tumor Angiogenesis: Photoacoustic Tomography Market – Revenue and Forecast to 2028 (US$ Thousands)
9.3 Blood Oxygenation Mapping
9.3.1 Overview
9.3.2 Blood Oxygenation Mapping: Photoacoustic Tomography Market – Revenue and Forecast to 2028 (US$ Thousands)
9.4 Functional Brain Imaging
9.4.1 Overview
9.4.2 Functional Brain Imaging: Photoacoustic Tomography Market – Revenue and Forecast to 2028 (US$ Thousands)
9.5 Skin Melanoma Detection
9.5.1 Overview
9.5.2 Skin Melanoma Detection: Photoacoustic Tomography Market – Revenue and Forecast to 2028 (US$ Thousands)
9.6 Methemoglobin Measuring
9.6.1 Overview
9.6.2 Methemoglobin Measuring: Photoacoustic Tomography Market – Revenue and Forecast to 2028 (US$ Thousands)
9.7 Others
9.7.1 Overview
9.7.2 Others: Photoacoustic Tomography Market – Revenue and Forecast to 2028 (US$ Thousands)
10. North America Photoacoustic Tomography Market Analysis – By End User
10.1 Overview
10.2 North America Photoacoustic Tomography Market Revenue Share, by End User (2021 and 2028)
10.3 Hospitals
10.3.1 Overview
10.3.2 Hospitals: Photoacoustic Tomography Market – Revenue and Forecast to 2028 (US$ Thousands)
10.4 Diagnostics Imaging Centers
10.4.1 Overview
10.4.2 Diagnostics Imaging Centers: Photoacoustic Tomography Market – Revenue and Forecast to 2028 (US$ Thousands)
10.5 Academic and Research Institutes
10.5.1 Overview
10.5.2 Academic and Research Institutes: Photoacoustic Tomography Market – Revenue and Forecast to 2028 (US$ Thousands)
10.6 Others
10.6.1 Overview
10.6.2 Others: Photoacoustic Tomography Market – Revenue and Forecast to 2028 (US$ Thousands)
11. North America Photoacoustic Tomography Market Revenue and Forecasts to 2028 – Country Analysis
11.1 North America: Photoacoustic Tomography Market
11.1.1 Overview
11.1.3 North America: Photoacoustic Tomography Market, by Country, 2021 & 2028 (%)
11.1.3.1 US: Photoacoustic Tomography Market– Revenue and Forecast to 2028 (US$ Thousands)
11.1.3.1.1 US: Photoacoustic Tomography Market – Revenue and Forecast to 2028 (US$ Thousands)
11.1.3.1.2 US: Photoacoustic Tomography Market, by Geometry, 2019–2028 (US$ Thousands)
11.1.3.1.3 US: Photoacoustic Tomography Market, by Type, 2019–2028 (US$ Thousands)
11.1.3.1.4 US: Photoacoustic Tomography Market, by Application, 2019–2028 (US$ Thousands)
11.1.3.1.5 US: Photoacoustic Tomography Market, by End User, 2019–2028 (US$ Thousands)
11.1.3.2 Canada: Photoacoustic Tomography Market – Revenue and Forecast to 2028 (US$ Thousands)
11.1.3.2.1 Canada: Photoacoustic Tomography Market – Revenue and Forecast to 2028 (US$ Thousands)
11.1.3.2.2 Canada: Photoacoustic Tomography Market, by Geometry, 2019–2028 (US$ Thousands)
11.1.3.2.3 Canada: Photoacoustic Tomography Market, by Type, 2019–2028 (US$ Thousands)
11.1.3.2.4 Canada: Photoacoustic Tomography Market, by Application, 2019–2028 (US$ Thousands)
11.1.3.2.5 Canada: Photoacoustic Tomography Market, by End User, 2019–2028 (US$ Thousands)
11.1.3.3 Mexico: Photoacoustic Tomography Market – Revenue and Forecast to 2028 (US$ Thousands)
11.1.3.3.1 Mexico: Photoacoustic Tomography Market – Revenue and Forecast to 2028 (US$ Thousands)
11.1.3.3.2 Mexico: Photoacoustic Tomography Market, by Geometry – 2019–2028 (US$ Thousands)
11.1.3.3.3 Mexico: Photoacoustic Tomography Market, by Type, 2019–2028 (US$ Thousands)
11.1.3.3.4 Mexico: Photoacoustic Tomography Market, by Application, 2019–2028 (US$ Thousands)
11.1.3.3.5 Mexico: Photoacoustic Tomography Market, by End User, 2019–2028 (US$ Thousands)
12. Photoacoustic Tomography Market –Industry Landscape
12.1 Overview
12.2 Growth Strategies in the Photoacoustic Tomography Market
12.3 Organic Developments
12.3.1 Overview
12.4 Inorganic Developments
12.4.1 Overview
13. Company Profiles
13.1 FUJIFILM Visualsonics,Inc.
13.1.1 Key Facts
13.1.2 Business Description
13.1.3 Products and Services
13.1.4 Financial Overview
13.1.5 SWOT Analysis
13.1.6 Key Developments
13.2 TomoWave Laboratories, Inc.
13.2.1 Key Facts
13.2.2 Business Description
13.2.3 Products and Services
13.2.4 Financial Overview
13.2.5 SWOT Analysis
13.2.6 Key Developments
13.3 Advantest Corporation
13.3.1 Key Facts
13.3.2 Business Description
13.3.3 Products and Services
13.3.4 Financial Overview
13.3.5 SWOT Analysis
13.3.6 Key Developments
13.4 Aspectus GmbH
13.4.1 Key Facts
13.4.2 Business Description
13.4.3 Products and Services
13.4.4 Financial Overview
13.4.5 SWOT Analysis
13.4.6 Key Developments
13.5 CYBERDYNE INC.
13.5.1 Key Facts
13.5.2 Business Description
13.5.3 Products and Services
13.5.4 Financial Overview
13.5.5 SWOT Analysis
13.5.6 Key Developments
13.6 InnoLas Laser GmbH
13.6.1 Key Facts
13.6.2 Business Description
13.6.3 Products and Services
13.6.4 Financial Overview
13.6.5 SWOT Analysis
13.6.6 Key Developments
13.7 OPOTEK LLC
13.7.1 Key Facts
13.7.2 Business Description
13.7.3 Products and Services
13.7.4 Financial Overview
13.7.5 SWOT Analysis
13.7.6 Key Developments
13.8 Seno Medical
13.8.1 Key Facts
13.8.2 Business Description
13.8.3 Products and Services
13.8.4 Financial Overview
13.8.5 SWOT Analysis
13.8.6 Key Developments
14. Appendix
14.1 About The Insight Partners
14.2 Glossary of Terms
LIST OF TABLES
Table 1. US Photoacoustic Tomography Market, by Geometry – Revenue and Forecast to 2028 (US$ Thousands)
Table 2. US Photoacoustic Tomography Market, by Type – Revenue and Forecast to 2028 (US$ Thousands)
Table 3. US Photoacoustic Tomography Market, by Application – Revenue and Forecast to 2028 (US$ Thousands)
Table 4. US Photoacoustic Tomography Market, by End User – Revenue and Forecast to 2028 (US$ Thousands)
Table 5. Canada Photoacoustic Tomography Market, by Geometry – Revenue and Forecast to 2028 (US$ Thousands)
Table 6. Canada Photoacoustic Tomography Market, by Type – Revenue and Forecast to 2028 (US$ Thousands)
Table 7. Canada Photoacoustic Tomography Market, by Application – Revenue and Forecast to 2028 (US$ Thousands)
Table 8. Canada Photoacoustic Tomography Market, by End User – Revenue and Forecast to 2028 (US$ Thousands)
Table 9. Mexico Photoacoustic Tomography Market, by Geometry – Revenue and Forecast to 2028 (US$ Thousands)
Table 10. Mexico Photoacoustic Tomography Market, by Type – Revenue and Forecast to 2028 (US$ Thousands)
Table 11. Mexico Photoacoustic Tomography Market, by Application – Revenue and Forecast to 2028 (US$ Thousands)
Table 12. Mexico Photoacoustic Tomography Market, by End User – Revenue and Forecast to 2028 (US$ Thousands)
Table 13. Organic Developments Done By Companies
Table 14. Inorganic Developments Done By Companies
Table 15. Glossary of Terms
LIST OF FIGURES
Figure 1. North America Photoacoustic Tomography Market Segmentation
Figure 2. North America Photoacoustic Tomography Market Segmentation, By Country
Figure 3. North America Photoacoustic Tomography Market Overview
Figure 4. Planer Segment Held Largest Share of North America Photoacoustic Tomography Market
Figure 5. Asia Pacific to Show Significant Growth During Forecast Period
Figure 6. North America: PEST Analysis
Figure 7. Experts Opinion
Figure 8. North America Impact Analysis of Drivers and Restraints Pertaining to Photoacoustic Tomography Market
Figure 9. North America Photoacoustic Tomography Market – Revenue Forecast and Analysis – 2020- 2028 (in Thousands)
Figure 10. North America Photoacoustic Tomography Market Revenue Share, by Geometry (2021 and 2028)
Figure 11. North America Planar: Photoacoustic Tomography Market – Revenue and Forecast to 2028 (US$ Thousand)
Figure 12. North America Cylindrical: Photoacoustic Tomography Market – Revenue and Forecast to 2028 (US$ Thousands)
Figure 13. North America Spherical: Photoacoustic Tomography Market – Revenue and Forecast to 2028 (US$ Thousands)
Figure 14. North America Photoacoustic Tomography Market Revenue Share, by Type (2021 and 2028)
Figure 15. North America Intravascular: Photoacoustic Tomography Market – Revenue and Forecast to 2028 (US$ Thousands)
Figure 16. North America Photoacoustic Microscopy: Photoacoustic Tomography Market – Revenue and Forecast to 2028 (US$ Thousands)
Figure 17. North America Others: Photoacoustic Tomography Market – Revenue and Forecast to 2028 (US$ Thousands)
Figure 18. North America Photoacoustic Tomography Market Revenue Share, by Application (2021 and 2028)
Figure 19. North America Tumor Angiogenesis: Photoacoustic Tomography Market – Revenue and Forecast to 2028 (US$ Thousands)
Figure 20. North America Blood Oxygenation Mapping: Photoacoustic Tomography Market – Revenue and Forecast to 2028 (US$ Thousands)
Figure 21. North America Functional Brain Imaging: Photoacoustic Tomography Market – Revenue and Forecast to 2028 (US$ Thousands)
Figure 22. North America Skin Melanoma Detection: Photoacoustic Tomography Market – Revenue and Forecast to 2028 (US$ Thousands)
Figure 23. North America Methemoglobin Measuring: Photoacoustic Tomography Market – Revenue and Forecast to 2028 (US$ Thousands)
Figure 24. North America Others: Photoacoustic Tomography Market – Revenue and Forecast to 2028 (US$ Thousands)
Figure 25. North America Photoacoustic Tomography Market Revenue Share, by End User (2021 and 2028)
Figure 26. North America Hospitals: Photoacoustic Tomography Market – Revenue and Forecast to 2028 (US$ Thousands)
Figure 27. North America Diagnostics Imaging Centers: Photoacoustic Tomography Market – Revenue and Forecast to 2028 (US$ Thousands)
Figure 28. North America Academic and Research Institutes: Photoacoustic Tomography Market – Revenue and Forecast to 2028 (US$ Thousands)
Figure 29. North America Others: Photoacoustic Tomography Market – Revenue and Forecast to 2028 (US$ Thousands)
Figure 30. North America: Photoacoustic Tomography Market, by Key Country – Revenue (2021) (US$ Thousands)
Figure 31. North America: Photoacoustic Tomography Market, by Country, 2021 & 2028 (%)
Figure 32. US: Photoacoustic Tomography Market – Revenue and Forecast to 2028 (US$ Thousands)
Figure 33. Canada: Photoacoustic Tomography Market – Revenue and Forecast to 2028 (US$ Thousands)
Figure 34. Mexico: Photoacoustic Tomography Market – Revenue and Forecast to 2028 (US$ Thousands)
Figure 35. Growth Strategies in the Photoacoustic Tomography Market
- Advantest Corporation
- CYBERDYNE INC.
- FUJIFILM Visualsonics Inc.
- InnoLas Laser GmbH
- OPOTEK LLC
- Seno Medical
- TomoWave Laboratories, Inc.
- Save and reduce time carrying out entry-level research by identifying the growth, size, leading players and segments in the North America photoacoustic tomography market
- Highlights key business priorities in order to assist companies to realign their business strategies
- The key findings and recommendations highlight crucial progressive industry trends in the North America photoacoustic tomography market, thereby allowing players across the value chain to develop effective long-term strategies
- Develop/modify business expansion plans by using substantial growth offering developed and emerging markets
- Scrutinize in-depth North America market trends and outlook coupled with the factors driving the photoacoustic tomography market, as well as those hindering it
- Enhance the decision-making process by understanding the strategies that underpin commercial interest with respect to client products, segmentation, pricing and distribution