North America Branded Generics Market Forecast to 2028 – COVID-19 Impact and Regional Analysis – by Therapeutic Application (Oncology, Cardiovascular Diseases, Diabetes, Neurology, Gastrointestinal Diseases, Dermatology Diseases, Analgesics & Anti-Inflammatory, and Others), Distribution Channel (Hospitals, Retail Pharmacies, Online Pharmacies, and Drug Stores), Drug Class (Alkylating Agents, Antimetabolites, Hormones, Antihypertensive, Lipid-Lowering Drugs, Antidepressants, Antipsychotics, Antiepileptic, and Others), and Formulation Type (Oral, Parenteral, Topical, and Others)

BMIRE00026327 | Pages: 169 | Pharmaceuticals | Sep 2022 | Type: Regional | Status: Published

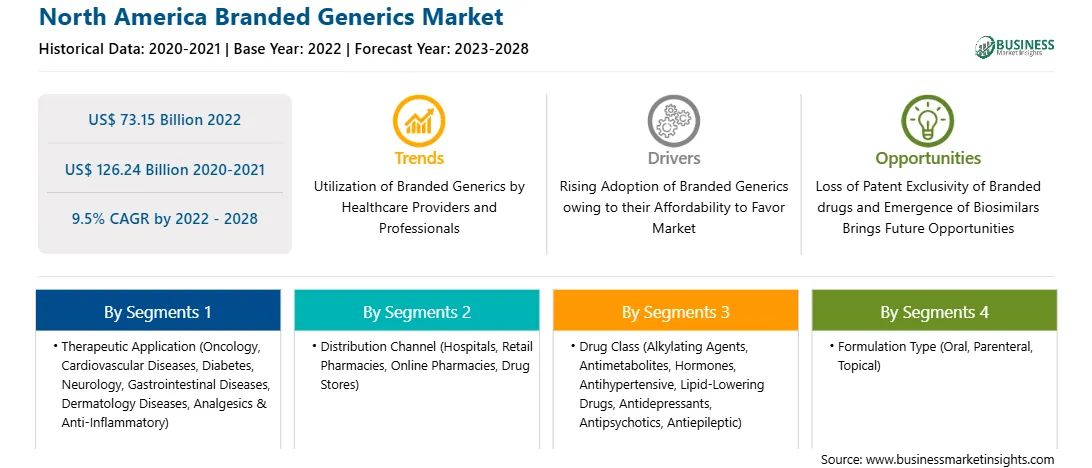
The branded generics market in North America is expected to grow from US$ 73.15 billion in 2022 to US$ 126.24 billion by 2028; it is estimated to grow at a CAGR of 9.5% from 2022 to 2028.


The increasing penetration of branded generics drives the growth of the North America branded generics market. According to a report by VOXEU, with healthcare budgets under pressure, switching to branded generics seems a natural cost saver. Branded generics are cheaper alternatives to branded medicines. Additionally, as per the data of FDA, more than 90% of the prescription in US were filled by generic drugs during year 2020. Further, according to the Association of the Accessible Medicine, in year 2020, the generic and biosimilar drugs saved US$ 338 billion in US. Moreover, healthcare expenditure grew by 9.7% during the same year in US and reached US$ 4.1 trillion. Further, a savings of US$ 2.2 trillion is observed in healthcare expenditure during the last decade in US due to the availability of low-cost generics.


Further, the Association for Accessible Medicines report states that nearly 4 billion generic prescriptions were dispensed in 2018. According to the HSRII report, the US is the largest pharmaceutical market in the world (US$ 325 billion), accounting for one-third of the overall pharmaceutical market, with generics accounting for 84% in terms of volume of sales and 28% in terms of sales value. Furthermore, branded generics utilization has increased among the population due to savings provided low cost alternatives and by the healthcare reimbursement system. On average, in 2019, the use of generic medicines saved US$ 93 billion in Medicare savings and US$ 48.5 billion in savings to Medicaid. Hence, the rising penetration of generics stimulates the growth of the overall branded generics market.


By introducing new features and technologies, vendors in the North America branded generics market can attract new customers and expand their footprints in emerging markets. This factor is likely to drive the market at a good CAGR during the forecast period.


North America Branded Generics Market Revenue and Forecast to 2028 (US$ Billion)


North America Branded Generics Market Segmentation


The North America branded generics market is segmented on the basis of therapeutic application, distribution channel, drug class, formulation type, and country. Based on therapeutic application, the market is segmented into oncology, cardiovascular diseases, diabetes, neurology, gastrointestinal diseases, dermatology diseases, and analgesics and anti-inflammatory. In 2022, the others segment holds the largest share of the market. The market, by distribution channel, is segmented into hospital pharmacies, retail pharmacies, online pharmacies, and drug stores. The retail pharmacies segment holds the largest share of the market in 2022. The North America branded generics market, based on drug class, is segmented into alkylating agents, antimetabolites, hormones, anti-hypertensive, lipid lowering drugs, anti-depressants, anti-psychotics, anti-epileptic, and others. The others segment holds the largest share of the market in 2022. The market, based on formulation type, is segmented into oral, parenteral, topical, and other. In 2022, the oral segment holds the largest share of the market. Based on country, the North America branded generics market is segmented into the US, Canada, and Mexico. The US holds the largest market share in 2022.


Aspen Holdings, AstraZeneca, Bausch Health (Valeant Pharmaceuticals), Dr. Reddy's Laboratories Inc., GlaxoSmithKline plc, Hetero, Lupin, MYLAN N.V., Par Pharmaceuticals, Sandoz International Gmbh, Sanofi, and TEVA PHARMACEUTICAL INDUSTRIES LTD. are among the leading companies in the branded generics market operating in this region.  

1.           Introduction

1.1         Study Scope

1.2         The Insight Partners Research Report Guidance

1.3         Market Segmentation

1.3.1        North America Branded Generics Market – By Therapeutic Application

1.3.2        North America Branded Generics Market – By Distribution Channel

1.3.3        North America Branded Generics Market – By Drug Class

1.3.4        North America Branded Generics Market – By Formulation Type

1.3.5        North America Branded Generics Market – By Country

2.           Key Takeaways

3.        Research Methodology

3.1         Coverage

3.2         Secondary Research

3.3         Primary Research

4.           North America Branded Generics Market – Market Landscape

4.1         Overview

4.2         North America PEST Analysis

4.3         Experts Opinion

5.           North America Branded Generics Market – Key Market Dynamics

5.1         Market Drivers

5.1.1        Increasing Penetration of Branded Generics

5.1.2        Surging Government Initiatives for Promoting Branded Generics

5.2         Market Restraints

5.2.1        Switching Brands, Poorer Clinical Outcomes and Adverse Effects of Generic Medications

5.3         Market Opportunities

5.3.1        Product Differentiation Creating Opportunities

5.4         Future Trends

5.4.1        Encouraging Utility of Branded Generics by Healthcare Providers and Professionals

5.5         Impact Analysis

6.           Branded Generics Market– North America Analysis

6.1         North America Branded Generics Market Revenue Forecast and Analysis

6.2         North America Branded Generics Market, By Country - Forecast and Analysis

7.           North America Branded Generics Market Revenue and Forecast To 2028– by Therapeutic Application

7.1         Overview

7.2         North America Branded Generics Market Revenue Share, By Therapeutic Application: Market Revenue and Forecast Analysis (US$ Billion)

7.3         Oncology

7.3.1        Overview

7.3.2        Oncology Market Revenue and Forecast to 2028 (US$ Billion)

7.4         Cardiovascular Diseases

7.4.1        Overview

7.4.2        Cardiovascular Diseases Market Revenue and Forecast to 2028 (US$ Billion)

7.5         Diabetes

7.5.1        Overview

7.5.2        Diabetes Market Revenue and Forecast to 2028 (US$ Billion)

7.6         Neurology

7.6.1        Overview

7.6.2        Neurology Market Revenue and Forecast to 2028 (US$ Billion)

7.7         Gastrointestinal Diseases

7.7.1        Overview

7.7.2        Gastrointestinal Diseases Market Revenue and Forecast to 2028 (US$ Billion)

7.8         Dermatology Diseases

7.8.1        Overview

7.8.2        Dermatology Diseases Market Revenue and Forecast to 2028 (US$ Billion)

7.9         Analgesics and Anti-Inflammatory

7.9.1        Overview

7.9.2        Analgesics and Anti-Inflammatory Market Revenue and Forecast to 2028 (US$ Billion)

7.10      Others

7.10.1     Overview

7.10.2     Others Market Revenue and Forecast to 2028 (US$ Billion)

8.           North America Branded Generics Market Analysis and Forecast to 2028 by Distribution Channel

8.1         North America Branded Generics Market Revenue Share, by Distribution Channel (2022 and 2028)

8.2         Hospital Pharmacies

8.2.1        Overview

8.2.2        Hospital Pharmacies: Branded Generics Market – Revenue and Forecast to 2028 (US$ Billion)

8.3         Retail Pharmacies

8.3.1        Overview

8.3.2        Retail Pharmacies: Branded Generics Market – Revenue and Forecast to 2028 (US$ Billion)

8.4         Online Pharmacies

8.4.1        Overview

8.4.2        Online Pharmacies: Branded Generics Market – Revenue and Forecast to 2028 (US$ Billion)

8.5         Drug Stores

8.5.1        Overview

8.5.2        Drug Stores: Branded Generics Market – Revenue and Forecast to 2028 (US$ Billion)

9.           North America Branded Generics Market Analysis and Forecast to 2028 by Drug Class

9.1         North America Branded Generics Market Revenue Share, by Drug Class (2022 and 2028)

9.2         Alkylating Agents

9.2.1        Overview

9.2.2        Alkylating Agents: Branded Generics Market – Revenue and Forecast to 2028 (US$ Billion)

9.3         Antimetabolites

9.3.1        Overview

9.3.2        Antimetabolites: Branded Generics Market – Revenue and Forecast to 2028 (US$ Billion)

9.4         Hormones

9.4.1        Overview

9.4.2        Hormones: Branded Generics Market – Revenue and Forecast to 2028 (US$ Billion)

9.5         Anti-hypertensive

9.5.1        Overview

9.5.2        Anti-hypertensive: Branded Generics Market – Revenue and Forecast to 2028 (US$ Billion)

9.6         Lipid Lowering Drugs

9.6.1        Overview

9.6.2        Lipid Lowering Drugs: Branded Generics Market – Revenue and Forecast to 2028 (US$ Billion)

9.7         Anti-Depressants

9.7.1        Overview

9.7.2        Anti-Depressants: Branded Generics Market – Revenue and Forecast to 2028 (US$ Billion)

9.8         Anti-psychotics

9.8.1        Overview

9.8.2        Anti-psychotics: Branded Generics Market – Revenue and Forecast to 2028 (US$ Billion)

9.9         Anti-epileptic

9.9.1        Overview

9.9.2        Anti-epileptic: Branded Generics Market – Revenue and Forecast to 2028 (US$ Billion)

9.10      Others

9.10.1     Overview

9.10.2     Others: Branded Generics Market – Revenue and Forecast to 2028 (US$ Billion)

10.        North America Branded Generics Market Analysis and Forecast to 2028 – by Formulation Type

10.1      Overview

10.2      North America Branded Generics Market Revenue Share, by Formulation Type (2022 and 2028)

10.3      Oral

10.3.1     Overview

10.3.2     Oral Market Revenue and Forecast to 2028 (US$ Billion)

10.4      Parenteral

10.4.1     Overview

10.4.2     Parenteral Market Revenue and Forecast to 2028 (US$ Billion)

10.5      Topical

10.5.1     Overview

10.5.2     Topical Market Revenue and Forecast to 2028 (US$ Billion)

10.6      Others

10.6.1     Overview

10.6.2     Others Market Revenue and Forecast to 2028 (US$ Billion)

11.        North America Branded Generics Market Revenue and Forecasts to 2028 Country Analysis

11.1      Overview

11.1.1     North America: Branded Generics Market, by Country, 2022 & 2028 (%)

11.1.1.1       US: Branded Generics Market – Revenue and Forecast to 2028 (US$ Billion)

11.1.1.1.1       Overview

11.1.1.1.2       US: Branded Generics Market – Revenue and Forecast to 2028 (US$ Billion)

11.1.1.1.3       US: Branded Generics Market, by Therapeutic Application, 2019–2028 (US$ Billion)

11.1.1.1.4       US: Branded Generics Market, by Distribution Channel, 2019–2028 (US$ Billion)

11.1.1.1.5       US: Branded Generics Market, by Drug Class, 2019–2028 (US$ Billion)

11.1.1.1.6       US: Branded Generics Market, by Formulation Type, 2019–2028 (US$ Billion)

11.1.1.2       Canada: Branded Generics Market – Revenue and Forecast to 2028 (US$ Billion)

11.1.1.2.1       Overview

11.1.1.2.2       Canada: Branded Generics Market – Revenue and Forecast to 2028 (US$ Billion)

11.1.1.2.3       Canada: Branded Generics Market, by Therapeutic Application, 2019–2028 (US$ Billion)

11.1.1.2.4       Canada: Branded Generics Market, by Distribution Channel, 2019–2028 (US$ Billion)

11.1.1.2.5       Canada: Branded Generics Market, by Drug Class, 2019–2028 (US$ Billion)

11.1.1.2.6       Canada: Branded Generics Market, by Formulation Type, 2019–2028 (US$ Billion)

11.1.1.3       Mexico: Branded Generics Market – Revenue and Forecast to 2028 (US$ Billion)

11.1.1.3.1       Overview

11.1.1.3.2       Mexico: Branded Generics Market – Revenue and Forecast to 2028 (US$ Billion)

11.1.1.3.3       Mexico: Branded Generics Market, by Therapeutic Application, 2019–2028 (US$ Billion)

11.1.1.3.4       Mexico: Branded Generics Market, by Distribution Channel, 2019–2028 (US$ Billion)

11.1.1.3.5       Mexico: Branded Generics Market, by Drug Class, 2019–2028 (US$ Billion)

11.1.1.3.6       Mexico: Branded Generics Market, by Formulation Type, 2019–2028 (US$ Billion)

12.        Branded Generics Market–Industry Landscape

12.1      Overview

12.2      Growth Strategies Done by the Companies in the Market (%)

12.3      Organic Developments

12.3.1     Overview

12.4      Inorganic Developments

12.4.1     Overview

13.        Company Profiles

13.1      MYLAN N.V.

13.1.1     Key Facts

13.1.2     Business Description

13.1.3     Products and Services

13.1.4     Financial Overview

13.1.5     SWOT Analysis

13.1.6     Key Developments

13.2      TEVA PHARMACEUTICAL INDUSTRIES LTD

13.2.1     Key Facts

13.2.2     Business Description

13.2.3     Products and Services

13.2.4     Financial Overview

13.2.5     SWOT Analysis

13.2.6     Key Developments

13.3      GlaxoSmithKline plc.

13.3.1     Key Facts

13.3.2     Business Description

13.3.3     Products and Services

13.3.4     Financial Overview

13.3.5     SWOT Analysis

13.3.6     Key Developments

13.4      Bausch Health Companies Inc.

13.4.1     Key Facts

13.4.2     Business Description

13.4.3     Products and Services

13.4.4     Financial Overview

13.4.5     SWOT Analysis

13.4.6     Key Developments

13.5      Lupin

13.5.1     Key Facts

13.5.2     Business Description

13.5.3     Products and Services

13.5.4     Financial Overview

13.5.5     SWOT Analysis

13.5.6     Key Developments

13.6      Sanofi

13.6.1     Key Facts

13.6.2     Business Description

13.6.3     Products and Services

13.6.4     Financial Overview

13.6.5     SWOT Analysis

13.6.6     Key Developments

13.7      ASTRAZENECA PLC.

13.7.1     Key Facts

13.7.2     Business Description

13.7.3     Products and Services

13.7.4     Financial Overview

13.7.5     SWOT Analysis

13.7.6     Key Developments

13.8      Dr. Reddy's Laboratories

13.8.1     Key Facts

13.8.2     Business Description

13.8.3     Products and Services

13.8.4     Financial Overview

13.8.5     SWOT Analysis

13.8.6     Key Developments

13.9      Par Pharmaceuticals, INC

13.9.1     Key Facts

13.9.2     Business Description

13.9.3     Products and Services

13.9.4     Financial Overview

13.9.5     SWOT Analysis

13.9.6     Key Developments

13.10   Sandoz International GMBH

13.10.1  Key Facts

13.10.2  Business Description

13.10.3  Products and Services

13.10.4  Financial Overview

13.10.5  SWOT Analysis

13.10.6  Key Developments

13.11   Aspen Holdings

13.11.1  Key Facts

13.11.2  Business Description

13.11.3  Products and Services

13.11.4  Financial Overview

13.11.5  SWOT Analysis

13.11.6  Key Developments

13.12   Hetero

13.12.1  Key Facts

13.12.2  Business Description

13.12.3  Products and Services

13.12.4  Financial Overview

13.12.5  SWOT Analysis

13.12.6  Key Developments

14.        Appendix

14.1      About The Insight Partners

14.2      Glossary of Terms


LIST OF TABLES

Table 1.             US Branded Generics Market, by Therapeutic Application – Revenue and Forecast to 2028 (US$ Billion)

Table 2.             US Branded Generics Market, by Distribution Channel– Revenue and Forecast to 2028 (US$ Billion)

Table 3.             US Branded Generics Market, by Drug Class – Revenue and Forecast to 2028 (US$ Billion)

Table 4.             US Branded Generics Market, by Formulation Type – Revenue and Forecast to 2028 (US$ Billion)

Table 5.             Canada: Branded Generics Market, by Therapeutic Application – Revenue and Forecast to 2028 (US$ Billion)

Table 6.             Canada Branded Generics Market, by Distribution Channel– Revenue and Forecast to 2028 (US$ Billion)

Table 7.             Canada Branded Generics Market, by Drug Class – Revenue and Forecast to 2028 (US$ Billion)

Table 8.             Canada Branded Generics Market, by Formulation Type – Revenue and Forecast to 2028 (US$ Billion)

Table 9.             Mexico: Branded Generics Market, by Therapeutic Application – Revenue and Forecast to 2028 (US$ Billion)

Table 10.          Mexico Branded Generics Market, by Distribution Channel– Revenue and Forecast to 2028 (US$ Billion)

Table 11.          Mexico Branded Generics Market, by Drug Class – Revenue and Forecast to 2028 (US$ Billion)

Table 12.          Mexico Branded Generics Market, by Formulation Type – Revenue and Forecast to 2028 (US$ Billion)

Table 13.          Organic Developments Done By Companies

Table 14.          Inorganic Developments Done By Companies

Table 15.          Glossary of Terms


LIST OF FIGURES

Figure 1.           North America Branded Generics Market Segmentation

Figure 2.           North America Branded Generics Market, By Country

Figure 3.           North America Branded Generics Market Overview

Figure 4.           Others Segment Held Largest Share of Drug Class Segment in North America Branded Generics Market

Figure 5.           Mexico is Expected to Show Remarkable Growth During the Forecast Period

Figure 6.           North America: PEST Analysis

Figure 7.           Experts Opinion

Figure 8.           Impact Analysis of Drivers and Restraints on North America Branded Generics Market

Figure 9.           North America Branded Generics Market – By Country Forecast and Analysis – 2019 - 2028

Figure 10.        North America Branded Generics Market Revenue Share, By Therapeutic Application: Market Analysis and Forecast 2022 and 2028 (%)

Figure 11.        North America Oncology Market Revenue and Forecast to 2028 (US$ Billion)

Figure 12.        North America Cardiovascular Diseases Market Revenue and Forecast to 2028 (US$ Billion)

Figure 13.        North America Diabetes Market Revenue and Forecast to 2028 (US$ Billion)

Figure 14.        North America Neurology Market Revenue and Forecast to 2028 (US$ Billion)

Figure 15.        North America Gastrointestinal Diseases Market Revenue and Forecast to 2028 (US$ Billion)

Figure 16.        North America Dermatology Diseases Market Revenue and Forecast to 2028 (US$ Billion)

Figure 17.        North America Analgesics and Anti-Inflammatory Market Revenue and Forecast to 2028 (US$ Billion)

Figure 18.        North America Others Market Revenue and Forecast to 2028 (US$ Billion)

Figure 19.        North America Branded Generics Market Revenue Share, by Distribution Channel (2022 and 2028)

Figure 20.        North America Hospital Pharmacies: Branded Generics Market – Revenue and Forecast to 2028 (US$ Billion)

Figure 21.        North America Retail Pharmacies: Branded Generics Market – Revenue and Forecast to 2028 (US$ Billion)

Figure 22.        North America Online Pharmacies: Branded Generics Market – Revenue and Forecast to 2028 (US$ Billion)

Figure 23.        North America Drug Stores: Branded Generics Market – Revenue and Forecast to 2028 (US$ Billion)

Figure 24.        North America Branded Generics Market Revenue Share, by Drug Class (2022 and 2028)

Figure 25.        North America Alkylating Agents: Branded Generics Market – Revenue and Forecast to 2028 (US$ Billion)

Figure 26.        North America Antimetabolites: Branded Generics Market – Revenue and Forecast to 2028 (US$ Billion)

Figure 27.        North America Hormones: Branded Generics Market – Revenue and Forecast to 2028 (US$ Billion)

Figure 28.        North America Anti-hypertensive: Branded Generics Market – Revenue and Forecast to 2028 (US$ Billion)

Figure 29.        North America Lipid Lowering Drugs: Branded Generics Market – Revenue and Forecast to 2028 (US$ Billion)

Figure 30.        North America Anti-Depressants: Branded Generics Market – Revenue and Forecast to 2028 (US$ Billion)

Figure 31.        North America Anti-psychotics: Branded Generics Market – Revenue and Forecast to 2028 (US$ Billion)

Figure 32.        North America Anti-epileptic: Branded Generics Market – Revenue and Forecast to 2028 (US$ Billion)

Figure 33.        North America Others: Branded Generics Market – Revenue and Forecast to 2028 (US$ Billion)

Figure 34.        North America Branded Generics Market Revenue Share, by Formulation Type (2022 and 2028)

Figure 35.        North America Oral Market Revenue and Forecast to 2028 (US$ Billion)

Figure 36.        North America Parenteral Market Revenue and Forecast to 2028 (US$ Billion)

Figure 37.        North America Topical Market Revenue and Forecast to 2028 (US$ Billion)

Figure 38.        North America Others Market Revenue and Forecast to 2028 (US$ Billion)

Figure 39.        North America: Branded Generics Market, by Key Country – Revenue (2022) (US$ Billion)

Figure 40.        North America: Branded Generics Market, by Country, 2022 & 2028 (%)

Figure 41.        US: Branded Generics Market – Revenue and Forecast to 2028 (US$ Billion)

Figure 42.        Canada: Branded Generics Market – Revenue and Forecast to 2028 (US$ Billion)

Figure 43.        Mexico: Branded Generics Market – Revenue and Forecast to 2028 (US$ Billion)

Figure 44.        Growth Strategies Done by the Companies in the Market (%)

  1. Aspen Holdings
  2. AstraZeneca
  3. Bausch Health (Valeant Pharmaceuticals)
  4. Dr. Reddy's Laboratories Inc.
  5. GlaxoSmithKline plc
  6. Hetero
  7. Lupin
  8. Mylan N.V.
  9. Par Pharmaceuticals
  10. Sandoz International Gmbh
  11. Sanofi
  12. Teva Pharmaceutical Industries Ltd.
  • Save and reduce time carrying out entry-level research by identifying the growth, size, leading players and segments in the North America branded generics market
  • Highlights key business priorities in order to assist companies to realign their business strategies
  • The key findings and recommendations highlight crucial progressive industry trends in the North America branded generics market, thereby allowing players across the value chain to develop effective long-term strategies
  • Develop/modify business expansion plans by using substantial growth offering developed and emerging markets
  • Scrutinize in-depth North America market trends and outlook coupled with the factors driving the branded generics market, as well as those hindering it
  • Enhance the decision-making process by understanding the strategies that underpin commercial interest with respect to client products, segmentation, pricing and distribution


Report Code
Full Name
Country Name
Email Id
Phone Number
Job Title
Company
Requirement

Note : Your data will never be shared with third parties, however, we may send you information from time to time about our products that may be of interest to you. By submitting your details, you agree to be contacted by us. You may contact us at any time to opt-out.


Purchase Options
Single User License
$3000
$2400
Site License
$4000
$3200
Enterprise License
$5000
$4000