Middle East & Africa Branded Generics Market Forecast to 2028 – COVID-19 Impact and Regional Analysis – by Therapeutic Application (Oncology, Cardiovascular Diseases, Diabetes, Neurology, Gastrointestinal Diseases, Dermatology Diseases, Analgesics & Anti-Inflammatory, and Others), Distribution Channel (Hospitals, Retail Pharmacies, Online Pharmacies, and Drug Stores), Drug Class (Alkylating Agents, Antimetabolites, Hormones, Antihypertensive, Lipid-Lowering Drugs, Antidepressants, Antipsychotics, Antiepileptic, and Others), and Formulation Type (Oral, Parenteral, Topical, and Others)
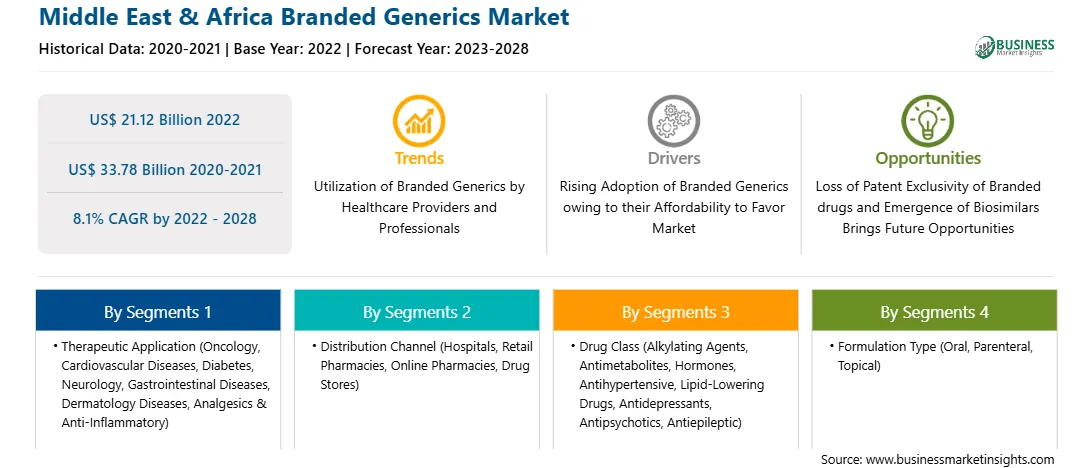
The branded generics market in the Middle East & Africa is expected to grow from US$ 21.12 billion in 2022 to US$ 33.78 billion by 2028; it is estimated to grow at a CAGR of 8.1% from 2022 to 2028.
Generic medicines play a vital role in offering cost-effective treatment. A report by NCBI states that generic medicines are equivalent to the patent product in terms of dosage form, strength, administration route, quality, safety, performance characteristics, and intended use. A redalyc.org report states that physicians, pharmacists, and patients are key stakeholders in ensuring the success of generic medicines. Also, pharmacists, who in major instances serve as the first point of contact for patients, act as an important source of information about generic drugs. Thus, the rising use of branded generics by healthcare providers and professionals bolsters the growth of the Middle East & Africa branded generics market.
By introducing new features and technologies, vendors in the Middle East & Africa branded generics market can attract new customers and expand their footprints in emerging markets. This factor is likely to drive the market at a good CAGR during the forecast period.
Middle East & Africa Branded Generics Market Revenue and Forecast to 2028 (US$ Billion)
Middle East & Africa Branded Generics Market Segmentation
Middle East & Africa branded generics market is segmented into therapeutic application, distribution channel, drug class, formulation type and country. The therapeutic application segment of the Middle East & Africa branded generics market is segmented into oncology, cardiovascular diseases, diabetes, neurology, gastrointestinal diseases, dermatology diseases, and analgesics and anti-inflammatory. In 2022, the others segment held the largest share of the market, by therapeutic application. The Middle East & Africa branded generics market, by distribution channel is hospital pharmacies, retail pharmacies, online pharmacies, and drug stores. The retail pharmacies segment is likely to hold the largest share of the market in 2022. The Middle East & Africa branded generics market, by drug class is segmented into alkylating agents, antimetabolites, hormones, anti-hypertensive, lipid lowering drugs, anti-depressants, anti-psychotics, anti-epileptic, and others. The others segment is likely to hold the largest share of the market in 2022. The Middle East & Africa branded generics market, based on formulation type is segmented into oral, parenteral, topical, and other. In 2022, the oral segment held the largest share of the market, by formulation type. Based on country, the Middle East & Africa branded generics market is segmented into Saudi Arabia, South Africa, UAE, and the Rest of Middle East & Africa. The Rest of MEA held the largest market share in 2022.
Aspen Holdings, AstraZeneca, Bausch Health (Valeant Pharmaceuticals), Dr. Reddy's Laboratories Inc., GlaxoSmithKline plc, Hetero, Lupin, Mylan N.V., Par Pharmaceuticals, Sandoz International Gmbh, Sanofi, and Teva Pharmaceutical Industries Ltd. are among the leading companies in the branded generics market operating in this region.
1. Introduction
1.1 Study Scope
1.2 The Insight Partners Research Report Guidance
1.3 Market Segmentation
1.3.1 MEA Branded Generics Market – By Therapeutic Application
1.3.2 MEA Branded Generics Market – By Distribution Channel
1.3.3 MEA Branded Generics Market – By Drug Class
1.3.4 MEA Branded Generics Market – By Formulation Type
1.3.5 MEA Branded Generics Market – By Country
2. Key Takeaways
3. Research Methodology
3.1 Coverage
3.2 Secondary Research
3.3 Primary Research
4. MEA Branded Generics Market – Market Landscape
4.1 Overview
4.2 MEA PEST Analysis
4.3 Experts Opinion
5. MEA Branded Generics Market – Key Market Dynamics
5.1 Market Drivers
5.1.1 Branded Generics Getting Popular
5.1.2 Increasing Government Initiatives for Promoting Branded Generics
5.2 Market Restraints
5.2.1 Switching Brands, Poorer Clinical Outcomes and Adverse Effects of Generic Medications
5.3 Market Opportunities
5.3.1 Product Differentiation
5.4 Future Trends
5.4.1 Encouraging Utility of Branded Generics by Healthcare Providers and Professionals
5.5 Impact Analysis
6. Branded Generics Market– MEA Analysis
6.1 MEA Branded Generics Market Revenue Forecast and Analysis
6.2 MEA Branded Generics Market, By Country - Forecast and Analysis
7. MEA Branded Generics Market Revenue and Forecast To 2028– by Therapeutic Application
7.1 Overview
7.2 MEA Branded Generics Market Revenue Share, By Therapeutic Application: Market Revenue and Forecast Analysis (US$ Billion)
7.3 Oncology
7.3.1 Overview
7.3.2 Oncology Market Revenue and Forecast to 2028 (US$ Billion)
7.4 Cardiovascular Diseases
7.4.1 Overview
7.4.2 Cardiovascular Diseases Market Revenue and Forecast to 2028 (US$ Billion)
7.5 Diabetes
7.5.1 Overview
7.5.2 Diabetes Market Revenue and Forecast to 2028 (US$ Billion)
7.6 Neurology
7.6.1 Overview
7.6.2 Neurology Market Revenue and Forecast to 2028 (US$ Billion)
7.7 Gastrointestinal Diseases
7.7.1 Overview
7.7.2 Gastrointestinal Diseases Market Revenue and Forecast to 2028 (US$ Billion)
7.8 Dermatology Diseases
7.8.1 Overview
7.8.2 Dermatology Diseases Market Revenue and Forecast to 2028 (US$ Billion)
7.9 Analgesics and Anti-Inflammatory
7.9.1 Overview
7.9.2 Analgesics and Anti-Inflammatory Market Revenue and Forecast to 2028 (US$ Billion)
7.10 Others
7.10.1 Overview
7.10.2 Others Market Revenue and Forecast to 2028 (US$ Billion)
8. MEA Branded Generics Market Analysis and Forecast to 2028 by Distribution Channel
8.1 MEA Branded Generics Market Revenue Share, by Distribution Channel (2022 and 2028)
8.2 Hospital Pharmacies
8.2.1 Overview
8.2.2 Hospital Pharmacies: Branded Generics Market – Revenue and Forecast to 2028 (US$ Billion)
8.3 Retail Pharmacies
8.3.1 Overview
8.3.2 Retail Pharmacies: Branded Generics Market – Revenue and Forecast to 2028 (US$ Billion)
8.4 Online Pharmacies
8.4.1 Overview
8.4.2 Online Pharmacies: Branded Generics Market – Revenue and Forecast to 2028 (US$ Billion)
8.5 Drug Stores
8.5.1 Overview
8.5.2 Drug Stores: Branded Generics Market – Revenue and Forecast to 2028 (US$ Billion)
9. MEA Branded Generics Market Analysis and Forecast to 2028 by Drug Class
9.1 MEA Branded Generics Market Revenue Share, by Drug Class (2022 and 2028)
9.2 Alkylating Agents
9.2.1 Overview
9.2.2 Alkylating Agents: Branded Generics Market – Revenue and Forecast to 2028 (US$ Billion)
9.3 Antimetabolites
9.3.1 Overview
9.3.2 Antimetabolites: Branded Generics Market – Revenue and Forecast to 2028 (US$ Billion)
9.4 Hormones
9.4.1 Overview
9.4.2 Hormones: Branded Generics Market – Revenue and Forecast to 2028 (US$ Billion)
9.5 Anti-hypertensive
9.5.1 Overview
9.5.2 Anti-hypertensive: Branded Generics Market – Revenue and Forecast to 2028 (US$ Billion)
9.6 Lipid Lowering Drugs
9.6.1 Overview
9.6.2 Lipid Lowering Drugs: Branded Generics Market – Revenue and Forecast to 2028 (US$ Billion)
9.7 Anti-Depressants
9.7.1 Overview
9.7.2 Anti-Depressants: Branded Generics Market – Revenue and Forecast to 2028 (US$ Billion)
9.8 Anti-psychotics
9.8.1 Overview
9.8.2 Anti-psychotics: Branded Generics Market – Revenue and Forecast to 2028 (US$ Billion)
9.9 Anti-epileptic
9.9.1 Overview
9.9.2 Anti-epileptic: Branded Generics Market – Revenue and Forecast to 2028 (US$ Billion)
9.10 Others
9.10.1 Overview
9.10.2 Others: Branded Generics Market – Revenue and Forecast to 2028 (US$ Billion)
10. MEA Branded Generics Market Analysis and Forecast to 2028 – by Formulation Type
10.1 Overview
10.2 MEA Branded Generics Market Revenue Share, by Formulation Type (2022 and 2028)
10.3 Oral
10.3.1 Overview
10.3.2 Oral Market Revenue and Forecast to 2028 (US$ Billion)
10.4 Parenteral
10.4.1 Overview
10.4.2 Parenteral Market Revenue and Forecast to 2028 (US$ Billion)
10.5 Topical
10.5.1 Overview
10.5.2 Topical Market Revenue and Forecast to 2028 (US$ Billion)
10.6 Others
10.6.1 Overview
10.6.2 Others Market Revenue and Forecast to 2028 (US$ Billion)
11. MEA Branded Generics Market Revenue and Forecasts to 2028 Country Analysis
11.1 Overview
11.1.1 MEA: Branded Generics Market, by Country, 2022 & 2028 (%)
11.1.1.1 UAE: Branded Generics Market Revenue and Forecast to 2028 (US$ Billion)
11.1.1.1.1 Overview
11.1.1.1.2 UAE: Branded Generics Market – Revenue and Forecast to 2028 (US$ Billion)
11.1.1.1.3 UAE: Branded Generics Market, by Therapeutic Application, 2019–2028 (US$ Billion)
11.1.1.1.4 UAE: Branded Generics Market, by Distribution Channel, 2019–2028 (US$ Billion)
11.1.1.1.5 UAE: Branded Generics Market, by Drug Class, 2019–2028 (US$ Billion)
11.1.1.1.6 UAE: Branded Generics Market, by Formulation Type, 2019–2028 (US$ Billion)
11.1.1.2 Saudi Arabia: Branded Generics Market Revenue and Forecast to 2028 (US$ Billion)
11.1.1.2.1 Overview
11.1.1.2.2 Saudi Arabia: Branded Generics Market – Revenue and Forecast to 2028 (US$ Billion)
11.1.1.2.3 Saudi Arabia: Branded Generics Market, by Therapeutic Application, 2019–2028 (US$ Billion)
11.1.1.2.4 Saudi Arabia: Branded Generics Market, by Distribution Channel, 2019–2028 (US$ Billion)
11.1.1.2.5 Saudi Arabia: Branded Generics Market, by Drug Class, 2019–2028 (US$ Billion)
11.1.1.2.6 Saudi Arabia: Branded Generics Market, by Formulation Type, 2019–2028 (US$ Billion)
11.1.1.3 South Africa: Branded Generics Market Revenue and Forecast to 2028 (US$ Billion)
11.1.1.3.1 Overview
11.1.1.3.2 South Africa: Branded Generics Market – Revenue and Forecast to 2028 (US$ Billion)
11.1.1.3.3 South Africa: Branded Generics Market, by Therapeutic Application, 2019–2028 (US$ Billion)
11.1.1.3.4 South Africa: Branded Generics Market, by Distribution Channel, 2019–2028 (US$ Billion)
11.1.1.3.5 South Africa: Branded Generics Market, by Drug Class, 2019–2028 (US$ Billion)
11.1.1.3.6 South Africa: Branded Generics Market, by Formulation Type, 2019–2028 (US$ Billion)
11.1.1.4 Rest of MEA: Branded Generics Market Revenue and Forecast to 2028 (US$ Billion)
11.1.1.4.1 Overview
11.1.1.4.2 Rest of MEA: Branded Generics Market – Revenue and Forecast to 2028 (US$ Billion)
11.1.1.4.3 Rest of MEA: Branded Generics Market, by Therapeutic Application, 2019–2028 (US$ Billion)
11.1.1.4.4 Rest of MEA: Branded Generics Market, by Distribution Channel, 2019–2028 (US$ Billion)
11.1.1.4.5 Rest of MEA: Branded Generics Market, by Drug Class, 2019–2028 (US$ Billion)
11.1.1.4.6 Rest of MEA: Branded Generics Market, by Formulation Type, 2019–2028 (US$ Billion)
12. Branded Generics Market–Industry Landscape
12.1 Overview
12.2 Growth Strategies Done by the Companies in the Market (%)
12.3 Organic Developments
12.3.1 Overview
12.4 Inorganic Developments
12.4.1 Overview
13. Company Profiles
13.1 MYLAN N.V.
13.1.1 Key Facts
13.1.2 Business Description
13.1.3 Products and Services
13.1.4 Financial Overview
13.1.5 SWOT Analysis
13.1.6 Key Developments
13.2 TEVA PHARMACEUTICAL INDUSTRIES LTD
13.2.1 Key Facts
13.2.2 Business Description
13.2.3 Products and Services
13.2.4 Financial Overview
13.2.5 SWOT Analysis
13.2.6 Key Developments
13.3 GlaxoSmithKline plc.
13.3.1 Key Facts
13.3.2 Business Description
13.3.3 Products and Services
13.3.4 Financial Overview
13.3.5 SWOT Analysis
13.3.6 Key Developments
13.4 Bausch Health Companies Inc.
13.4.1 Key Facts
13.4.2 Business Description
13.4.3 Products and Services
13.4.4 Financial Overview
13.4.5 SWOT Analysis
13.4.6 Key Developments
13.5 Lupin
13.5.1 Key Facts
13.5.2 Business Description
13.5.3 Products and Services
13.5.4 Financial Overview
13.5.5 SWOT Analysis
13.5.6 Key Developments
13.6 Sanofi
13.6.1 Key Facts
13.6.2 Business Description
13.6.3 Products and Services
13.6.4 Financial Overview
13.6.5 SWOT Analysis
13.6.6 Key Developments
13.7 ASTRAZENECA PLC.
13.7.1 Key Facts
13.7.2 Business Description
13.7.3 Products and Services
13.7.4 Financial Overview
13.7.5 SWOT Analysis
13.7.6 Key Developments
13.8 Dr. Reddy's Laboratories
13.8.1 Key Facts
13.8.2 Business Description
13.8.3 Products and Services
13.8.4 Financial Overview
13.8.5 SWOT Analysis
13.8.6 Key Developments
13.9 Par Pharmaceuticals, INC
13.9.1 Key Facts
13.9.2 Business Description
13.9.3 Products and Services
13.9.4 Financial Overview
13.9.5 SWOT Analysis
13.9.6 Key Developments
13.10 Sandoz International GMBH
13.10.1 Key Facts
13.10.2 Business Description
13.10.3 Products and Services
13.10.4 Financial Overview
13.10.5 SWOT Analysis
13.10.6 Key Developments
13.11 Aspen Holdings
13.11.1 Key Facts
13.11.2 Business Description
13.11.3 Products and Services
13.11.4 Financial Overview
13.11.5 SWOT Analysis
13.11.6 Key Developments
13.12 Hetero
13.12.1 Key Facts
13.12.2 Business Description
13.12.3 Products and Services
13.12.4 Financial Overview
13.12.5 SWOT Analysis
13.12.6 Key Developments
14. Appendix
14.1 About The Insight Partners
14.2 Glossary of Terms
LIST OF TABLES
Table 1. UAE Branded Generics Market, by Therapeutic Application – Revenue and Forecast to 2028 (US$ Billion)
Table 2. UAE Branded Generics Market, by Distribution Channel– Revenue and Forecast to 2028 (US$ Billion)
Table 3. UAE Branded Generics Market, by Drug Class – Revenue and Forecast to 2028 (US$ Billion)
Table 4. UAE Branded Generics Market, by Formulation Type – Revenue and Forecast to 2028 (US$ Billion)
Table 5. Saudi Arabia: Branded Generics Market, by Therapeutic Application – Revenue and Forecast to 2028 (US$ Billion)
Table 6. Saudi Arabia Branded Generics Market, by Distribution Channel– Revenue and Forecast to 2028 (US$ Billion)
Table 7. Saudi Arabia Branded Generics Market, by Drug Class – Revenue and Forecast to 2028 (US$ Billion)
Table 8. Saudi Arabia Branded Generics Market, by Formulation Type – Revenue and Forecast to 2028 (US$ Billion)
Table 9. South Africa: Branded Generics Market, by Therapeutic Application – Revenue and Forecast to 2028 (US$ Billion)
Table 10. South Africa Branded Generics Market, by Distribution Channel– Revenue and Forecast to 2028 (US$ Billion)
Table 11. South Africa Branded Generics Market, by Drug Class – Revenue and Forecast to 2028 (US$ Billion)
Table 12. South Africa Branded Generics Market, by Formulation Type – Revenue and Forecast to 2028 (US$ Billion)
Table 13. Rest of MEA: Branded Generics Market, by Therapeutic Application – Revenue and Forecast to 2028 (US$ Billion)
Table 14. Rest of MEA Branded Generics Market, by Distribution Channel– Revenue and Forecast to 2028 (US$ Billion)
Table 15. Rest of MEA Branded Generics Market, by Drug Class – Revenue and Forecast to 2028 (US$ Billion)
Table 16. Rest of MEA Branded Generics Market, by Formulation Type – Revenue and Forecast to 2028 (US$ Billion)
Table 17. Organic Developments Done By Companies
Table 18. Inorganic Developments Done By Companies
Table 19. Glossary of Terms
LIST OF FIGURES
Figure 1. MEA Branded Generics Market Segmentation
Figure 2. MEA Branded Generics Market, By Country
Figure 3. MEA Branded Generics Market Overview
Figure 4. Others Segment Held Largest Share of Drug Class Segment in MEA Branded Generics Market
Figure 5. Saud Arabia is Expected to Show Remarkable Growth During the Forecast Period
Figure 6. MEA: PEST Analysis
Figure 7. Experts Opinion
Figure 8. Impact Analysis of Drivers and Restraints on MEA Branded Generics Market
Figure 9. MEA Branded Generics Market – By Country Forecast and Analysis – 2019 - 2028
Figure 10. MEA Branded Generics Market Revenue Share, By Therapeutic Application: Market Analysis and Forecast 2022 and 2028 (%)
Figure 11. MEA Oncology Market Revenue and Forecast to 2028 (US$ Billion)
Figure 12. MEA Cardiovascular Diseases Market Revenue and Forecast to 2028 (US$ Billion)
Figure 13. MEA Diabetes Market Revenue and Forecast to 2028 (US$ Billion)
Figure 14. MEA Neurology Market Revenue and Forecast to 2028 (US$ Billion)
Figure 15. MEA Gastrointestinal Diseases Market Revenue and Forecast to 2028 (US$ Billion)
Figure 16. MEA Dermatology Diseases Market Revenue and Forecast to 2028 (US$ Billion)
Figure 17. MEA Analgesics and Anti-Inflammatory Market Revenue and Forecast to 2028 (US$ Billion)
Figure 18. MEA Others Market Revenue and Forecast to 2028 (US$ Billion)
Figure 19. MEA Branded Generics Market Revenue Share, by Distribution Channel (2022 and 2028)
Figure 20. MEA Hospital Pharmacies: Branded Generics Market – Revenue and Forecast to 2028 (US$ Billion)
Figure 21. MEA Retail Pharmacies: Branded Generics Market – Revenue and Forecast to 2028 (US$ Billion)
Figure 22. MEA Online Pharmacies: Branded Generics Market – Revenue and Forecast to 2028 (US$ Billion)
Figure 23. MEA Drug Stores: Branded Generics Market – Revenue and Forecast to 2028 (US$ Billion)
Figure 24. MEA Branded Generics Market Revenue Share, by Drug Class (2022 and 2028)
Figure 25. MEA Alkylating Agents: Branded Generics Market – Revenue and Forecast to 2028 (US$ Billion)
Figure 26. MEA Antimetabolites: Branded Generics Market – Revenue and Forecast to 2028 (US$ Billion)
Figure 27. MEA Hormones: Branded Generics Market – Revenue and Forecast to 2028 (US$ Billion)
Figure 28. MEA Anti-hypertensive: Branded Generics Market – Revenue and Forecast to 2028 (US$ Billion)
Figure 29. MEA Lipid Lowering Drugs: Branded Generics Market – Revenue and Forecast to 2028 (US$ Billion)
Figure 30. MEA Anti-Depressants: Branded Generics Market – Revenue and Forecast to 2028 (US$ Billion)
Figure 31. MEA Anti-psychotics: Branded Generics Market – Revenue and Forecast to 2028 (US$ Billion)
Figure 32. MEA Anti-epileptic: Branded Generics Market – Revenue and Forecast to 2028 (US$ Billion)
Figure 33. MEA Others: Branded Generics Market – Revenue and Forecast to 2028 (US$ Billion)
Figure 34. MEA Branded Generics Market Revenue Share, by Formulation Type (2022 and 2028)
Figure 35. MEA Oral Market Revenue and Forecast to 2028 (US$ Billion)
Figure 36. MEA Parenteral Market Revenue and Forecast to 2028 (US$ Billion)
Figure 37. MEA Topical Market Revenue and Forecast to 2028 (US$ Billion)
Figure 38. MEA Others Market Revenue and Forecast to 2028 (US$ Billion)
Figure 39. MEA: Branded Generics Market, by Key Country – Revenue (2022) (US$ Billion)
Figure 40. MEA: Branded Generics Market, by Country, 2022 & 2028 (%)
Figure 41. UAE: Branded Generics Market – Revenue and Forecast to 2028 (US$ Billion)
Figure 42. Saudi Arabia: Branded Generics Market – Revenue and Forecast to 2028 (US$ Billion)
Figure 43. South Africa: Branded Generics Market – Revenue and Forecast to 2028 (US$ Billion)
Figure 44. Rest of MEA: Branded Generics Market – Revenue and Forecast to 2028 (US$ Billion)
Figure 45. Growth Strategies Done by the Companies in the Market (%)
- Aspen Holdings
- AstraZeneca
- Bausch Health (Valeant Pharmaceuticals)
- Dr. Reddy's Laboratories Inc.
- GlaxoSmithKline plc
- Hetero
- Lupin
- Mylan N.V.
- Par Pharmaceuticals
- Sandoz International Gmbh
- Sanofi
- Teva Pharmaceutical Industries Ltd.
- Save and reduce time carrying out entry-level research by identifying the growth, size, leading players and segments in the Middle East & Africa branded generics market
- Highlights key business priorities in order to assist companies to realign their business strategies
- The key findings and recommendations highlight crucial progressive industry trends in the Middle East & Africa branded generics market, thereby allowing players across the value chain to develop effective long-term strategies
- Develop/modify business expansion plans by using substantial growth offering developed and emerging markets
- Scrutinize in-depth Middle East & Africa market trends and outlook coupled with the factors driving the branded generics market, as well as those hindering it
- Enhance the decision-making process by understanding the strategies that underpin commercial interest with respect to client products, segmentation, pricing and distribution