Middle East and Africa Float Glass Market Forecast to 2028 - COVID-19 Impact and Regional Analysis By Type (Clear Glass, Tinted Glass, Textured Glass, and Others) and Application (Automotive and Transportation, Building and Construction, Electronics, and Others)

TIPRE00027056 | Pages: 116 | Chemicals and Materials | Feb 2022 | Type: Regional | Status: Published

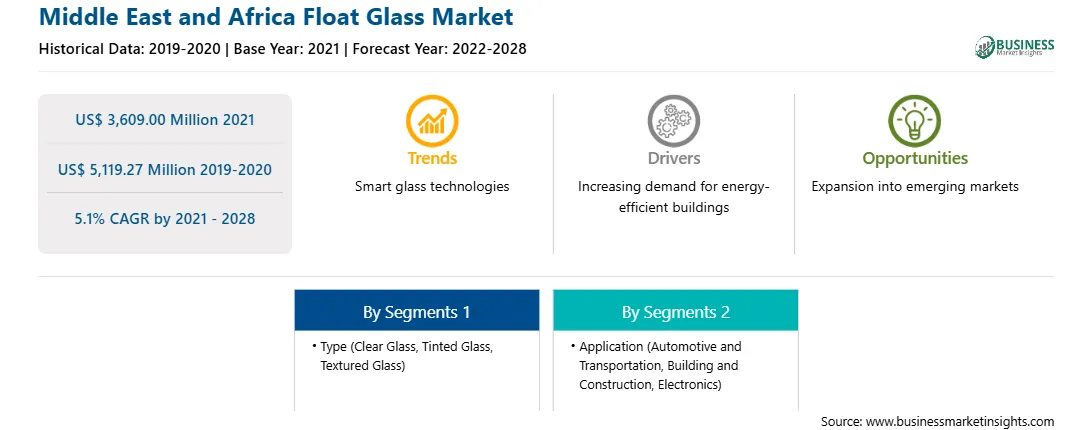
The MEA float glass market is expected to grow from US$ 3,609.00 million in 2021 to US$ 5,119.27 million by 2028; it is estimated to grow at a CAGR of 5.1% from 2021 to 2028.


In recent years, there have been various technological advancements. Also, there has been an increase in the trend of using float glass in the solar industry. The manufacturers are providing highly scalable and reliable float glass for the solar industry. For instance, AGC provides ultra-low-iron solar float glass with a highly robust and durable anti-reflecting coating. The company offers float glass of 2 mm to 4 mm front and rear panels for the latest glass-glass photovoltaic modules. Along with this, Pilkington provides Pilkington Optiwhite, a range of extra clear low iron float glass having high solar transmittance, providing improved solar energy conversion and consistent performance. The low iron float glass is ideal for thin-film photovoltaics, crystalline silicon photovoltaics, concentrated solar power technology, solar thermal collectors, and solar mirrors. Along with this, the manufacturers are focusing on establishing float glass manufacturing capacities for the solar industry. Thus, an increasing trend of using float glass in the solar industry is expected to drive the MEA market in the coming years. 


In case of COVID-19, MEA is highly affected especially South Africa, followed by Saudi Arabia and UAE, among others. UAE was the first country in MEA to report a confirmed case of COVID-19. The impact of lockdown in the Middle Eastern and African countries was that various chemicals & materials companies remained closed leading to the reduction in the sale of various products that negatively impacted the market for float glass in the region. The construction industry in the MEA is recovering post COVID-19; according to the RICS report, the 2021 Construction Activity Index (CAI) for the region posted a reading of +8 in Q2 compared to +3 in Q1, posting its strongest reading since Q2 2020. The infrastructure and private residential projects in the MEA are expected to gather momentum, while expectations are also slightly positive for the private non-residential sector. Thus, a recovering construction industry will have a positive impact on the float glass market.


With the new features and technologies, vendors can attract new customers and expand their footprints in emerging markets. This factor is likely to drive the MEA float glass market. The MEA float glass market is expected to grow at a good CAGR during the forecast period.   


MEA Float Glass Market Revenue and Forecast to 2028 (US$ Million)  


MEA Float Glass Market Revenue and Forecast to 2028 (US$ Million)  

Get more information on this report :

MEA Float Glass Market Segmentation        

MEA Float Glass Market – By Type

  • Clear Glass
  • Tinted Glass
  • Textured Glass
  • Others

MEA Float Glass Market – By Application

  •  Automotive and Transportation
  • Building and Construction
    • Residential
    • Commercial 
    • Industrial
  • Electronics
  • Others

MEA Float Glass Market, by Country

  • Saudi Arabia
  • South Africa
  • UAE
  • Rest of GCC
  • Rest of MEA

MEA Float Glass Market - Companies Mentioned

  • AGC Inc.
  • China Glass Holdings Limited
  • Guardian Industries Holdings
  • Nippon Sheet Glass Co., Ltd
  • SCHOTT AG 
  • Xinyi Glass Holdings Limited

1.           Introduction

1.1         Study Scope

1.2         The Insight Partners Research Report Guidance

1.3         Market Segmentation

2.           Key Takeaways

3.        Research Methodology

3.1         Scope of the Study

3.2         Research Methodology

3.2.1        Data Collection

3.2.2        Primary Interviews

3.2.3        Hypothesis Formulation

3.2.4        Macro-economic Factor Analysis

3.2.5        Developing Base Number

3.2.6        Data Triangulation

3.2.7        Country Level Data

4.           MEA Float Glass Market Landscape

4.1         Market Overview

4.2         Porter's Five Forces Analysis

4.3         Ecosystem Analysis

4.3.1        Raw Material:

4.3.2        Manufacturing/Process:

4.3.3        End Use:

4.4         Expert Opinion

5.           MEA Float Glass Market – Key Market Dynamics

5.1         Market Drivers

5.1.1        Surge in Demand from Building & Construction Industry

5.1.2        Escalating Preference for Float Glass in Electronic Industry

5.2         Market Restraints

5.2.1        Volatility in Prices of Raw Materials

5.3         Market Opportunities

5.3.1        Using Energy-Efficient and Sustainable Float Glass

5.4         Future Trends

5.4.1        Burgeoning Applications of Float Glass in Solar Industry

5.5         Impact Analysis of Drivers and Restraints

6.           Float Glass Market– MEA Analysis

6.1         MEA Market Overview

6.2         MEA Float Glass Market –Revenue and Forecast To 2028 (US$ Million)

7.           MEA Float Glass Market Analysis – By Type

7.1         Overview

7.2         MEA Float Glass Market, By Type (2020 and 2028)

7.3         Clear Glass

7.3.1        Overview

7.3.2        Clear Glass: Float Glass Market – Revenue and Forecast to 2028 (US$ Million)

7.4         Tinted Glass

7.4.1        Overview

7.4.2        Tinted Glass: Float Glass Market – Revenue and Forecast to 2028 (US$ Million)

7.5         Textured Glass

7.5.1        Overview

7.5.2        Textured Glass: Float Glass Market – Revenue and Forecast to 2028 (US$ Million)

7.6         Others

7.6.1        Overview

7.6.2        Others: Float Glass Market – Revenue and Forecast to 2028 (US$ Million)

8.           MEA Float Glass Market Analysis – By Application

8.1         Overview

8.2         MEA Float Glass Market, By Application (2020 and 2028)

8.3         Automotive and Transportation

8.3.1        Overview

8.3.2        Automotive and Transportation: Float Glass Market – Revenue and Forecast to 2028 (US$ Million)

8.4         Building and Construction

8.4.1        Overview

8.4.2        Building and Construction: Float Glass Market – Revenue and Forecast to 2028 (US$ Million)

8.4.3        Residential

8.4.3.1          Overview

8.4.3.2          Residential: Float Glass Market – Revenue and Forecast to 2028 (US$ Million)

8.4.4        Commercial

8.4.4.1          Overview

8.4.4.2          Commercial: Float Glass Market – Revenue and Forecast to 2028 (US$ Million)

8.4.5        Industrial

8.4.5.1          Overview

8.4.5.2          Industrial: Float Glass Market – Revenue and Forecast to 2028 (US$ Million)

8.5         Electronics

8.5.1        Overview

8.5.2        Electronics: Float Glass Market – Revenue and Forecast to 2028 (US$ Million)

8.6         Others

8.6.1        Overview

8.6.2        Others: Float Glass Market – Revenue and Forecast to 2028 (US$ Million)

9.           MEA Float Glass Market – Country Analysis

9.1         Overview

9.1.1        MEA: Float Glass Market, by Key Country

9.1.1.1          South Africa: Float Glass Market –Revenue and Forecast to 2028 (US$ Million)

9.1.1.1.1          South Africa: Float Glass Market, by Type

9.1.1.1.2          South Africa: Float Glass Market, by Application

9.1.1.1.3          South Africa: Float Glass Market, by Building and Construction

9.1.1.2          Saudi Arabia: Float Glass Market –Revenue and Forecast to 2028 (US$ Million)

9.1.1.2.1          Saudi Arabia: Float Glass Market, by Type

9.1.1.2.2          Saudi Arabia: Float Glass Market, by Application

9.1.1.2.3          Saudi Arabia: Float Glass Market, by Building and Construction

9.1.1.3          UAE: Float Glass Market –Revenue and Forecast to 2028 (US$ Million)

9.1.1.3.1          UAE: Float Glass Market, by Type

9.1.1.3.2          UAE: Float Glass Market, by Application

9.1.1.3.3          UAE: Float Glass Market, by Building and Construction

9.1.1.4          Rest of GCC: Float Glass Market –Revenue and Forecast to 2028 (US$ Million)

9.1.1.4.1          Rest of GCC: Float Glass Market, by Type

9.1.1.4.2          Rest of GCC: Float Glass Market, by Application

9.1.1.4.3          Rest of GCC: Float Glass Market, by Building and Construction

9.1.1.5          Rest of MEA: Float Glass Market –Revenue and Forecast to 2028 (US$ Million)

9.1.1.5.1          Rest of MEA: Float Glass Market, by Type

9.1.1.5.2          Rest of MEA: Float Glass Market, by Application

9.1.1.5.3          Rest of MEA: Float Glass Market, by Building and Construction

10.        Impact of COVID-19

10.1      MEA: Impact Assessment of COVID-19 Pandemic

11.        Industry Landscape

11.1      Overview

11.2      Market Initiative

11.3      New Product Development

12.        Company Profiles

12.1      AGC Inc.

12.1.1     Key Facts

12.1.2     Business Description

12.1.3     Products and Services

12.1.4     Financial Overview

12.1.5     SWOT Analysis

12.1.6     Key Developments

12.2      Nippon Sheet Glass Co., Ltd

12.2.1     Key Facts

12.2.2     Business Description

12.2.3     Products and Services

12.2.4     Financial Overview

12.2.5     SWOT Analysis

12.2.6     Key Developments

12.3      China Glass Holdings Limited

12.3.1     Key Facts

12.3.2     Business Description

12.3.3     Products and Services

12.3.4     Financial Overview

12.3.5     SWOT Analysis

12.3.6     Key Developments

12.4      Guardian Industries Holdings

12.4.1     Key Facts

12.4.2     Business Description

12.4.3     Products and Services

12.4.4     Financial Overview

12.4.5     SWOT Analysis

12.4.6     Key Developments

12.5      SCHOTT AG

12.5.1     Key Facts

12.5.2     Business Description

12.5.3     Products and Services

12.5.4     Financial Overview

12.5.5     SWOT Analysis

12.5.6     Key Developments

12.6      Xinyi Glass Holdings Limited

12.6.1     Key Facts

12.6.2     Business Description

12.6.3     Products and Services

12.6.4     Financial Overview

12.6.5     SWOT Analysis

12.6.6     Key Developments

13.        Appendix

13.1      About The Insight Partners

13.2      Glossary


LIST OF TABLES

Table 1.             MEA Float Glass Market –Revenue and Forecast To 2028 (US$ Million)

Table 2.             South Africa Float Glass Market, by Type – Revenue and Forecast to 2028 (US$ Million)

Table 3.             South Africa Float Glass Market, by Application – Revenue and Forecast to 2028 (US$ Million)

Table 4.             South Africa Float Glass Market, by Building and Construction– Revenue and Forecast to 2028 (US$ Million)

Table 5.             Saudi Arabia Float Glass Market, by Type – Revenue and Forecast to 2028 (US$ Million)

Table 6.             Saudi Arabia Float Glass Market, by Application – Revenue and Forecast to 2028 (US$ Million)

Table 7.             Saudi Arabia Float Glass Market, by Building and Construction – Revenue and Forecast to 2028 (US$ Million)

Table 8.             UAE Float Glass Market, by Type – Revenue and Forecast to 2028 (US$ Million)

Table 9.             UAE Float Glass Market, by Application – Revenue and Forecast to 2028 (US$ Million)

Table 10.          UAE Float Glass Market, by Building and Construction – Revenue and Forecast to 2028 (US$ Million)

Table 11.          Rest of GCC Float Glass Market, by Type – Revenue and Forecast to 2028 (US$ Million)

Table 12.          Rest of GCC Float Glass Market, by Application – Revenue and Forecast to 2028 (US$ Million)

Table 13.          Rest of GCC Float Glass Market, by Building and Construction– Revenue and Forecast to 2028 (US$ Million)

Table 14.          Rest of MEA Float Glass Market, by Type – Revenue and Forecast to 2028 (US$ Million)

Table 15.          Rest of MEA Float Glass Market, by Application – Revenue and Forecast to 2028 (US$ Million)

Table 16.          Rest of MEA Float Glass Market, by Building and Construction– Revenue and Forecast to 2028 (US$ Million)

Table 17.          Glossary of Terms


LIST OF FIGURES

Figure 1.           MEA Float Glass Market Segmentation

Figure 2.           MEA Float Glass Market Segmentation – By Country

Figure 3.           MEA Float Glass Market Overview

Figure 4.           Clear Glass Segment Held Largest Share of the Market in 2020

Figure 5.           South Africa Held Largest Share of the Market in 2020

Figure 6.           Porter's Five Forces Analysis

Figure 7.           MEA Float Glass Market, Ecosystem

Figure 8.           Expert Opinion

Figure 9.           MEA Float Glass Market Impact Analysis of Drivers and Restraints

Figure 10.        MEA: Float Glass Market – Revenue and Forecast To 2028 (US$ Million)

Figure 11.        MEA Float Glass Market Revenue Share, By Type (2020 and 2028)

Figure 12.        MEA Clear Glass: Float Glass Market – Revenue and Forecast To 2028 (US$ Million)

Figure 13.        MEA Tinted Glass: Float Glass Market – Revenue and Forecast To 2028 (US$ Million)

Figure 14.        MEA Textured Glass: Float Glass Market – Revenue and Forecast To 2028 (US$ Million)

Figure 15.        MEA Others: Float Glass Market – Revenue and Forecast To 2028 (US$ Million)

Figure 16.        MEA Float Glass Market Revenue Share, By Application (2020 and 2028)

Figure 17.        MEA Automotive and Transportation: Float Glass Market – Revenue and Forecast To 2028 (US$ Million)

Figure 18.        MEA Building and Construction: Float Glass Market – Revenue and Forecast To 2028 (US$ Million)

Figure 19.        MEA Residential: Float Glass Market – Revenue and Forecast To 2028 (US$ Million)

Figure 20.        MEA Commercial: Float Glass Market – Revenue and Forecast To 2028 (US$ Million)

Figure 21.        MEA Industrial: Float Glass Market – Revenue and Forecast To 2028 (US$ Million)

Figure 22.        MEA Electronics: Float Glass Market – Revenue and Forecast To 2028 (US$ Million)

Figure 23.        MEA Others: Float Glass Market – Revenue and Forecast To 2028 (US$ Million)

Figure 24.        MEA: Float Glass Market Revenue Overview, by Country (2020) (US$ Mn)

Figure 25.        MEA: Float Glass Market Revenue Share, by Key Country (2020 and 2028)

Figure 26.        South Africa: Float Glass Market –Revenue and Forecast to 2028 (US$ Million)

Figure 27.        Saudi Arabia: Float Glass Market –Revenue and Forecast to 2028 (US$ Million)

Figure 28.        UAE: Float Glass Market –Revenue and Forecast to 2028 (US$ Million)

Figure 29.        Rest of GCC: Float Glass Market –Revenue and Forecast to 2028 (US$ Million)

Figure 30.        Rest of MEA: Float Glass Market –Revenue and Forecast to 2028 (US$ Million)

Figure 31.        Impact of COVID-19 Pandemic on Float Glass in MEA

  1. AGC Inc.
  2. China Glass Holdings Limited
  3. Guardian Industries Holdings
  4. Nippon Sheet Glass Co., Ltd
  5. SCHOTT AG
  6. Xinyi Glass Holdings Limited
  • Save and reduce time carrying out entry-level research by identifying the growth, size, leading players, and segments in the MEA float glass market.      
  • Highlights key business priorities in order to assist companies to realign their business strategies
  • The key findings and recommendations highlight crucial progressive industry trends in the MEA float glass market, thereby allowing players across the value chain to develop effective long-term strategies
  • Develop/modify business expansion plans by using substantial growth offering developed and emerging markets
  • Scrutinize in-depth MEA market trends and outlook coupled with the factors driving the float glass market, as well as those hindering it
  • Enhance the decision-making process by understanding the strategies that underpin commercial interest with respect to client products, segmentation, pricing, and distribution    
Report Code
Full Name
Country Name
Email Id
Phone Number
Job Title
Company
Requirement

Note : Your data will never be shared with third parties, however, we may send you information from time to time about our products that may be of interest to you. By submitting your details, you agree to be contacted by us. You may contact us at any time to opt-out.


Purchase Options
Single User License
$3000
$1800
Site License
$4000
$2400
Enterprise License
$5000
$3000