Previsioni di mercato dell\'analisi della spesa per l\'elettronica e i semiconduttori nell\'Asia Pacifico fino al 2030 - Analisi regionale - per componente (software e servizi), tipo (analisi descrittiva, analisi predittiva e analisi prescrittiva), distribuzione (on-premise e cloud) e applicazione (finanziari). gestione, gestione del rischio, gestione della governance e della conformità, approvvigionamento dei fornitori e gestione delle prestazioni, previsione della domanda e dell\'offerta e altri)
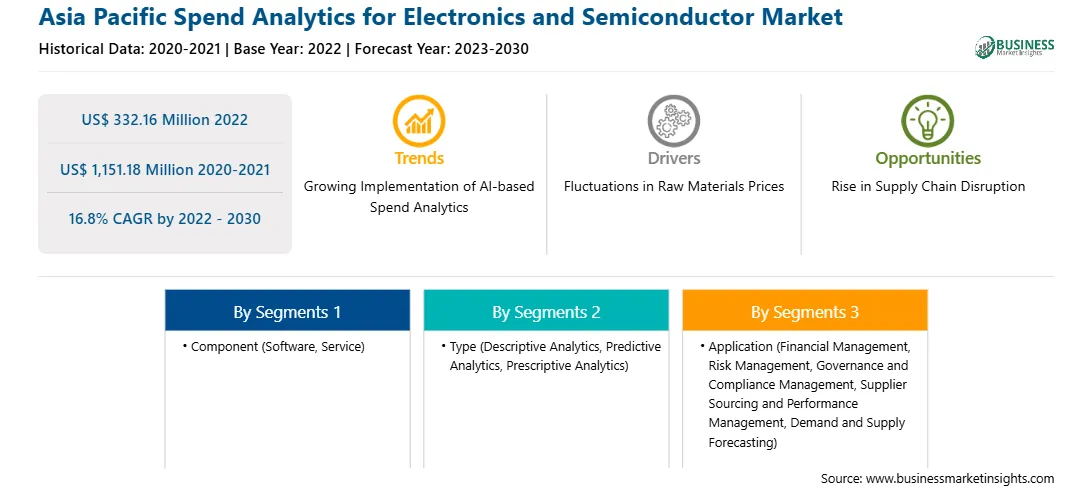
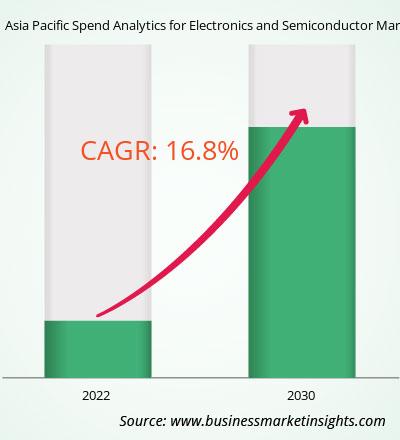
L’analisi della spesa dell’Asia Pacifico per il mercato dell’elettronica e dei semiconduttori è stata valutata a 332,16 milioni di dollari nel 2022 e si prevede che raggiungerà 1.151,18 milioni di dollari entro il 2030; si stima registrerà un CAGR del 16,8% dal 2022 al 2030.
L\'incorporazione di dispositivi elettronici miniaturizzati stimola l\'analisi della spesa dell\'Asia Pacifico per il mercato dell\'elettronica e dei semiconduttori.
La crescente incorporazione di dispositivi elettronici miniaturizzati, come microchip e sensori, richiede l\'uso dell\'analisi della spesa nel settore dell\'elettronica e dei semiconduttori. Le aziende devono gestire in modo efficace le proprie spese su componenti, materiali e processi di produzione per garantire il rapporto costo-efficacia. Lo sviluppo dell’elettronica digitale, compresa la riduzione dei prezzi dei microprocessori, l’aumento della capacità di memoria, il miglioramento dei sensori e i progressi nei pixel delle fotocamere digitali, può essere attribuito alla tendenza in corso alla miniaturizzazione. I circuiti integrati hanno avuto un profondo impatto sul campo dell\'elettronica, consentendo la miniaturizzazione dei dispositivi e funzionalità migliorate. La crescente adozione della tecnologia dei semiconduttori, unita alla necessità di miniaturizzazione e incorporazione di componenti elettronici, ha creato una domanda di analisi della spesa nel settore dell’elettronica e dei semiconduttori. Analizzando le spese per componenti, materiali e processi di produzione, le aziende possono identificare soluzioni per risparmiare sui costi, ottimizzare la catena di fornitura e garantire un rapporto costo-efficacia nella produzione di dispositivi elettronici miniaturizzati. Pertanto, si prevede che l’incorporazione di dispositivi elettronici miniaturizzati creerà opportunità per l’analisi della spesa per la crescita del mercato dell’elettronica e dei semiconduttori durante il periodo di previsione.
Panoramica del mercato dell\'analisi della spesa per l\'elettronica e dei semiconduttori nell\'area Asia Pacifico.
Si prevede che il mercato dell\'analisi della spesa per l\'elettronica e dei semiconduttori nell\'area Asia Pacifico registrerà una rapida crescita nei prossimi anni. Il progresso del mercato in questa regione può essere attribuito alla crescente accettazione degli strumenti di analisi da parte dei consumatori e delle imprese. Il settore dei big data e dell’analisi sta assistendo a una crescita significativa della spesa e dei ricavi nell’Asia del Pacifico. La regione dell\'Asia Pacifico sta assistendo a una crescente domanda di software di analisi della spesa, guidata dalla maggiore adozione di strumenti di analisi, dalla crescita dei settori dei big data e dell\'analisi e dalle esigenze specifiche di settori quali telecomunicazioni, banche, governo centrale, produzione discreta e servizi professionali. Cina, Giappone e India sono in prima linea nell’adozione dell’analisi della spesa nella regione, spinti dall’esplosione dei dati, dall’urbanizzazione, dallo sviluppo del machine learning e da molte MPMI. I principali attori nel settore dell\'elettronica e dei semiconduttori nell\'Asia del Pacifico includono Powerchip Semiconductor Manufacturing (PSMC), Taiwan Semiconductor Manufacturing Company (TSMC), United Microelectronics (UMC) e Vanguard International Semiconductor (VIS).
L\'adozione dell\'analisi della spesa consente alle organizzazioni del mercato dell\'elettronica e dei semiconduttori di ottimizzare i processi di acquisto e prendere decisioni di spesa ben informate. Analizzando i modelli di spesa, le organizzazioni possono identificare opportunità per ridurre i costi, gestire in modo efficace i fornitori e mitigare i rischi derivanti da interruzioni nella catena di fornitura. L’analisi della spesa è utile anche per affrontare le interruzioni della catena di fornitura, che sono diventate sempre più diffuse nell’Asia del Pacifico a causa delle minacce geopolitiche e di altri eventi globali. La recente carenza di semiconduttori che ha colpito il settore sottolinea la necessità di una migliore gestione della catena di approvvigionamento. Monitorando e analizzando attentamente i dati di spesa, le organizzazioni possono identificare fornitori alternativi, gestire efficacemente i costi e garantire una fornitura stabile di componenti elettronici e semiconduttori.
Analisi della spesa per l\'Asia Pacifico, entrate e previsioni del mercato per l\'elettronica e i semiconduttori fino al 2030 (milioni di dollari)
Analisi della spesa per l\'Asia Pacifico, segmentazione del mercato dell\'elettronica e dei semiconduttori
Asia Pacifico Il mercato dell’analisi della spesa per l’elettronica e i semiconduttori è segmentato in base a componente, tipo, implementazione, applicazione e paese. In base ai componenti, l’analisi della spesa dell’Asia Pacifico per il mercato dell’elettronica e dei semiconduttori è suddivisa in software e servizi. I servizi software detenevano una quota di mercato maggiore nel 2022.
In base alla tipologia, il mercato dell\'analisi della spesa per l\'elettronica e i semiconduttori dell\'Asia Pacifico è segmentato in analisi descrittiva, analisi predittiva e analisi prescrittiva. L\'analisi predittiva ha detenuto la quota di mercato maggiore nel 2022.
In base alla distribuzione, l\'analisi della spesa dell\'Asia Pacifico per il mercato dell\'elettronica e dei semiconduttori è biforcata in on-premise e cloud. Il cloud ha detenuto una quota di mercato maggiore nel 2022.
In base all\'applicazione, il mercato dell\'analisi della spesa dell\'Asia Pacifico per l\'elettronica e i semiconduttori è segmentato in gestione finanziaria, gestione del rischio, governance e gestione della conformità, approvvigionamento dei fornitori e gestione delle prestazioni, previsione della domanda e dell\'offerta e altri. Il sourcing dei fornitori e la gestione delle prestazioni hanno detenuto la quota di mercato maggiore nel 2022.
In base al paese, il mercato dell\'analisi della spesa dell\'Asia Pacifico per l\'elettronica e i semiconduttori è segmentato in Australia, Cina, India, Giappone, Corea del Sud e Resto dell\'Asia Pacifico. Nel 2022 la Cina ha dominato la quota di mercato dell\'analisi della spesa per l\'elettronica e i semiconduttori nell\'area Asia-Pacifico.
Coupa Software Inc, International Business Machines Corp, Ivalua Inc, NB Ventures Inc, SAP SE, Scanmarket AS, Synertrade Inc e Zycus Inc sono alcune delle aziende leader che operano nell\'area Asia-Pacifico per l\'analisi della spesa per il mercato dell\'elettronica e dei semiconduttori.
Asia Pacific Spend Analytics for Electronics and Semiconductor Strategic Insights
Strategic insights for Asia Pacific Spend Analytics for Electronics and Semiconductor involve closely monitoring industry trends, consumer behaviours, and competitor actions to identify opportunities for growth. By leveraging data analytics, businesses can anticipate market shifts and make informed decisions that align with evolving customer needs. Understanding these dynamics helps companies adjust their strategies proactively, enhance customer engagement, and strengthen their competitive edge. Building strong relationships with stakeholders and staying agile in response to changes ensures long-term success in any market.
Get more information on this report
Asia Pacific Spend Analytics for Electronics and Semiconductor Report Scope
Report Attribute
Details
Market size in 2022
US$ 332.16 Million
Market Size by 2030
US$ 1,151.18 Million
Global CAGR (2022 - 2030)
16.8%
Historical Data
2020-2021
Forecast period
2023-2030
Segments Covered
By Componente
Software
Servizio
By Tipo
Analisi descrittiva
Analisi predittiva
Analisi prescrittiva
By Applicazione
gestione finanziaria
gestione del rischio
governance e gestione della conformitÃ
approvvigionamento dei fornitori e gestione delle prestazioni
previsione della domanda e dell\'offerta
Regions and Countries Covered
Asia-Pacifico
Cina
India
Giappone
Australia
resto delAsia-Pacifico
Market leaders and key company profiles
Coupa Software Inc
International Business Machines Corp
Ivalua Inc
NB Ventures Inc
SAP SE
Scanmarket AS
Synertrade Inc
Zycus Inc
Get more information on this report
Asia Pacific Spend Analytics for Electronics and Semiconductor Regional Insights
The regional scope of Asia Pacific Spend Analytics for Electronics and Semiconductor refers to the geographical area in which a business operates and competes. Understanding regional nuances, such as local consumer preferences, economic conditions, and regulatory environments, is crucial for tailoring strategies to specific markets. Businesses can expand their reach by identifying underserved regions or adapting their offerings to meet regional demands. A clear regional focus allows for more effective resource allocation, targeted marketing, and better positioning against local competitors, ultimately driving growth in those specific areas.
Get more information on this report
Identical Market Reports with other Region/Countries
The List of Companies - Asia Pacific Spend Analytics for Electronics and Semiconductor Market
1. Coupa Software Inc 2. International Business Machines Corp 3. Ivalua Inc 4. NB Ventures Inc 5. SAP SE 6. Scanmarket AS 7. Synertrade Inc 8. Zycus Inc
Frequently Asked Questions
How big is the Asia Pacific Spend Analytics for Electronics and Semiconductor Market?
The Asia Pacific Spend Analytics for Electronics and Semiconductor Market is valued at US$ 332.16 Million in 2022, it is projected to reach US$ 1,151.18 Million by 2030.
What is the CAGR for Asia Pacific Spend Analytics for Electronics and Semiconductor Market by (2022 - 2030)?
As per our report Asia Pacific Spend Analytics for Electronics and Semiconductor Market, the market size is valued at US$ 332.16 Million in 2022, projecting it to reach US$ 1,151.18 Million by 2030. This translates to a CAGR of approximately 16.8% during the forecast period.
What segments are covered in this report?
The Asia Pacific Spend Analytics for Electronics and Semiconductor Market report typically cover these key segments-
Componente (Software, Servizio)
Tipo (Analisi descrittiva, Analisi predittiva, Analisi prescrittiva)
Applicazione (gestione finanziaria, gestione del rischio, governance e gestione della conformità, approvvigionamento dei fornitori e gestione delle prestazioni, previsione della domanda e dell\'offerta)
What is the historic period, base year, and forecast period taken for Asia Pacific Spend Analytics for Electronics and Semiconductor Market?
The historic period, base year, and forecast period can vary slightly depending on the specific market research report. However, for the Asia Pacific Spend Analytics for Electronics and Semiconductor Market report:
Historic Period : 2020-2021
Base Year : 2022
Forecast Period : 2023-2030
Who are the major players in Asia Pacific Spend Analytics for Electronics and Semiconductor Market?
The Asia Pacific Spend Analytics for Electronics and Semiconductor Market is populated by several key players, each contributing to its growth and innovation. Some of the major players include:
Coupa Software Inc
International Business Machines Corp
Ivalua Inc
NB Ventures Inc
SAP SE
Scanmarket AS
Synertrade Inc
Zycus Inc
Who should buy this report?
The Asia Pacific Spend Analytics for Electronics and Semiconductor Market report is valuable for diverse stakeholders, including:
Investors: Provides insights for investment decisions pertaining to market growth, companies, or industry insights. Helps assess market attractiveness and potential returns.
Industry Players: Offers competitive intelligence, market sizing, and trend analysis to inform strategic planning, product development, and sales strategies.
Suppliers and Manufacturers: Helps understand market demand for components, materials, and services related to concerned industry.
Researchers and Consultants: Provides data and analysis for academic research, consulting projects, and market studies.
Financial Institutions: Helps assess risks and opportunities associated with financing or investing in the concerned market.
Essentially, anyone involved in or considering involvement in the Asia Pacific Spend Analytics for Electronics and Semiconductor Market value chain can benefit from the information contained in a comprehensive market report.
Get Free Sample For Asia Pacific Spend Analytics for Electronics and Semiconductor Market
1. Complete the form
2. Check your inbox (and spam/junk folder)
3. Your Personal Data is Secure with us
GDPR + CCPA Compliant
Personal & transactional information is kept safe from unauthorized use.
WHAT'S INCLUDED IN FULL REPORT : Market Dynamics,
Competitive Analysis and Assessment, Define Business Strategies, Market Outlook and
Trends, Market Size and Share Analysis, Growth Driving Factors, Future Commercial
Potential, Identify Regional Growth Engines


 Get Free Sample For Asia Pacific Spend Analytics for Electronics and Semiconductor Market

