analysis - by Component (Software and Service), Type (Descriptive Analytics, Predictive Analytics, and Prescriptive Analytics), Deployment (On-Premise and Cloud), and Application (Financial Management, Risk Management, Governance and Compliance Management, Supplier Sourcing and Performance Management, Demand and Supply Forecasting, and Others)
No. of Pages:87
Report Code:
BMIRE00030524
Category:
Technology, Media and Telecommunications
North America Spend Analytics for Electronics and Semiconductor Market
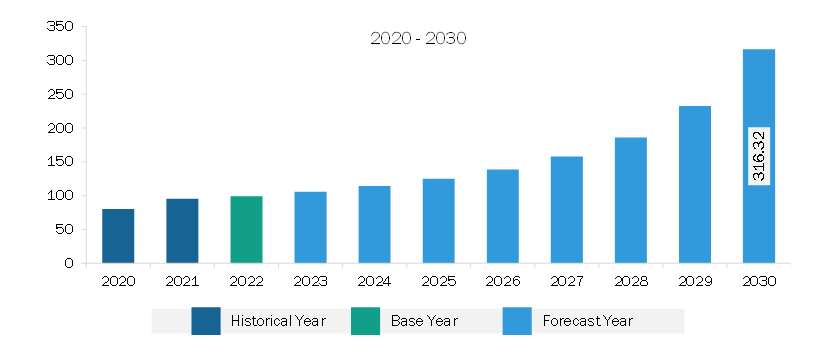
The North America spend analytics for electronics and semiconductor market was valued at US$ 99.13 million in 2022 and is expected to reach US$ 316.32 million by 2030; it is estimated to register a CAGR of 15.6% from 2022 to 2030.
Rise in Demand for Consumer Electronics Fuels North America Spend Analytics for Electronics and Semiconductor Market
The electronics and semiconductor market experienced a significant surge in demand for smartphones, tablets, wearable devices, and other consumer electronics. This increase in demand highlighted the necessity for spending analytics within the industry. As the consumer electronics market expanded, companies in this sector faced the challenge of efficiently managing their expenditures to maintain competitiveness and meet their customers' changing preferences. The adoption of spend analytics solutions became crucial as it provided valuable insights into spending patterns, identified opportunities for cost optimization, and facilitated informed decision-making to ensure companies remained adaptable and responsive in this fast-paced market. Also, spend analytics help companies streamline their procurement processes, identify potential areas for cost reduction, and strategically allocate resources to meet the growing demand for consumer electronics, which boosts the spend analytics for electronics and semiconductor market growth.
North America Spend Analytics for Electronics and Semiconductor Market Overview
The spend analytics for electronics and semiconductor market in North America is a well-established and mature one, exhibiting a high level of adoption and strong focus on leveraging analytics to optimize procurement processes as well as drive cost savings. Particularly, the US has significant presence in the global and North American spend analytics for electronics and semiconductor market. IBM Corporation, Lytica Inc, SAP, and Zycus are among the established players operating in the US that offer sophisticated analytics solutions tailored to the needs of their client organizations. These players have a deep understanding of the market dynamics and provide comprehensive analytics tools that allow businesses to gain valuable perceptions of their spending patterns and make informed decisions, further contributing to the growth of spend analytics for electronics and semiconductor market. In June 2023, Kearney, a global management consulting firm, led the investment round for Simfoni, raising the investment amount of ~US$ 8 million. Simfoni (based in San Francisco) provides solutions for spend analytics, e-sourcing, and tail spend management. This investment round, known as Series A-2, signifies Kearney's confidence and support in Simfoni's offerings and potential for growth in the spend analytics for electronics and semiconductor market.
North America Spend Analytics for Electronics and Semiconductor Market Revenue and Forecast to 2030 (US$ Million)
North America Spend Analytics for Electronics and Semiconductor Market Segmentation
The North America spend analytics for electronics and semiconductor market is segmented based on component, type, deployment, application, and country. Based on component, the North America spend analytics for electronics and semiconductor market is bifurcated into software and services. The software services held a larger market share in 2022.
Based on type, the North America spend analytics for electronics and semiconductor market is segmented into descriptive analytics, predictive analytics, and prescriptive analytics. The predictive analytics held the largest market share in 2022.
In terms of deployment, the North America spend analytics for electronics and semiconductor market is bifurcated into on-premise and cloud. The cloud held a larger market share in 2022.
By application, the North America spend analytics for electronics and semiconductor market is segmented into financial management, risk management, governance & compliance management, supplier sourcing & performance management, demand & supply forecasting, and others. The supplier sourcing & performance management held the largest market share in 2022.
Based on country, the North America spend analytics for electronics and semiconductor market is segmented into the US, Canada, and Mexico. The US dominated the North America spend analytics for electronics and semiconductor market share in 2022.
Coupa Software Inc, International Business Machines Corp, Ivalua Inc, Lytica Inc, NB Ventures Inc, SAP SE, Scanmarket AS, Synertrade Inc, and Zycus Inc are some of the leading companies operating in the North America spend analytics for electronics and semiconductor market.
North America Spend Analytics for Electronics and Semiconductor Market Strategic Insights
Get more information on this report
North America Spend Analytics for Electronics and Semiconductor Market Segmentation Analysis
North America Spend Analytics for Electronics and Semiconductor Market Report Highlights
North America Spend Analytics for Electronics and Semiconductor Report Scope
Report Attribute
Details
Market size in 2022
US$ 99.13 Million
Market Size by 2030
US$ 316.32 Million
CAGR (2022 - 2030)
15.6%
Historical Data
2020-2021
Forecast period
2023-2030
Segments Covered
By Component
Software
Service
By Type
Descriptive Analytics
Predictive Analytics
Prescriptive Analytics
By Application
Financial Management
Risk Management
Governance and Compliance Management
Supplier Sourcing and Performance Management
Demand and Supply Forecasting
Regions and Countries Covered
North America
US, Canada, Mexico
Market leaders and key company profiles
Coupa Software Inc
International Business Machines Corp.
Ivalua Inc.
Lytica Inc.
NB Ventures Inc.
SAP SE.
Scanmarket AS.
Synertrade Inc.
Zycus Inc.
Get more information on this report
North America Spend Analytics for Electronics and Semiconductor Market Country and Regional Insights
Get more information on this report
Identical Market Reports with other Region/Countries
The List of Companies - North America Spend Analytics for Electronics and Semiconductor Market
1. Coupa Software Inc2. International Business Machines Corp.3. Ivalua Inc.4. Lytica Inc.5. NB Ventures Inc.6. SAP SE.7. Scanmarket AS.8. Synertrade Inc.9. Zycus Inc.
Frequently Asked Questions
How big is the North America Spend Analytics for Electronics and Semiconductor Market?
The North America Spend Analytics for Electronics and Semiconductor Market is valued at US$ 99.13 Million in 2022, it is projected to reach US$ 316.32 Million by 2030.
What is the CAGR for North America Spend Analytics for Electronics and Semiconductor Market by (2022 - 2030)?
As per our report North America Spend Analytics for Electronics and Semiconductor Market, the market size is valued at US$ 99.13 Million in 2022, projecting it to reach US$ 316.32 Million by 2030. This translates to a CAGR of approximately 15.6% during the forecast period.
What segments are covered in this report?
The North America Spend Analytics for Electronics and Semiconductor Market report typically cover these key segments-
Component (Software, Service)
Type (Descriptive Analytics, Predictive Analytics, Prescriptive Analytics)
Application (Financial Management, Risk Management, Governance and Compliance Management, Supplier Sourcing and Performance Management, Demand and Supply Forecasting)
What is the historic period, base year, and forecast period taken for North America Spend Analytics for Electronics and Semiconductor Market?
The historic period, base year, and forecast period can vary slightly depending on the specific market research report. However, for the North America Spend Analytics for Electronics and Semiconductor Market report:
Historic Period : 2020-2021
Base Year : 2022
Forecast Period : 2023-2030
Who are the major players in North America Spend Analytics for Electronics and Semiconductor Market?
The North America Spend Analytics for Electronics and Semiconductor Market is populated by several key players, each contributing to its growth and innovation. Some of the major players include:
Coupa Software Inc
International Business Machines Corp.
Ivalua Inc.
Lytica Inc.
NB Ventures Inc.
SAP SE.
Scanmarket AS.
Synertrade Inc.
Zycus Inc.
Who should buy this report?
The North America Spend Analytics for Electronics and Semiconductor Market report is valuable for diverse stakeholders, including:
Investors: Provides insights for investment decisions pertaining to market growth, companies, or industry insights. Helps assess market attractiveness and potential returns.
Industry Players: Offers competitive intelligence, market sizing, and trend analysis to inform strategic planning, product development, and sales strategies.
Suppliers and Manufacturers: Helps understand market demand for components, materials, and services related to concerned industry.
Researchers and Consultants: Provides data and analysis for academic research, consulting projects, and market studies.
Financial Institutions: Helps assess risks and opportunities associated with financing or investing in the concerned market.
Essentially, anyone involved in or considering involvement in the North America Spend Analytics for Electronics and Semiconductor Market value chain can benefit from the information contained in a comprehensive market report.


 Get Free Sample For North America Spend Analytics for Electronics and Semiconductor Market


