Marktprognose für Öl- und Gassensoren im asiatisch-pazifischen Raum bis 2031 – Regionale Analyse – nach Typ (Drucksensor, Temperatursensor, Durchflusssensor und Füllstandssensor), Konnektivität (kabelgebunden und kabellos), Funktion (Fernüberwachung, Zustandsüberwachung und -wartung, Analyse und Simulation und andere) und Anwendung (Upstream, Midstream und Downstream)
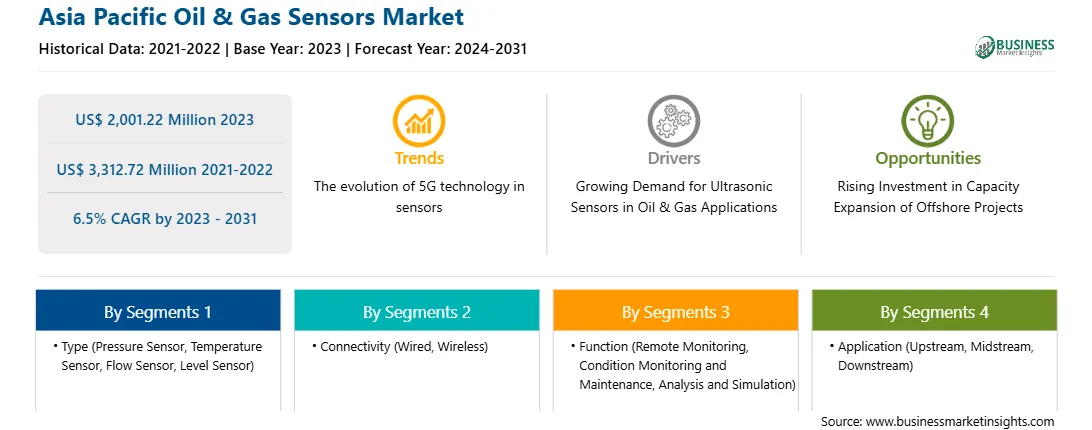
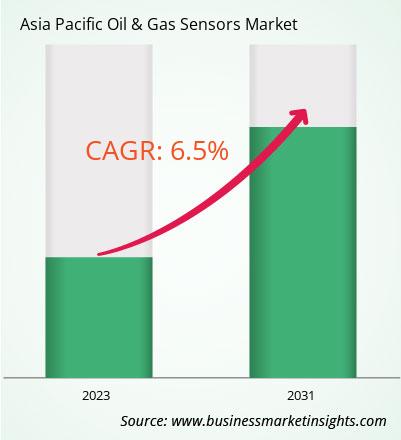
Der Markt für Öl- und Gassensoren im asiatisch-pazifischen Raum wurde im Jahr 2023 auf 2.001,22 Millionen US-Dollar geschätzt und soll bis 2031 3.312,72 Millionen US-Dollar erreichen; von 2023 bis 2031 wird eine durchschnittliche jährliche Wachstumsrate (CAGR) von 6,5 % geschätzt.
Steigende Investitionen in den Kapazitätsausbau von Offshore-Projekten kurbeln den Markt für Öl- und Gassensoren im asiatisch-pazifischen Raum an
Erneuerbare Offshore-Energien wie Offshore-Wind- und Meeresenergie haben das Potenzial, die globale Energiewende zu beschleunigen und gleichzeitig neue wirtschaftliche und soziale Möglichkeiten zu schaffen. Laut den jüngsten im Juni 2023 von der Internationalen Agentur für Erneuerbare Energien (IRENA) veröffentlichten Daten hat sich die Kapazität der Offshore-Windenergie um das 18-fache auf über 55 Gigawatt (GW) im Jahr 2022 erhöht, während die installierte Kapazität der Meeresenergie im Jahr 2021 0,535 GW betrug. Aufgrund steigender Investitionen in Meeresenergietechnologien können Offshore-Windenergie und Meeresenergie bis 2030 jeweils 380 GW bzw. 350 GW erzeugen. Dies erhöht die Nutzung von Öl- und Gassensoren bei den Nutzern, um die Wasserqualität zu überwachen, Ölverschmutzungen zu erkennen und die Auswirkungen von Offshore-Bohraktivitäten auf Öl- und Gasanwendungen zu bewerten. Darüber hinaus beflügeln wachsende Investitionen in Offshore-Projekte den Markt. Dies erhöht die Nachfrage und Nutzung von Temperatur-, Druck-, Durchfluss- und Füllstandssensoren zur Überwachung der Leistung und Integrität von Offshore-Windturbinen, Ölplattformen und Unterwasserpipelines.
Marktübersicht für Öl- und Gassensoren im asiatisch-pazifischen Raum
Der Markt für Temperatursensoren im asiatisch-pazifischen Raum wird im Prognosezeitraum voraussichtlich aufgrund des steigenden Verbrauchs von Rohöl, Biokraftstoffen und anderen Erdölflüssigkeiten in bemerkenswertem Tempo wachsen. Nach Angaben der US-Energieinformationsbehörde verzeichneten China und Indien im Jahr 2022 einen Ölverbrauch von 15,15 bzw. 5,05 Millionen Barrel pro Tag, was 15 % bzw. 5 % des weltweiten gesamten Ölverbrauchs entspricht. Unternehmen in China und Indien haben eine große Nachfrage nach Rohöl, das Strom und andere erneuerbare Energien umwandelt, was die Akteure des Öl- und Gasmarktes dazu ermutigt, ihre Produktionskapazität zu erhöhen. Darüber hinaus dürfte der wachsende Bedarf an Kapazitätserweiterungen für Öl- und Gasanlagen in den kommenden Jahren den Einsatz von Temperatursensoren, Drucksensoren, Durchflusssensoren und Ölsensoren vorantreiben. Sensoren werden strategisch in einer Produktionsanlage platziert, um eine Echtzeitüberwachung der Daten und Alarme zu gewährleisten.
Umsatz und Prognose für den Markt für Öl- und Gassensoren im asiatisch-pazifischen Raum bis 2031 (Mio. USD)
Segmentierung des Marktes für Öl- und Gassensoren im asiatisch-pazifischen Raum
Der Markt für Öl- und Gassensoren im asiatisch-pazifischen Raum ist nach Typ, Konnektivität, Funktion, Anwendung und Land kategorisiert.
Basierend auf dem Typ ist der Markt für Öl- und Gassensoren im asiatisch-pazifischen Raum in Drucksensor, Temperatursensor, Durchflusssensor und Füllstandssensor segmentiert. Das Segment Drucksensor hatte 2023 den größten Marktanteil.
In Bezug auf die Konnektivität ist der Markt für Öl- und Gassensoren im asiatisch-pazifischen Raum in kabelgebunden und kabellos unterteilt. Das kabelgebundene Segment hatte 2023 einen größeren Marktanteil.
Nach Funktion ist der Markt für Öl- und Gassensoren im asiatisch-pazifischen Raum in Fernüberwachung, Zustandsüberwachung und -wartung, Analyse und Simulation und andere segmentiert. Das Segment Fernüberwachung hatte 2023 den größten Marktanteil.
Nach Anwendung ist der Markt für Öl- und Gassensoren im asiatisch-pazifischen Raum in Upstream, Midstream und Downstream unterteilt. Das Upstream-Segment hatte 2023 den größten Marktanteil.
Nach Ländern ist der Markt für Öl- und Gassensoren im asiatisch-pazifischen Raum in Indien, China, Japan, Südkorea, Australien und den Rest des asiatisch-pazifischen Raums unterteilt. China dominierte 2023 den Marktanteil der Öl- und Gassensoren im asiatisch-pazifischen Raum.
Honeywell International Inc, TE Connectivity Ltd, Robert Bosch GmbH, ABB Ltd, Siemens AG, Rockwell Automation Inc, Analog Devices Inc, Emerson Electric Co, SKF AB und GE Vernova sind einige der führenden Unternehmen auf dem Markt für Öl- und Gassensoren im asiatisch-pazifischen Raum.
Asia Pacific Oil & Gas Sensors Strategic Insights
Strategic insights for Asia Pacific Oil & Gas Sensors involve closely monitoring industry trends, consumer behaviours, and competitor actions to identify opportunities for growth. By leveraging data analytics, businesses can anticipate market shifts and make informed decisions that align with evolving customer needs. Understanding these dynamics helps companies adjust their strategies proactively, enhance customer engagement, and strengthen their competitive edge. Building strong relationships with stakeholders and staying agile in response to changes ensures long-term success in any market.
Get more information on this report
Asia Pacific Oil & Gas Sensors Report Scope
Report Attribute
Details
Market size in 2023
US$ 2,001.22 Million
Market Size by 2031
US$ 3,312.72 Million
Global CAGR (2023 - 2031)
6.5%
Historical Data
2021-2022
Forecast period
2024-2031
Segments Covered
By Typ
Drucksensor
Temperatursensor
Durchflusssensor
Füllstandssensor
By Konnektivität
kabelgebunden
kabellos
By Funktion
Fernüberwachung
Zustandsüberwachung und Wartung
Analyse und Simulation
By Anwendung
Upstream
Midstream
Downstream
Regions and Countries Covered
Asien-Pazifik
China
Indien
Japan
Australien
Rest des Asien-Pazifik-Raums
Market leaders and key company profiles
ABB Ltd
Analog Devices Inc
Emerson Electric Co
GE Vernova
Honeywell International Inc
Robert Bosch GmbH
Rockwell Automation Inc
Siemens AG
SKF AB
TE Connectivity Ltd
Get more information on this report
Asia Pacific Oil & Gas Sensors Regional Insights
The regional scope of Asia Pacific Oil & Gas Sensors refers to the geographical area in which a business operates and competes. Understanding regional nuances, such as local consumer preferences, economic conditions, and regulatory environments, is crucial for tailoring strategies to specific markets. Businesses can expand their reach by identifying underserved regions or adapting their offerings to meet regional demands. A clear regional focus allows for more effective resource allocation, targeted marketing, and better positioning against local competitors, ultimately driving growth in those specific areas.
Get more information on this report
Identical Market Reports with other Region/Countries
The List of Companies - Asia Pacific Oil & Gas Sensors Market
ABB Ltd
Analog Devices Inc
Emerson Electric Co
GE Vernova
Honeywell International Inc
Robert Bosch GmbH
Rockwell Automation Inc
Siemens AG
SKF AB
TE Connectivity Ltd
Frequently Asked Questions
How big is the Asia Pacific Oil & Gas Sensors Market?
The Asia Pacific Oil & Gas Sensors Market is valued at US$ 2,001.22 Million in 2023, it is projected to reach US$ 3,312.72 Million by 2031.
What is the CAGR for Asia Pacific Oil & Gas Sensors Market by (2023 - 2031)?
As per our report Asia Pacific Oil & Gas Sensors Market, the market size is valued at US$ 2,001.22 Million in 2023, projecting it to reach US$ 3,312.72 Million by 2031. This translates to a CAGR of approximately 6.5% during the forecast period.
What segments are covered in this report?
The Asia Pacific Oil & Gas Sensors Market report typically cover these key segments-
Typ (Drucksensor, Temperatursensor, Durchflusssensor, Füllstandssensor)
Konnektivität (kabelgebunden, kabellos)
Funktion (Fernüberwachung, Zustandsüberwachung und Wartung, Analyse und Simulation)
What is the historic period, base year, and forecast period taken for Asia Pacific Oil & Gas Sensors Market?
The historic period, base year, and forecast period can vary slightly depending on the specific market research report. However, for the Asia Pacific Oil & Gas Sensors Market report:
Historic Period : 2021-2022
Base Year : 2023
Forecast Period : 2024-2031
Who are the major players in Asia Pacific Oil & Gas Sensors Market?
The Asia Pacific Oil & Gas Sensors Market is populated by several key players, each contributing to its growth and innovation. Some of the major players include:
ABB Ltd
Analog Devices Inc
Emerson Electric Co
GE Vernova
Honeywell International Inc
Robert Bosch GmbH
Rockwell Automation Inc
Siemens AG
SKF AB
TE Connectivity Ltd
Who should buy this report?
The Asia Pacific Oil & Gas Sensors Market report is valuable for diverse stakeholders, including:
Investors: Provides insights for investment decisions pertaining to market growth, companies, or industry insights. Helps assess market attractiveness and potential returns.
Industry Players: Offers competitive intelligence, market sizing, and trend analysis to inform strategic planning, product development, and sales strategies.
Suppliers and Manufacturers: Helps understand market demand for components, materials, and services related to concerned industry.
Researchers and Consultants: Provides data and analysis for academic research, consulting projects, and market studies.
Financial Institutions: Helps assess risks and opportunities associated with financing or investing in the concerned market.
Essentially, anyone involved in or considering involvement in the Asia Pacific Oil & Gas Sensors Market value chain can benefit from the information contained in a comprehensive market report.
Get Free Sample For Asia Pacific Oil & Gas Sensors Market
1. Complete the form
2. Check your inbox (and spam/junk folder)
3. Your Personal Data is Secure with us
GDPR + CCPA Compliant
Personal & transactional information is kept safe from unauthorized use.
WHAT'S INCLUDED IN FULL REPORT : Market Dynamics,
Competitive Analysis and Assessment, Define Business Strategies, Market Outlook and
Trends, Market Size and Share Analysis, Growth Driving Factors, Future Commercial
Potential, Identify Regional Growth Engines


 Get Free Sample For Asia Pacific Oil & Gas Sensors Market

