تقرير سوق البصريات الجميلة للتوصيل لمراكز البيانات في أمريكا الشمالية (2021-2031) حسب النطاق والتجزئة والديناميكيات والتحليل التنافسي
No. of Pages: 153 | Report Code: BMIRE00030706 | Category: Electronics and Semiconductor
No. of Pages: 153 | Report Code: BMIRE00030706 | Category: Electronics and Semiconductor
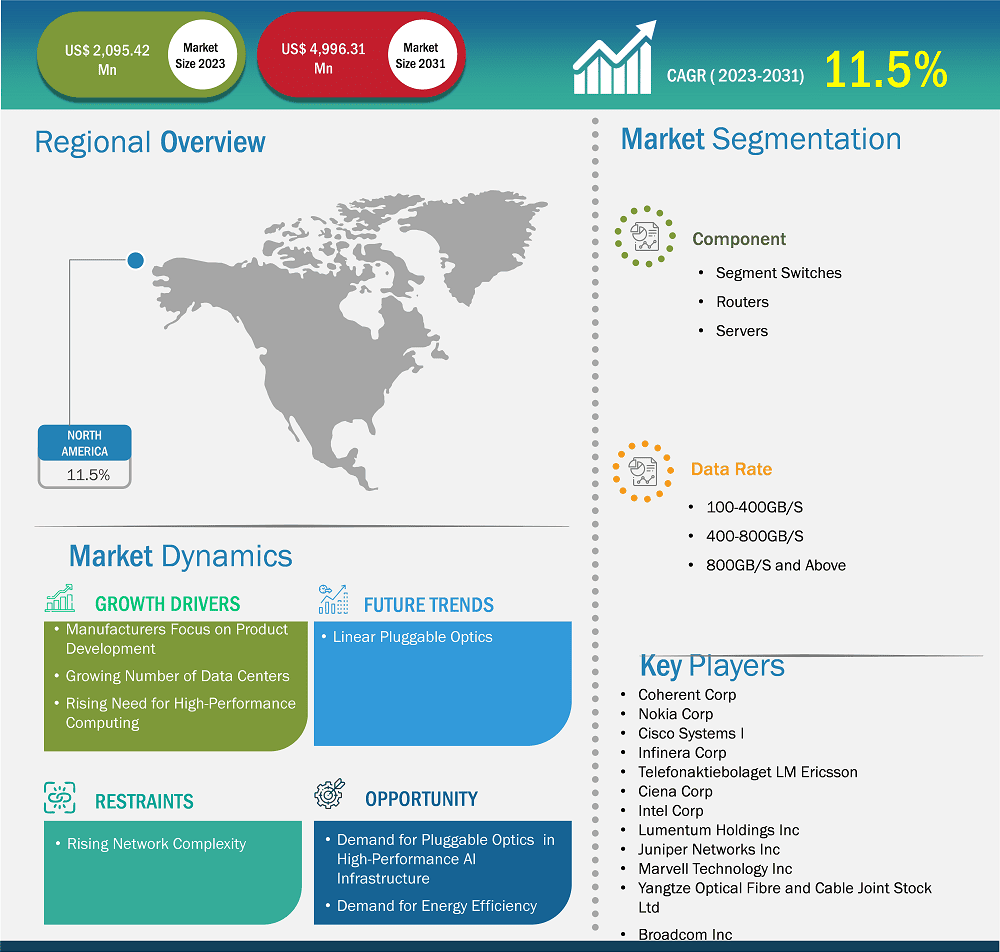
من المتوقع أن يصل حجم سوق البصريات القابلة للتوصيل لمراكز البيانات في أمريكا الشمالية إلى 4,996.31 مليون دولار أمريكي بحلول عام 2031 من 2,095.42 مليون دولار أمريكي في عام 2023. ومن المتوقع أن يسجل السوق معدل نمو سنوي مركب بنسبة 11.5٪ من عام 2023 إلى عام 2031.
في أمريكا الشمالية، يتزايد الطلب على توكوترينول بسبب التفضيل المتزايد لاستهلاك المغذيات الدوائية. وقد أدى التوسع السريع للتطبيقات كثيفة البيانات والحوسبة السحابية إلى زيادة كبيرة في عدد مراكز البيانات في أمريكا الشمالية، مما أدى إلى زيادة الطلب على البصريات القابلة للتوصيل. تتطلب مراكز البيانات هذه اتصالات بصرية عالية السرعة وموثوقة، مما يغذي الطلب على البصريات القابلة للتوصيل. تتيح هذه البصريات نقل البيانات بكفاءة وتلبية متطلبات النطاق الترددي المتزايدة باستمرار لمراكز البيانات المعاصرة. علاوة على ذلك، أدى ظهور الهواتف الذكية وأجهزة إنترنت الأشياء وخدمات البث إلى تدفق بيانات غير مسبوق. تدرك الشركات الآن الحاجة إلى نقل بيانات سلس وعالي الجودة. توفر البصريات القابلة للتوصيل السعة المطلوبة وقابلية التوسع لإدارة الارتفاع الحالي في حركة البيانات، مما يجعلها مكونًا أساسيًا في البنية التحتية لمركز البيانات. وعلاوة على ذلك، وفقًا لتحليل اتجاهات مراكز البيانات في أمريكا الشمالية لشركة CBRE، فإن أكبر سبع أسواق لمراكز البيانات بالجملة في أمريكا الشمالية تقع في الولايات المتحدة: شمال فيرجينيا، ودالاس/فورت وورث، ووادي السيليكون، وشيكاغو، وفينيكس، ومنطقة نيويورك الثلاثية، وأتلانتا.
من المتوقع أن يشهد سوق أمريكا الشمالية توسعًا ملحوظًا خلال فترة التوقعات نظرًا للطلب المتزايد على البصريات القابلة للتوصيل من قِبل مشغلي مراكز البيانات. يُشجع هذا الجهات الفاعلة في السوق على تطوير بصريات قابلة للتوصيل متطورة وعالية الأداء لتمكين عملائها من إضافة أو استبدال الوحدات البصرية بسهولة. على سبيل المثال، وفقًا لدراسة "البصريات القابلة للتوصيل المتماسكة: دراسة استقصائية واسعة النطاق لعام 2023"، تشير البيانات إلى أن مشغلي أمريكا الشمالية لديهم طلب أكبر على البصريات القابلة للتوصيل مقارنةً بنظرائهم في بقية العالم. ووفقًا للبحث، سيكون عامي 2025 و2026 حاسمين لاعتماد البصريات القابلة للتوصيل المتماسكة بسرعة 800 جيجابت، حيث يتوقع أكثر من نصف المشاركين نشرها خلال هذين العامين. وبالتالي، فإن الطلب المتزايد على البصريات القابلة للتوصيل بين مزودي الخدمات السحابية ومراكز البيانات الضخمة هو المحرك الرئيسي للسوق .

إن القطاعات الرئيسية التي ساهمت في اشتقاق تحليل سوق البصريات القابلة للتوصيل لمركز البيانات هي المكونات ومعدل البيانات.
يؤدي تزايد استخدام إنترنت الأشياء (IoT)، وتزايد الحاجة إلى تخزين كميات هائلة من البيانات، وتنامي الرقمنة، إلى زيادة الطلب على مراكز البيانات. تُعدّ مراكز البيانات حلاً ممتازًا لتخزين البيانات، حيث تُتيح للشركات وصولاً سريعًا وآمنًا إلى بيانات ضخمة. تُشجّع مزايا مراكز البيانات، مثل إدارة البيانات المركزية، وقابلية التوسع، والأمان، الشركات على اعتماد هذه الحلول لتحقيق بيئة أعمال قائمة على البيانات. ولذلك، تستثمر العديد من الشركات في تطوير مراكز البيانات في أمريكا الشمالية. ووفقًا لشركة Linklaters، حافظت أمريكا الشمالية على ريادتها في قيم معاملات مراكز البيانات، حيث استحوذت على نسبة 62% من الإجمالي العالمي في عام 2023، و69% من الاستثمارات حتى أبريل 2024، بإجمالي 15 مليار دولار أمريكي، حيث استحوذت الولايات المتحدة على الحصة الأكبر من الإجمالي. وفيما يلي بعض الأمثلة:
يتطلب بناء مراكز البيانات هذه وضمان تشغيلها بكفاءة تقنيات وأجهزة ومكونات متنوعة. تتيح تقنيات الألياف الضوئية أو الربط البصري نطاقًا واسعًا، وعرض نطاق ترددي، ومرونة، وكفاءة غير مسبوقة في مراكز البيانات الحديثة شديدة الترابط. وتُعدّ البصريات القابلة للتوصيل ضرورية لتوصيل مكونات الشبكة لتحويل الإشارات الكهربائية عالية السرعة إلى إشارات ضوئية، والعكس صحيح. وبالتالي، فإن العدد المتزايد لمراكز البيانات في أمريكا الشمالية يعزز الطلب على البصريات القابلة للتوصيل لهذه المراكز .
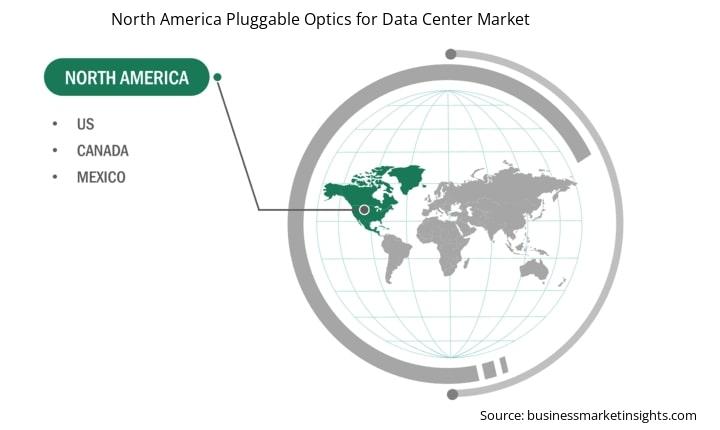
بحسب البلد، يشمل سوق البصريات القابلة للتوصيل لمراكز البيانات في أمريكا الشمالية الولايات المتحدة وكندا والمكسيك. وقد استحوذت الولايات المتحدة على الحصة الأكبر في عام ٢٠٢٣.
تضم الولايات المتحدة الأمريكية حوالي 2700 مركز بيانات. ويؤدي نمو مراكز البيانات الضخمة، التي تتطلب اتصالات عالية السرعة وموثوقة بين مختلف المكونات، إلى زيادة الطلب على البصريات القابلة للتوصيل. وتحتاج هذه المراكز إلى توسيع نطاق مواردها الحاسوبية لتلبية الطلب المتزايد على البيانات. وتحتضن ولاية فرجينيا الشمالية أكبر عدد من مراكز البيانات في الولايات المتحدة. وقد خصص أكثر من 300 مزود لخدمات السحابة ومراكز البيانات الضخمة، بما في ذلك أمازون ويب سيرفيسز ومايكروسوفت أزور وجوجل، ملايين الأقدام المربعة ومئات الميجاواط للمنطقة، وهم يواصلون التوسع. ومن المتوقع أن تمتلك ولاية فرجينيا الشمالية حوالي 3500 ميجاواط من مخزون مراكز البيانات، وهو ما يزيد عن ثلاثة أضعاف ما لدى أي سوق أمريكية أخرى.
لا يزال وادي السيليكون سوقًا قويًا لمراكز البيانات، مما يزيد الطلب على البصريات القابلة للتوصيل. تُعد منطقة خليج سان فرانسيسكو، وخاصةً سانتا كلارا، مركزًا رئيسيًا لشركات التكنولوجيا العملاقة والشركات الناشئة وشركات رأس المال الاستثماري نظرًا لانخفاض تكاليف الطاقة فيها. وتتخذ شركات مثل آبل وجوجل وإنتل وسيلزفورس وإنفيديا وفيسبوك/ميتا من هذه المنطقة مقرات رئيسية لها. علاوة على ذلك، فإن حاجة وادي السيليكون لمراكز البيانات مدفوعة برغبتها في التواجد بالقرب من موطنها ودعم الخدمات المبتكرة والرقمية التي يوفرها النظام البيئي التكنولوجي.
| سمة التقرير | تفاصيل |
|---|---|
| حجم السوق في عام 2023 | 2,095.42 مليون دولار أمريكي |
| حجم السوق بحلول عام 2031 | 4,996.31 مليون دولار أمريكي |
| معدل النمو السنوي المركب العالمي (2023 - 2031) | 11.5% |
| البيانات التاريخية | 2021-2022 |
| فترة التنبؤ | 2024-2031 |
| القطاعات المغطاة | حسب المكون
|
| المناطق والبلدان المغطاة | أمريكا الشمالية
|
| قادة السوق وملفات تعريف الشركات الرئيسية |
|
من بين أبرز الشركات العاملة في السوق: كوهيرنت، ونوكيا، وسيسكو سيستمز 1، وإنفينيرا، وتليفوناكتيبولاجيه إل إم إريكسون، وسيينا، وإنتل، ولومينتوم هولدينغز، وجونيبر نتووركس، ومارفيل تكنولوجي، وبرودكوم، وغيرها. وتتبنى هذه الشركات استراتيجيات متنوعة، مثل التوسع، وابتكار المنتجات، وعمليات الدمج والاستحواذ، لتوفير منتجات مبتكرة لعملائها وزيادة حصتها السوقية.
لقد تم إتباع المنهجية التالية لجمع وتحليل البيانات المقدمة في هذا التقرير:
تبدأ عملية البحث ببحث ثانوي شامل، باستخدام مصادر داخلية وخارجية لجمع بيانات نوعية وكمية لكل سوق. تشمل مصادر البحث الثانوية المُشار إليها عادةً، على سبيل المثال لا الحصر:
ملاحظة: جميع البيانات المالية الواردة في قسم "ملفات تعريف الشركة" مُوَحَّدة بالدولار الأمريكي. بالنسبة للشركات التي تُبلِّغ عن بياناتها بعملات أخرى، حُوِّلت الأرقام إلى الدولار الأمريكي باستخدام أسعار الصرف المعمول بها في السنة المالية المعنية.
تُجري Business Market Insights عددًا كبيرًا من المقابلات الأولية سنويًا مع أصحاب المصلحة والخبراء في القطاع للتحقق من صحة تحليل البيانات، والحصول على رؤى قيّمة. صُممت هذه المقابلات البحثية لتحقيق ما يلي:
يُجرى البحث الأساسي عبر البريد الإلكتروني والمقابلات الهاتفية، ويشمل أسواقًا وفئات وشرائح وشرائح فرعية متنوعة في مختلف المناطق. ويشمل المشاركون عادةً:

تقدر قيمة سوق البصريات القابلة للتوصيل لمركز البيانات في أمريكا الشمالية بـ 2،095.42 مليون دولار أمريكي في عام 2023، ومن المتوقع أن تصل إلى 4،996.31 مليون دولار أمريكي بحلول عام 2031.
وفقًا لتقريرنا حول سوق البصريات القابلة للتوصيل لمركز البيانات في أمريكا الشمالية، فإن حجم السوق يقدر بـ 2,095.42 مليون دولار أمريكي في عام 2023، ومن المتوقع أن يصل إلى 4,996.31 مليون دولار أمريكي بحلول عام 2031. وهذا يترجم إلى معدل نمو سنوي مركب يبلغ حوالي 11.5٪ خلال الفترة المتوقعة.
يغطي تقرير سوق البصريات القابلة للتوصيل لمركز البيانات في أمريكا الشمالية عادةً هذه القطاعات الرئيسية-
قد تختلف الفترة التاريخية، والسنة الأساسية، وفترة التنبؤ قليلاً تبعًا لتقرير بحث السوق المُحدد. ومع ذلك، بالنسبة لتقرير سوق البصريات القابلة للتوصيل لمراكز البيانات في أمريكا الشمالية:
الفترة التاريخية: 2021-2022السنة الأساسية: 2023الفترة المتوقعة: 2024-2031يضم سوق البصريات القابلة للتوصيل لمراكز البيانات في أمريكا الشمالية العديد من الجهات الفاعلة الرئيسية، حيث يُسهم كلٌّ منها في نموه وابتكاره. ومن بين هذه الجهات:
شركة Coherent Corp، وشركة Nokia Corp، وشركة Cisco Systems I، وشركة Infinera Corp، وشركة Telefonaktiebolaget LM Ericsson، وشركة Ciena Corp، وشركة Intel Corp، وشركة Lumentum Holdings Inc، وشركة Juniper Networks Inc، وشركة Marvell Technology Inc، وشركة Yangtze Optical Fibre and Cable Joint Stock Ltd، وشركة Broadcom Inc.يعد تقرير سوق البصريات القابلة للتوصيل لمركز البيانات في أمريكا الشمالية مفيدًا لمختلف أصحاب المصلحة، بما في ذلك:
في الأساس، يمكن لأي شخص مشارك أو يفكر في المشاركة في سلسلة قيمة سوق البصريات القابلة للتوصيل لمركز البيانات في أمريكا الشمالية الاستفادة من المعلومات الواردة في تقرير السوق الشامل.