Analysis - by Type (Power Discrete, Power Module, and Power IC), Material [Silicon (SI), Silicon Carbide (SIC), Gallium Nitride (GAN), and Others], and Industry Vertical (ICT, Automotive & Transportation, Consumer Electronics, Industrial, Energy & Power, and Others)
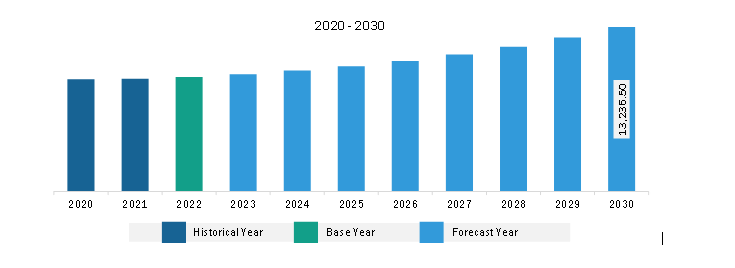
The Europe power electronics market was valued at US$ 9,217.70 million in 2022 and is expected to reach US$ 13,236.50 million by 2030; it is estimated to record a CAGR of 4.6% from 2022 to 2030.
Rising Demand for Power-efficient and High-energy Devices Drives Europe Power Electronics Market
Industrial appliances such as motor drives, power converters, UPSs, and server power supplies consume a large amount of power. Consequently, any improvement in industrial power supply efficiency will result in a significant drop in operating expenses for a business. The demand for high-efficiency power supplies is increasing across the globe due to their improved thermal performance and higher power density. Currently, uninterruptible power supplies are one of the most widely used applications for power semiconductors. Numerous hardware such as computers, communications equipment, data centers, and other electrical equipment are integrated with power semiconductors that protect them against unplanned power outages. The system used for uninterruptible power supplies typically consists of batteries and an IGBT (insulated-gate bipolar transistor) inverter, which have high voltage capabilities. This increases its adoption in high-current-density applications.
High-efficiency power sources are becoming increasingly necessary worldwide. Growing awareness related to efficient energy usage is creating demand for power semiconductors among consumers. Power semiconductors are also becoming an essential component to reduce the carbon footprint of society worldwide. Power semiconductors such as diodes, thyristors, and transistors are highly used for regulating electricity in automotive, consumer electronics, power, energy, ICT, and other industries. Thus, the rising demand for power-efficient and high-energy devices drives the power electronics market.
Europe Power Electronics Market Overview
The Europe power electronics market is segmented into Germany, Italy, France, Russia, the UK, and the Rest of Europe. The power electronics market in Europe is experiencing steady growth attributed to the rapid adoption of electric vehicles (EVs). EVs require high-performance power electronics systems for efficient power conversion, driving the demand for advanced components and technologies. Additionally, Europe's strong commitment to renewable energy sources such as wind and solar is fueling the demand for power electronics systems that can efficiently integrate these sources into the grid. Also, the increasing trend of industrial automation is creating opportunities for power electronics in areas such as robotics, motor drives, and process control.
Moreover, companies that can effectively address the key challenges and capitalize on the growth opportunities are expected to benefit from this dynamic market. A few of the leading companies operating in the power electronics market in Europe include Infineon Technologies, STMicroelectronics, NXP Semiconductors, Robert Bosch GmbH, ABB, Siemens AG, Mitsubishi Electric, Fuji Electric, and Yazaki Corporation. Therefore, the power electronics market in Europe is experiencing robust growth driven by various factors, with significant opportunities for further development in the coming years.
Europe Power Electronics Market Revenue and Forecast to 2030 (US$ Million)
Europe Power Electronics Market Segmentation
The Europe power electronics market is categorized into type, material, industry vertical, and country.
Based on type, the Europe power electronics market is categorized into power discrete, power module, and power IC. The power module segment held the largest market share in 2022.
In terms of material, the Europe power electronics market is categorized into Silicon (SI), Silicon Carbide (SIC), Gallium Nitride (GAN), and others. The Silicon Carbide (SIC) segment held the largest market share in 2022.
By industry vertical the Europe power electronics market is segmented into ICT, automotive & transportation, consumer electronics, industrial, energy & power, and others. The consumer electronics segment held the largest market share in 2022.
By country, the Europe power electronics market is segmented into Germany, France, Italy, the UK, Russia, and the Rest of Europe. The UK dominated the Europe power electronics market share in 2022.
Vishay Intertechnology Inc; Toshiba Electronic Devices & Storage Corp; Littelfuse, Inc; Renesas Electronics Corp; ROHM Co Lt; Fuji Electric Co Ltd; Mitsubishi Electric Corp; STMicroelectronics NV; Semiconductor Components Industries, L.L.C. (On Semiconductor); and Infineon Technologies AG are some of the leading companies operating in the Europe power electronics market.
Europe Power Electronics Market Strategic Insights
Get more information on this report
Europe Power Electronics Market Segmentation Analysis
Europe Power Electronics Market Report Highlights
Europe Power Electronics Report Scope
Report Attribute
Details
Market size in 2022
US$ 9,217.70 Million
Market Size by 2030
US$ 13,236.50 Million
CAGR (2022 - 2030)
4.6%
Historical Data
2020-2021
Forecast period
2023-2030
Segments Covered
By Type
Power Discrete
Power Module
Power IC
By Material
Silicon
Silicon Carbide
Gallium Nitride
Others
Regions and Countries Covered
Europe
UK, Germany, France, Russia, Italy, Rest of Europe
Market leaders and key company profiles
Infineon Technologies AG
Semiconductor components Industries, LLC
STMicroelectronics NV
Mitsubishi Electric Corp
Fuji Electric Co Ltd
ROHM Co Ltd
Renesas Electronics Corp
Littelfuse, Inc
Toshiba Electronics Devices & Storage Corp
Vishay Intertechnology Inc
Get more information on this report
Europe Power Electronics Market Country and Regional Insights
Get more information on this report
Identical Market Reports with other Region/Countries
The List of Companies - Europe Power Electronics Market
1. Infineon Technologies AG 2. Semiconductor components Industries, LLC 3. STMicroelectronics NV 4. Mitsubishi Electric Corp5. Fuji Electric Co Ltd 6. ROHM Co Ltd 7. Renesas Electronics Corp 8. Littelfuse, Inc 9. Toshiba Electronics Devices & Storage Corp 10. Vishay Intertechnology Inc
Frequently Asked Questions
How big is the Europe Power Electronics Market?
The Europe Power Electronics Market is valued at US$ 9,217.70 Million in 2022, it is projected to reach US$ 13,236.50 Million by 2030.
What is the CAGR for Europe Power Electronics Market by (2022 - 2030)?
As per our report Europe Power Electronics Market, the market size is valued at US$ 9,217.70 Million in 2022, projecting it to reach US$ 13,236.50 Million by 2030. This translates to a CAGR of approximately 4.6% during the forecast period.
What segments are covered in this report?
The Europe Power Electronics Market report typically cover these key segments-
Type (Power Discrete, Power Module, Power IC)
Material (Silicon, Silicon Carbide, Gallium Nitride, Others)
What is the historic period, base year, and forecast period taken for Europe Power Electronics Market?
The historic period, base year, and forecast period can vary slightly depending on the specific market research report. However, for the Europe Power Electronics Market report:
Historic Period : 2020-2021
Base Year : 2022
Forecast Period : 2023-2030
Who are the major players in Europe Power Electronics Market?
The Europe Power Electronics Market is populated by several key players, each contributing to its growth and innovation. Some of the major players include:
Infineon Technologies AG
Semiconductor components Industries, LLC
STMicroelectronics NV
Mitsubishi Electric Corp
Fuji Electric Co Ltd
ROHM Co Ltd
Renesas Electronics Corp
Littelfuse, Inc
Toshiba Electronics Devices & Storage Corp
Vishay Intertechnology Inc
Who should buy this report?
The Europe Power Electronics Market report is valuable for diverse stakeholders, including:
Investors: Provides insights for investment decisions pertaining to market growth, companies, or industry insights. Helps assess market attractiveness and potential returns.
Industry Players: Offers competitive intelligence, market sizing, and trend analysis to inform strategic planning, product development, and sales strategies.
Suppliers and Manufacturers: Helps understand market demand for components, materials, and services related to concerned industry.
Researchers and Consultants: Provides data and analysis for academic research, consulting projects, and market studies.
Financial Institutions: Helps assess risks and opportunities associated with financing or investing in the concerned market.
Essentially, anyone involved in or considering involvement in the Europe Power Electronics Market value chain can benefit from the information contained in a comprehensive market report.


 Get Free Sample For Europe Power Electronics Market


