Analysis - by Type (Power Discrete, Power Module, and Power IC), Material [Silicon (SI), Silicon Carbide (SIC), Gallium Nitride (GAN), and Others], and Industry Vertical (ICT, Automotive & Transportation, Consumer Electronics, Industrial, Energy & Power, and Others)
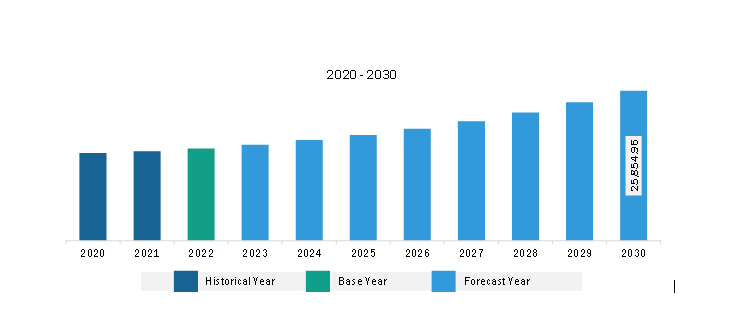
The Asia Pacific power electronics market was valued at US$ 15,845.77 million in 2022 and is expected to reach US$ 25,854.96 million by 2030; it is estimated to record a CAGR of 6.3% from 2022 to 2030.
Increasing Demand for AI-based Power Electronics Fuels Asia Pacific Power Electronics Market
Technological giants worldwide are highly focused on research and development of new technologies. Artificial intelligence (AI) is positioned as one of the major next-gen software technologies in the power electronics market. Artificial intelligence (AI) is transforming the way power electronics operate, especially in controlling the power quality cycle. Incorporating AI into power electronics helps businesses to streamline operations and automate tasks. For instance, in November 2020, Eneryield AB created an AI-based predictive method to control a wide range of power electronics.
AI-based power electronics are integrated with special machine-learning algorithms that allow huge amounts of data to be used to forecast the power quality over several cycles. AI allows power electronics to handle complex tasks such as signal measurement, power disturbance, and real-time monitoring. Further, power electronics use machine learning language-based components such as active power filters for monitoring the ongoing voltage and current signal attempts for predicting the power disturbance within a short time. The machine learning algorithm provides appropriate time for power electronics to pre-process the monitored signal, compute the prediction, and provide the prediction to the compensation device-which can then inject the opposite harmonics and interharmonics signal to mitigate the disturbance actively. Significant benefits offered by AI-based power electronics encourage manufacturers to integrate AI in power electronics.
In addition, AI-based power electronics help both manufacturers and consumers to control the electricity supply in the devices. Increasing demand for AI-based power electronics encourages companies to partner with each other to use and develop advanced solutions. For instance, in December 2023, Unipower AB announced a collaboration with Eneryield AB to develop AI-based power electronics for power grid applications. This collaboration helps Unipower AB use Eneryield AB's machine learning-based surveillance module in the power grids. The machine learning-based surveillance module helps Unipower AB predict faults in power grids, which can lead to better grid stability and supply security. Thus, the increasing demand for AI-based power electronics is anticipated to create lucrative opportunities for the power electronics market players during the forecast period.
Asia Pacific Power Electronics Market Overview
Asia Pacific is expected to lead the power electronics market with the highest CAGR over the forecast period. The significant presence of consumer electronics can be linked to the market's expansion in Asia Pacific.
The rising demand for power generation, as well as government attempts to support power generation in several Asia Pacific countries, are boosting the cost of power generation. Renewable energy infrastructure development is a critical factor driving the overall market. Moreover, the expanding population in developing countries, particularly China and India, which is increasing the deployment of communication infrastructure, is expected to fuel the market expansion for power electronics in the region during the forecast period. The presence of well-established power electronics market players such as Renesas Electronics Corporation, Mitsubishi Electric Corporation, Fuji Electric Co., and TOSHIBA CORPORATION in Asia Pacific boosts the market growth. Furthermore, the development of Chinese firms such as BYO, Huawei, CRRC, and Sungrow is strengthening the domestic power electronics sector in China. All these factors are driving the growth of the Asia Pacific power electronics market.
Asia Pacific Power Electronics Market Revenue and Forecast to 2030 (US$ Million)
Asia Pacific Power Electronics Market Segmentation
The Asia Pacific power electronics market is categorized into type, material, industry vertical, and country.
Based on type, the Asia Pacific power electronics market is categorized into power discrete, power module, and power IC. The power module segment held the largest market share in 2022.
In terms of material, the Asia Pacific power electronics market is categorized into Silicon (SI), Silicon Carbide (SIC), Gallium Nitride (GAN), and others. The Silicon Carbide (SIC) segment held the largest market share in 2022.
By industry vertical, the Asia Pacific power electronics market is segmented into ICT, automotive & transportation, consumer electronics, industrial, energy & power, and others. The consumer electronics segment held the largest market share in 2022.
By country, the Asia Pacific power electronics market is segmented into Australia, China, Japan, India, South Korea, and the Rest of Asia Pacific. China dominated the Asia Pacific power electronics market share in 2022.
Vishay Intertechnology Inc; Toshiba Electronic Devices & Storage Corp; Littelfuse, Inc; Renesas Electronics Corp; ROHM Co Lt; Fuji Electric Co Ltd; Mitsubishi Electric Corp; STMicroelectronics NV; Semiconductor Components Industries, L.L.C. (On Semiconductor); and Infineon Technologies AG are some of the leading companies operating in the Asia Pacific power electronics market.
Asia Pacific Power Electronics Market Strategic Insights
Get more information on this report
Asia Pacific Power Electronics Market Segmentation Analysis
Asia Pacific Power Electronics Market Report Highlights
Asia Pacific Power Electronics Report Scope
Report Attribute
Details
Market size in 2022
US$ 15,845.77 Million
Market Size by 2030
US$ 25,854.96 Million
CAGR (2022 - 2030)
6.3%
Historical Data
2020-2021
Forecast period
2023-2030
Segments Covered
By Type
Power Discrete
Power Module
Power IC
By Material
Silicon
Silicon Carbide
Gallium Nitride
Others
Regions and Countries Covered
Asia-Pacific
China, India, Japan, Australia, Rest of Asia-Pacific
Market leaders and key company profiles
Infineon Technologies AG
Semiconductor components Industries, LLC
STMicroelectronics NV
Mitsubishi Electric Corp
Fuji Electric Co Ltd
ROHM Co Ltd
Renesas Electronics Corp
Littelfuse, Inc
Toshiba Electronics Devices & Storage Corp
Vishay Intertechnology Inc
Get more information on this report
Asia Pacific Power Electronics Market Country and Regional Insights
Get more information on this report
Identical Market Reports with other Region/Countries
The List of Companies - Asia Pacific Power Electronics Market
1. Infineon Technologies AG 2. Semiconductor components Industries, LLC 3. STMicroelectronics NV 4. Mitsubishi Electric Corp5. Fuji Electric Co Ltd 6. ROHM Co Ltd 7. Renesas Electronics Corp 8. Littelfuse, Inc 9. Toshiba Electronics Devices & Storage Corp 10. Vishay Intertechnology Inc
Frequently Asked Questions
How big is the Asia Pacific Power Electronics Market?
The Asia Pacific Power Electronics Market is valued at US$ 15,845.77 Million in 2022, it is projected to reach US$ 25,854.96 Million by 2030.
What is the CAGR for Asia Pacific Power Electronics Market by (2022 - 2030)?
As per our report Asia Pacific Power Electronics Market, the market size is valued at US$ 15,845.77 Million in 2022, projecting it to reach US$ 25,854.96 Million by 2030. This translates to a CAGR of approximately 6.3% during the forecast period.
What segments are covered in this report?
The Asia Pacific Power Electronics Market report typically cover these key segments-
Type (Power Discrete, Power Module, Power IC)
Material (Silicon, Silicon Carbide, Gallium Nitride, Others)
What is the historic period, base year, and forecast period taken for Asia Pacific Power Electronics Market?
The historic period, base year, and forecast period can vary slightly depending on the specific market research report. However, for the Asia Pacific Power Electronics Market report:
Historic Period : 2020-2021
Base Year : 2022
Forecast Period : 2023-2030
Who are the major players in Asia Pacific Power Electronics Market?
The Asia Pacific Power Electronics Market is populated by several key players, each contributing to its growth and innovation. Some of the major players include:
Infineon Technologies AG
Semiconductor components Industries, LLC
STMicroelectronics NV
Mitsubishi Electric Corp
Fuji Electric Co Ltd
ROHM Co Ltd
Renesas Electronics Corp
Littelfuse, Inc
Toshiba Electronics Devices & Storage Corp
Vishay Intertechnology Inc
Who should buy this report?
The Asia Pacific Power Electronics Market report is valuable for diverse stakeholders, including:
Investors: Provides insights for investment decisions pertaining to market growth, companies, or industry insights. Helps assess market attractiveness and potential returns.
Industry Players: Offers competitive intelligence, market sizing, and trend analysis to inform strategic planning, product development, and sales strategies.
Suppliers and Manufacturers: Helps understand market demand for components, materials, and services related to concerned industry.
Researchers and Consultants: Provides data and analysis for academic research, consulting projects, and market studies.
Financial Institutions: Helps assess risks and opportunities associated with financing or investing in the concerned market.
Essentially, anyone involved in or considering involvement in the Asia Pacific Power Electronics Market value chain can benefit from the information contained in a comprehensive market report.


 Get Free Sample For Asia Pacific Power Electronics Market


