到 2025 年的北美视觉分析市场 - 按部署模型(本地和云)进行区域分析和预测;业务职能(销售和营销、运营、财务、供应链、信息技术、CRM 和人力资源);垂直行业(零售和消费品、IT 和电信、BFSI、制造业、能源和公用事业、医疗保健和政府)
No. of Pages: 132 | Report Code: TIPRE00005054 | Category: Technology, Media and Telecommunications
No. of Pages: 132 | Report Code: TIPRE00005054 | Category: Technology, Media and Telecommunications
Strategic insights for North America Visual Analytics involve closely monitoring industry trends, consumer behaviours, and competitor actions to identify opportunities for growth. By leveraging data analytics, businesses can anticipate market shifts and make informed decisions that align with evolving customer needs. Understanding these dynamics helps companies adjust their strategies proactively, enhance customer engagement, and strengthen their competitive edge. Building strong relationships with stakeholders and staying agile in response to changes ensures long-term success in any market.
| Report Attribute | Details |
|---|---|
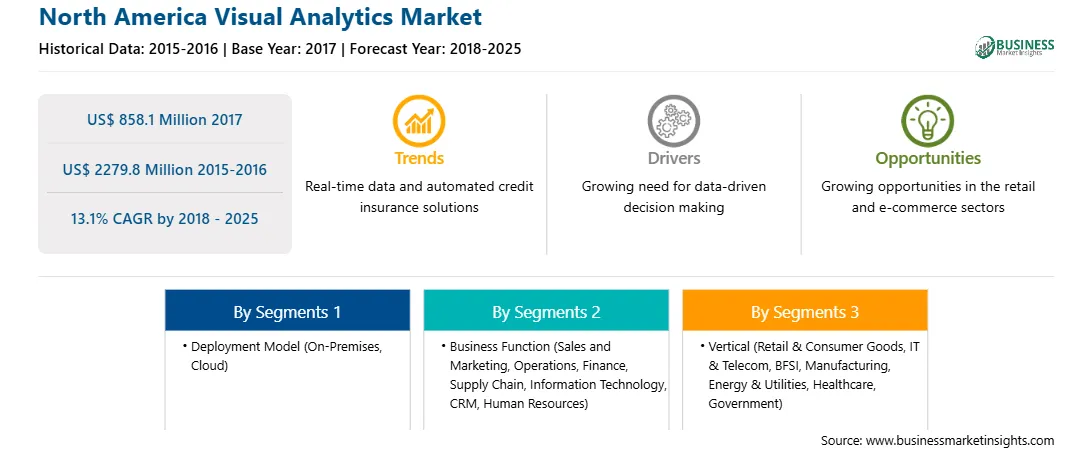
| Market size in 2017 | US$ 858.1 Million |
| Market Size by 2025 | US$ 2279.8 Million |
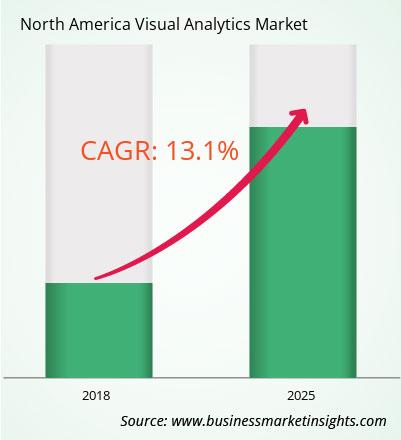
| Global CAGR (2018 - 2025) | 13.1% |
| Historical Data | 2015-2016 |
| Forecast period | 2018-2025 |
| Segments Covered |
By 部署模型
|
| Regions and Countries Covered | 北美
|
| Market leaders and key company profiles |
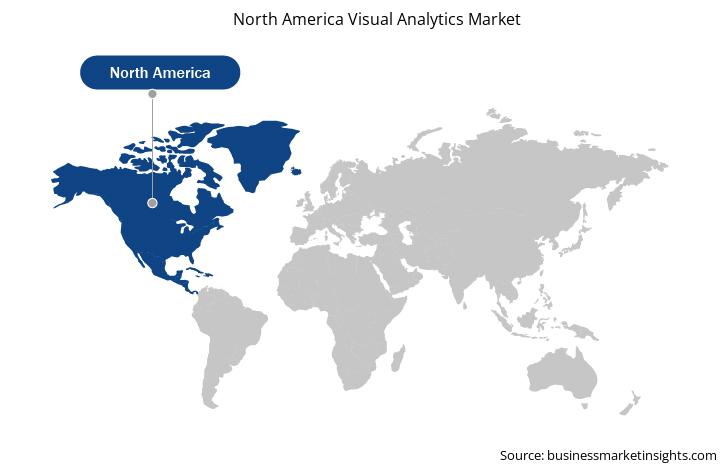
The regional scope of North America Visual Analytics refers to the geographical area in which a business operates and competes. Understanding regional nuances, such as local consumer preferences, economic conditions, and regulatory environments, is crucial for tailoring strategies to specific markets. Businesses can expand their reach by identifying underserved regions or adapting their offerings to meet regional demands. A clear regional focus allows for more effective resource allocation, targeted marketing, and better positioning against local competitors, ultimately driving growth in those specific areas.
The List of Companies
The North America Visual Analytics Market is valued at US$ 858.1 Million in 2017, it is projected to reach US$ 2279.8 Million by 2025.
As per our report North America Visual Analytics Market, the market size is valued at US$ 858.1 Million in 2017, projecting it to reach US$ 2279.8 Million by 2025. This translates to a CAGR of approximately 13.1% during the forecast period.
The North America Visual Analytics Market report typically cover these key segments-
The historic period, base year, and forecast period can vary slightly depending on the specific market research report. However, for the North America Visual Analytics Market report:
The North America Visual Analytics Market is populated by several key players, each contributing to its growth and innovation. Some of the major players include:
The North America Visual Analytics Market report is valuable for diverse stakeholders, including:
Essentially, anyone involved in or considering involvement in the North America Visual Analytics Market value chain can benefit from the information contained in a comprehensive market report.
E 1803, Panchshil Towers, Vagholi, Haveli, Pune- 412207, Maharashtra, India
US:+16467917070
sales@businessmarketinsights.com


 Get Free Sample For North America Visual Analytics Market
