北美地热发电市场预测至 2031 年 - 区域分析 - 按工厂类型(直接干蒸汽、闪蒸汽和二元循环)和最终用户(住宅、商业和工业)

BMIRE00031015 | Pages: 82 | Energy and Power | Nov 2024 | Type: Regional | Status: Published
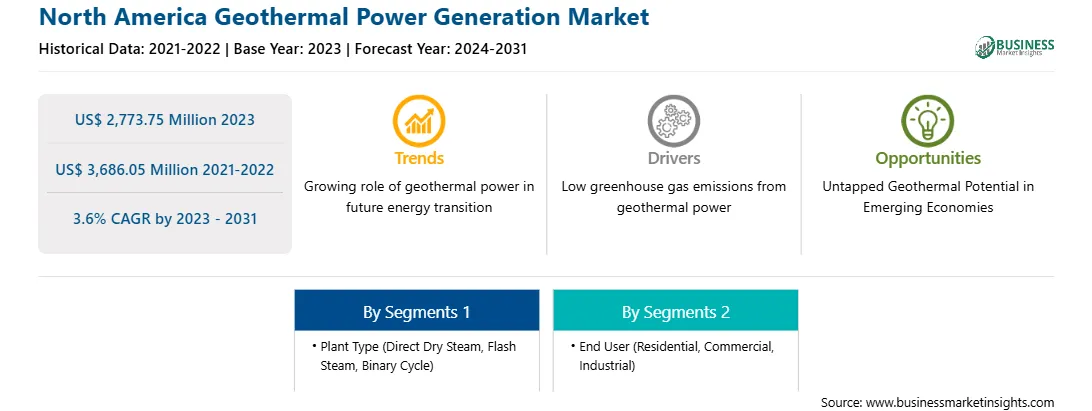
2023 年北美地热发电市场价值为 27.7375 亿美元,预计到 2031 年将达到 36.8605 亿美元;预计 2023 年至 2031 年的复合年增长率为 3.6%。

地热能源需求和利用的增长北美地热发电市场

受人口增长和工业化推动,全球能源需求上升,需要能源生产。地热能可以提供支持这一需求所需电力的很大一部分,有助于可靠的能源供应。此外,能源安全是推动全球地热发电能力扩张的一个根本因素。各国寻求多样化和可靠的能源,以减少对化石燃料的依赖,确保稳定的能源供应,促进经济增长和国家安全。与化石燃料相比,地热能提供稳定而持续的能源,不易受到价格波动和供应中断的影响。自 2000 年以来,地热能行业以平均每年约 3.5% 的速度增长,到 2021 年达到 16 千兆瓦的电力装机容量。2015 年至 2021 年间略有增长,约为 5%,但这仅影响了全球可再生能源装机容量的 0.5%。与此同时,地热能的供暖和制冷应用增长更快,2015 年至 2020 年间增长了约 9%,2020 年达到 107 千兆瓦的热能,占全球可再生能源供暖和制冷装机容量的约 3%。因此,预计全球对地热能的需求和利用率的上升将在未来几年推动地热发电市场的增长。

北美地热发电市场概览

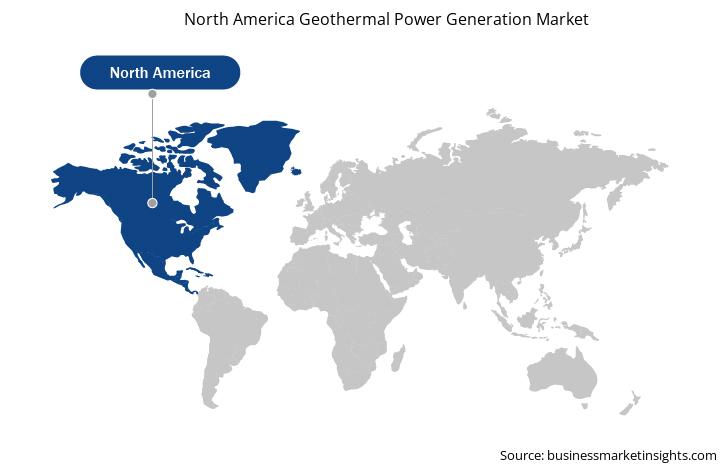
北美地热发电市场分为美国和墨西哥。北美的地热发电总装机容量为 3,628.6 兆瓦,2022 年地热发电总量约为 20.5 TWh。美国在 2022 年占据了约 78% 的最大市场份额,预计在预测期内也将保持主导地位。这是由于美国地热发电厂的装机容量最高,并且过去 10 年政府对可持续电力生产的举措或支持不断增加。此外,这些公司还建立了战略联盟、伙伴关系和合作关系,以开发地热发电厂或技术,预计这将为未来几年在市场上运营的参与者创造机会。例如,2023 年 11 月,Fervo Energy 与谷歌一起在内华达州启动了一座 3.5 兆瓦增强型地热系统 (EGS) 地热发电厂的建设。这座新工厂将为拉斯维加斯和其他州的数据中心提供电力。预计这些关键举措将在未来几年推动地热发电市场的增长。

北美地热发电市场收入及预测至 2031 年(百万美元)

北美地热发电市场细分

北美地热发电市场分为工厂类型、最终用户和国家。

根据工厂类型,北美地热发电市场分为直接干蒸汽、闪蒸汽和二元循环。闪蒸汽部分在 2023 年占据最大市场份额。

就最终用户而言,北美地热发电市场分为住宅、商业和工业。工业部门在 2023 年占据最大市场份额。

按国家/地区划分,北美地热发电市场分为美国和墨西哥。 2023 年,美国占据了北美地热发电市场的主导份额。

北加州电力局、Turboden SpA、东芝能源系统和解决方案公司、伯克希尔哈撒韦公司、NIBE Industrier AB、通用电气公司、富士电机有限公司、开利全球公司和丹佛斯公司是北美地热发电市场的一些领先公司。

TABLE OF CONTENTS


1. Introduction

1.1 The Insight Partners Research Report Guidance

1.2 Market Segmentation

2. Executive Summary

2.1 Key Insights

2.2 Market Attractiveness

3. Research Methodology

3.1 Secondary Research

3.2 Primary Research

3.2.1 Hypothesis formulation:

3.2.2 Macro-economic factor analysis:

3.2.3 Developing base number:

3.2.4 Data Triangulation:

3.2.5 Country level data:

4. North America Geothermal Power Generation Market Landscape

4.1 Overview

4.2 PEST Analysis

4.3 Ecosystem Analysis

4.3.1 Equipment or Component Suppliers

4.3.2 Geothermal Power Plant Operators/Product Manufacturers

4.3.3 End User

5. North America Geothermal Power Generation Market - Key Market Dynamics

5.1 Market Drivers

5.1.1 Rise in Demand and Utilization of Geothermal Energy

5.1.2 Surge in Investment and Government Support toward Geothermal Power Generation

5.2 Market Restraints

5.2.1 High Investment Cost

5.3 Market Opportunities

5.3.1 Untapped Geothermal Potential in Emerging Economies

5.4 Future Trends

5.4.1 Growing Role of Geothermal Power in Future Energy Transition

5.5 Impact of Drivers and Restraints:

6. Geothermal Power Generation Market - North America Analysis

6.1 North America Geothermal Power Generation Market Overview

6.2 Geothermal Power Generation Market Revenue, 2021-2031 (US$ Million)

6.3 Geothermal Power Generation Market Forecast Analysis

7. North America Geothermal Power Generation Market Analysis - by Plant Type

7.1 Direct Dry Steam

7.1.1 Overview

7.1.2 Direct Dry Steam: Geothermal Power Generation Market - Revenue and Forecast to 2031 (US$ Million)

7.2 Flash Steam

7.2.1 Overview

7.2.2 Flash Steam: Geothermal Power Generation Market - Revenue and Forecast to 2031 (US$ Million)

7.3 Binary Cycle

7.3.1 Overview

7.3.2 Binary Cycle: Geothermal Power Generation Market - Revenue and Forecast to 2031 (US$ Million)

8. North America Geothermal Power Generation Market Analysis - by End User

8.1 Residential

8.1.1 Overview

8.1.2 Residential: Geothermal Power Generation Market - Revenue and Forecast to 2031 (US$ Million)

8.2 Commercial

8.2.1 Overview

8.2.2 Commercial: Geothermal Power Generation Market - Revenue and Forecast to 2031 (US$ Million)

8.3 Industrial

8.3.1 Overview

8.3.2 Industrial: Geothermal Power Generation Market - Revenue and Forecast to 2031 (US$ Million)

9. North America Geothermal Power Generation Market - Country Analysis

9.1 North America

9.1.1 North America: Geothermal Power Generation Market Breakdown, by Key Country, 2023 and 2031 (%)

9.1.1.1 North America: Geothermal Power Generation Market - Revenue and Forecast Analysis - by Country

9.1.1.2 United States: Geothermal Power Generation Market - Revenue and Forecast to 2031 (US$ Million)

9.1.1.2.1 United States: Geothermal Power Generation Market Breakdown, by Plant Type

9.1.1.2.2 United States: Geothermal Power Generation Market Breakdown, by End User

9.1.1.3 Mexico: Geothermal Power Generation Market - Revenue and Forecast to 2031 (US$ Million)

9.1.1.3.1 Mexico: Geothermal Power Generation Market Breakdown, by Plant Type

9.1.1.3.2 Mexico: Geothermal Power Generation Market Breakdown, by End User

10. Competitive Landscape

10.1 Heat Map Analysis by Key Players

10.2 Company Positioning and Concentration

11. Industry Landscape

11.1 Overview

11.2 Market Initiative

11.3 Merger and Acquisition

12. Company Profiles

12.1 Northern California Power Agency

12.1.1 Key Facts

12.1.2 Business Description

12.1.3 Products and Services

12.1.4 Financial Overview

12.1.5 SWOT Analysis

12.1.6 Key Developments

12.2 Turboden SpA

12.2.1 Key Facts

12.2.2 Business Description

12.2.3 Products and Services

12.2.4 Financial Overview

12.2.5 SWOT Analysis

12.2.6 Key Developments

12.3 Toshiba Energy Systems & Solutions Corp

12.3.1 Key Facts

12.3.2 Business Description

12.3.3 Products and Services

12.3.4 Financial Overview

12.3.5 SWOT Analysis

12.3.6 Key Developments

12.4 Berkshire Hathaway Inc

12.4.1 Key Facts

12.4.2 Business Description

12.4.3 Products and Services

12.4.4 Financial Overview

12.4.5 SWOT Analysis

12.4.6 Key Developments

12.5 NIBE Industrier AB

12.5.1 Key Facts

12.5.2 Business Description

12.5.3 Products and Services

12.5.4 Financial Overview

12.5.5 SWOT Analysis

12.5.6 Key Developments

12.6 General Electric Co

12.6.1 Key Facts

12.6.2 Business Description

12.6.3 Products and Services

12.6.4 Financial Overview

12.6.5 SWOT Analysis

12.6.6 Key Developments

12.7 Fuji Electric Co Ltd

12.7.1 Key Facts

12.7.2 Business Description

12.7.3 Products and Services

12.7.4 Financial Overview

12.7.5 SWOT Analysis

12.7.6 Key Developments

12.8 Carrier Global Corp

12.8.1 Key Facts

12.8.2 Business Description

12.8.3 Products and Services

12.8.4 Financial Overview

12.8.5 SWOT Analysis

12.8.6 Key Developments

12.9 Danfoss AS

12.9.1 Key Facts

12.9.2 Business Description

12.9.3 Products and Services

12.9.4 Financial Overview

12.9.5 SWOT Analysis

12.9.6 Key Developments

13. Appendix

13.1 About The Insight Partners


List of Tables

Table 1. North America Geothermal Power Generation Market Segmentation

Table 2. Geothermal Power Generation Market - Revenue and Forecast to 2031 (US$ Million)

Table 3. Geothermal Power Generation Market - Revenue and Forecast to 2031 (US$ Million) - by Plant Type

Table 4. Geothermal Power Generation Market - Revenue and Forecast to 2031 (US$ Million) - by End User

Table 5. North America: Geothermal Power Generation Market - Revenue and Forecast to 2031 (US$ Million) - by Country

Table 6. United States: Geothermal Power Generation Market - Revenue and Forecast to 2031 (US$ Million) - by Plant Type

Table 7. United States: Geothermal Power Generation Market - Revenue and Forecast to 2031 (US$ Million) - by End User

Table 8. Mexico: Geothermal Power Generation Market - Revenue and Forecast to 2031 (US$ Million) - by Plant Type

Table 9. Mexico: Geothermal Power Generation Market - Revenue and Forecast to 2031 (US$ Million) - by End User


List of Figures

Figure 1. North America Geothermal Power Generation Market Segmentation, by Country

Figure 2. PEST Analysis

Figure 3. Ecosystem Analysis

Figure 4. North America Geothermal Power Generation Market - Key Market Dynamics

Figure 5. Impact Analysis of Drivers and Restraints

Figure 6. Geothermal Power Generation Market Revenue, 2021-2031 (US$ Million)

Figure 7. Geothermal Power Generation Market Share (%) - by Plant Type (2023 and 2031)

Figure 8. Direct Dry Steam: Geothermal Power Generation Market - Revenue and Forecast to 2031 (US$ Million)

Figure 9. Flash Steam: Geothermal Power Generation Market - Revenue and Forecast to 2031 (US$ Million)

Figure 10. Binary Cycle: Geothermal Power Generation Market - Revenue and Forecast to 2031 (US$ Million)

Figure 11. Geothermal Power Generation Market Share (%) - by End User (2023 and 2031)

Figure 12. Residential: Geothermal Power Generation Market - Revenue and Forecast to 2031 (US$ Million)

Figure 13. Commercial: Geothermal Power Generation Market - Revenue and Forecast to 2031 (US$ Million)

Figure 14. Industrial: Geothermal Power Generation Market - Revenue and Forecast to 2031 (US$ Million)

Figure 15. North America Geothermal Power Generation Market, by Key Countries - Revenue, (2023 US$ Million)

Figure 16. North America: Geothermal Power Generation Market Breakdown, by Key Countries, 2023 and 2031 (%)

Figure 17. United States: Geothermal Power Generation Market - Revenue and Forecast to 2031 (US$ Million)

Figure 18. Mexico: Geothermal Power Generation Market - Revenue and Forecast to 2031 (US$ Million)

Figure 19. Heat Map Analysis by Key Players

Figure 20. Company Positioning and Concentration

  1. Northern California Power Agency
  2. Turboden SpA
  3. Toshiba Energy Systems and Solutions Corp
  4. Berkshire Hathaway Inc
  5. NIBE Industrier AB
  6. General Electric Co
  7. Fuji Electric Co Ltd
  8. Carrier Global Corp
  9. Danfoss AS
  • Save and reduce time carrying out entry-level research by identifying the growth, size, leading players, and segments in the North America geothermal power generation market.
  • Highlights key business priorities to assist companies to realign their business strategies.
  • The key findings and recommendations highlight crucial progressive industry trends in the North America geothermal power generation market, thereby allowing players across the value chain to develop effective long-term strategies.
  • Develop/modify business expansion plans by using substantial growth offering developed and emerging markets.
  • Scrutinize in-depth North America market trends and outlook coupled with the factors driving the North America geothermal power generation market, as well as those hindering it.
  • Enhance the decision-making process by understanding the strategies that underpin commercial interest with respect to client products, segmentation, pricing, and distribution.
Report Code
Full Name
Country Name
Email Id
Phone Number
Job Title
Company
Requirement

Note : Your data will never be shared with third parties, however, we may send you information from time to time about our products that may be of interest to you. By submitting your details, you agree to be contacted by us. You may contact us at any time to opt-out.


Purchase Options
Single User License
$3550
$2840
Site License
$4550
$3640
Enterprise License
$5550
$4440