中东收入保证市场预测至 2030 年 - 区域分析 - 按组件(解决方案和服务)、部署(本地和基于云)、组织规模(中小型企业和大型企业)和垂直行业(BFSI、酒店、电信、公用事业等)

BMIRE00030480 | Pages: 95 | Technology, Media and Telecommunications | Jul 2024 | Type: Regional | Status: Published
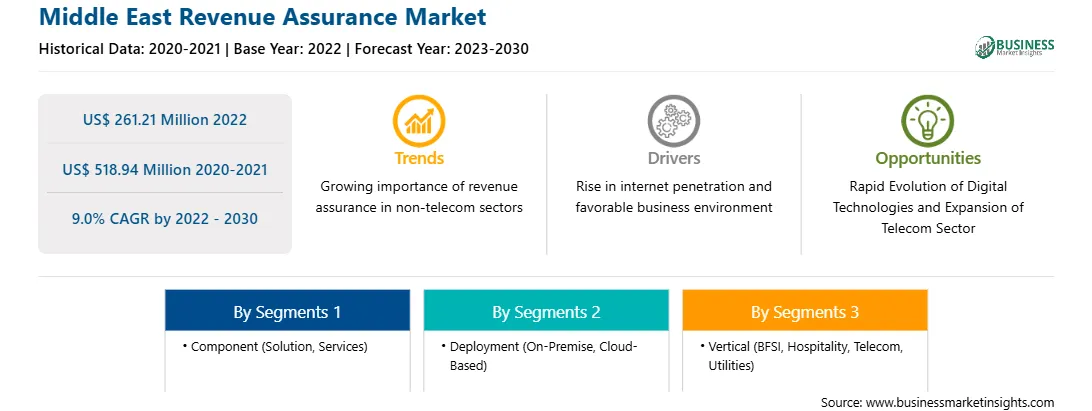
2022 年,中东收入保障市场价值为 2.6121 亿美元,预计到 2030 年将达到 5.1894 亿美元;预计 2022 年至 2030 年的复合年增长率为 9.0%。

数字技术的快速发展推动了中东收入保障市场的发展

技术进步彻底改变了各个行业,收入保障市场也不例外。随着机器学习和人工智能等数字技术的快速发展,收入保障市场获得了提高其效率和推动业务增长的新机遇。技术对于收入保障至关重要,因为它提供了创新的工具和解决方案来监控、分析和优化收入来源。它使企业能够简化流程、识别收入流失并确保遵守监管标准。采用收入保障方面的技术进步可以提高运营效率、增加收入并提高客户满意度。

预测分析利用历史和实时数据来预测未来的收入模式,识别潜在的收入流失并降低风险。通过采用先进的算法和机器学习技术,收入保障团队可以预测收入趋势,识别潜在的收入损失领域,并在问题出现之前实施预防措施。这种主动方法有助于企业优化收入流并最大限度地降低财务风险。此外,区块链技术为收入保障提供了一个透明且安全的平台。通过利用区块链的分散式账本系统,企业可以确保与收入相关的数据的完整性和不变性。该技术可以安全且防篡改地记录交易,简化收入对账流程,并增强利益相关者的信任。区块链促进了更快的结算流程,减少了因延迟付款或纠纷造成的收入流失。

技术进步,尤其是大数据和机器学习 (ML) 方面的技术进步,正在彻底改变收入保障市场。这些进步使企业能够有效地管理和优化其收入流,从而提高盈利能力和运营效率。大数据分析使组织能够从各种来源收集和分析大量数据,包括客户交易、计费系统和网络运营。使用先进的分析技术,企业可以获得有关其收入产生过程的宝贵见解,识别潜在的收入流失并主动解决这些问题。这种主动方法有助于最大限度地减少财务损失并确保准确的计费和收入确认。

机器学习 (ML) 通过自动执行复杂的数据分析任务并检测收入模式中的异常或偏差,在收入保证中发挥着至关重要的作用。ML 算法可以分析历史数据、识别趋势并预测潜在的收入风险。这使企业能够采取预防措施并实施主动策略来减少收入损失。为此,各个国家和全球参与者都专注于将 AI 技术注入他们的工作流程。到 2030 年,各国有望成为首屈一指的人工智能 (AI) 中心。此外,根据国际贸易管理局的报告,与 2020 年相比,2021 年的全球人工智能资金翻了一番,达到 668 亿美元。这表明人工智能为全球商业格局带来的巨大潜力和机遇,并凸显了人工智能驱动的创新和发展在多个行业的增长。

中东收入保障市场概览

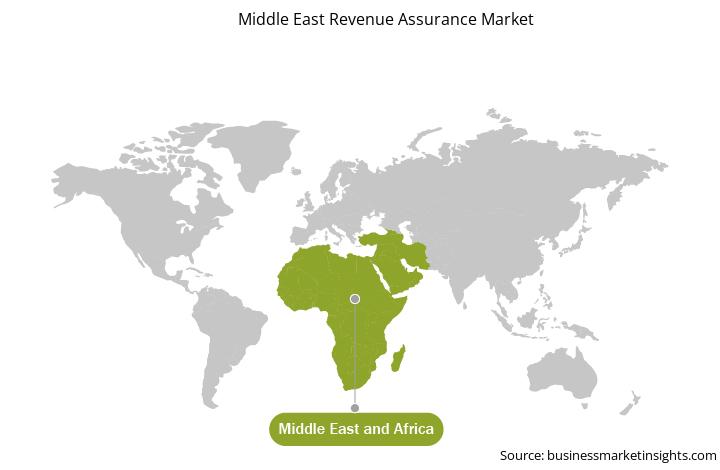
中东收入保障市场分为沙特阿拉伯、阿联酋、科威特、阿曼和中东和非洲其他地区。推动中东和非洲收入保障市场发展的重要因素之一是电信行业的不断扩张。随着电信用户数量的增加,服务提供商面临着管理复杂收入流的挑战。收入保障解决方案使电信公司能够准确地跟踪和协调他们的收入,确保最佳货币化并最大限度地减少收入流失。此外,近年来,中东和非洲的监管框架发生了重大转变。各国政府越来越多地实施严格的法规,以打击欺诈、提高透明度和保护消费者利益。收入保障解决方案通过提供实时监控、欺诈检测和收入核对功能,对于确保遵守这些法规至关重要。

中东地区也在经历快速的数字化转型,企业采用新技术并拥抱数字平台。随着数字交易和服务的激增,收入流失和欺诈风险也在增加。收入保障解决方案通过识别和解决跨数字渠道的差异来帮助组织保障收入,确保准确的收入报告。根据阿布扎比数字管理局的数据,该地区的知名组织越来越重视数字化转型,预计到 2022 年,数字化转型计划的年度支出将超过 400 亿美元。

中东收入保障市场收入和预测到 2030 年(百万美元)

中东收入保障市场细分

中东收入保障市场分为组件、部署、组织规模、垂直和国家。

根据组件,中东收入保障市场分为解决方案和服务。解决方案部分在 2022 年占有更大的市场份额。

根据部署,中东收入保障市场分为本地和基于云的。基于云的部分在 2022 年占有更大的市场份额。

根据组织规模,中东收入保障市场分为中小企业和大型企业。大型企业部门在 2022 年占有更大的市场份额。

根据垂直行业,中东收入保障市场分为 BFSI、酒店、电信、公用事业和其他。电信部门在 2022 年占有最大的市场份额。

按国家/地区划分,中东收入保障市场分为沙特阿拉伯、阿联酋、科威特、卡塔尔、阿曼和中东其他地区。 2022 年,阿联酋占据了中东收入保障市场的主导份额。

诺基亚公司、塔塔咨询服务有限公司、Amdocs、Subex、Araxxe SAS、Panamax Inc 和 LATRO Services Inc 是中东收入保障市场的一些领先公司。

TABLE OF CONTENTS


1. Introduction

1.1 The Insight Partners Research Report Guidance

1.2 Market Segmentation

2. Executive Summary

2.1 Key Insights

2.2 Market Attractiveness

3. Research Methodology

3.1 Coverage

3.2 Secondary Research

3.3 Primary Research

4. Middle East Revenue Assurance Market Landscape

4.1 Overview

4.2 PEST Analysis

4.3 Ecosystem Analysis

4.3.1 Solution Providers:

4.3.2 Service Providers

4.3.3 End Users:

4.3.4 List of Vendors in the Value Chain

5. Middle East Revenue Assurance Market - Key Market Dynamics

5.1 Drivers

5.1.1 Rise in Internet Penetration

5.1.2 Favorable Business Environment

5.2 Restraints

5.2.1 Lack of Awareness and Understanding of Revenue Assurance

5.2.2 Organizational Management Issues

5.3 Opportunity

5.3.1 Rapid Evolution of Digital Technologies

5.3.2 Expansion of Telecom Sector

5.4 Future Trends

5.4.1 Growing Importance of Revenue Assurance in Non-Telecom Sectors

5.5 Impact of Drivers and Restraints:

6. Revenue Assurance Market - Middle East Market Analysis

6.1 Revenue Assurance Market Revenue (US$ Million), 2020-2030

6.2 Revenue Assurance Market Forecast Analysis

7. Middle East Revenue Assurance Market Analysis - by Component

7.1 Solution

7.1.1 Overview

7.1.2 Solution: Revenue Assurance Market - Revenue and Forecast to 2030 (US$ Million)

7.2 Services

7.2.1 Overview

7.2.2 Services: Revenue Assurance Market - Revenue and Forecast to 2030 (US$ Million)

8. Middle East Revenue Assurance Market Analysis - by Deployment

8.1 On-premise

8.1.1 Overview

8.1.2 On-premise: Revenue Assurance Market - Revenue and Forecast to 2030 (US$ Million)

8.2 Cloud-based

8.2.1 Overview

8.2.2 Cloud-based: Revenue Assurance Market - Revenue and Forecast to 2030 (US$ Million)

9. Middle East Revenue Assurance Market Analysis - by Organization Size

9.1 SMEs

9.1.1 Overview

9.1.2 SMEs: Revenue Assurance Market - Revenue and Forecast to 2030 (US$ Million)

9.2 Large Enterprises

9.2.1 Overview

9.2.2 Large Enterprises: Revenue Assurance Market - Revenue and Forecast to 2030 (US$ Million)

10. Middle East Revenue Assurance Market Analysis - by Vertical

10.1 BFSI

10.1.1 Overview

10.1.2 BFSI: Revenue Assurance Market - Revenue and Forecast to 2030 (US$ Million)

10.2 Hospitality

10.2.1 Overview

10.2.2 Hospitality: Revenue Assurance Market - Revenue and Forecast to 2030 (US$ Million)

10.3 Telecom

10.3.1 Overview

10.3.2 Telecom: Revenue Assurance Market - Revenue and Forecast to 2030 (US$ Million)

10.4 Utilities

10.4.1 Overview

10.4.2 Utilities: Revenue Assurance Market - Revenue and Forecast to 2030 (US$ Million)

10.5 Others

10.5.1 Overview

10.5.2 Others: Revenue Assurance Market - Revenue and Forecast to 2030 (US$ Million)

11. Middle East Revenue Assurance Market - Country Analysis

11.1 Middle East Revenue Assurance Market Overview

11.1.1 Middle East: Revenue Assurance Market - Revenue and Forecast Analysis - by Country

11.1.1.1 Middle East: Revenue Assurance Market - Revenue and Forecast Analysis - by Country

11.1.1.2 Saudi Arabia: Revenue Assurance Market - Revenue and Forecast to 2030 (US$ Million)

11.1.1.2.1 Saudi Arabia: Revenue Assurance Market Breakdown, by Component

11.1.1.2.2 Saudi Arabia: Revenue Assurance Market Breakdown, by Deployment

11.1.1.2.3 Saudi Arabia: Revenue Assurance Market Breakdown, by Organization Size

11.1.1.2.4 Saudi Arabia: Revenue Assurance Market Breakdown, by Vertical

11.1.1.3 United Arab Emirates: Revenue Assurance Market - Revenue and Forecast to 2030 (US$ Million)

11.1.1.3.1 United Arab Emirates: Revenue Assurance Market Breakdown, by Component

11.1.1.3.2 United Arab Emirates: Revenue Assurance Market Breakdown, by Deployment

11.1.1.3.3 United Arab Emirates: Revenue Assurance Market Breakdown, by Organization Size

11.1.1.3.4 United Arab Emirates: Revenue Assurance Market Breakdown, by Vertical

11.1.1.4 Kuwait: Revenue Assurance Market - Revenue and Forecast to 2030 (US$ Million)

11.1.1.4.1 Kuwait: Revenue Assurance Market Breakdown, by Component

11.1.1.4.2 Kuwait: Revenue Assurance Market Breakdown, by Deployment

11.1.1.4.3 Kuwait: Revenue Assurance Market Breakdown, by Organization Size

11.1.1.4.4 Kuwait: Revenue Assurance Market Breakdown, by Vertical

11.1.1.5 Qatar: Revenue Assurance Market - Revenue and Forecast to 2030 (US$ Million)

11.1.1.5.1 Qatar: Revenue Assurance Market Breakdown, by Component

11.1.1.5.2 Qatar: Revenue Assurance Market Breakdown, by Deployment

11.1.1.5.3 Qatar: Revenue Assurance Market Breakdown, by Organization Size

11.1.1.5.4 Qatar: Revenue Assurance Market Breakdown, by Vertical

11.1.1.6 Oman: Revenue Assurance Market - Revenue and Forecast to 2030 (US$ Million)

11.1.1.6.1 Oman: Revenue Assurance Market Breakdown, by Component

11.1.1.6.2 Oman: Revenue Assurance Market Breakdown, by Deployment

11.1.1.6.3 Oman: Revenue Assurance Market Breakdown, by Organization Size

11.1.1.6.4 Oman: Revenue Assurance Market Breakdown, by Vertical

11.1.1.7 Rest of Middle East: Revenue Assurance Market - Revenue and Forecast to 2030 (US$ Million)

11.1.1.7.1 Rest of Middle East: Revenue Assurance Market Breakdown, by Component

11.1.1.7.2 Rest of Middle East: Revenue Assurance Market Breakdown, by Deployment

11.1.1.7.3 Rest of Middle East: Revenue Assurance Market Breakdown, by Organization Size

11.1.1.7.4 Rest of Middle East: Revenue Assurance Market Breakdown, by Vertical

12. Competitive Landscape

12.1 Heat Map Analysis by Key Players

12.2 Company Positioning & Concentration

13. Industry Landscape

13.1 Overview

13.2 Market Initiative

13.3 Mergers & Acquisitions

14. Company Profiles

14.1 Nokia Corp

14.1.1 Key Facts

14.1.2 Business Description

14.1.3 Products and Services

14.1.4 Financial Overview

14.1.5 SWOT Analysis

14.1.6 Key Developments

14.2 Tata Consultancy Services Ltd

14.2.1 Key Facts

14.2.2 Business Description

14.2.3 Products and Services

14.2.4 Financial Overview

14.2.5 SWOT Analysis

14.2.6 Key Developments

14.3 Amdocs Ltd

14.3.1 Key Facts

14.3.2 Business Description

14.3.3 Products and Services

14.3.4 Financial Overview

14.3.5 SWOT Analysis

14.3.6 Key Developments

14.4 Subex Ltd

14.4.1 Key Facts

14.4.2 Business Description

14.4.3 Products and Services

14.4.4 Financial Overview

14.4.5 SWOT Analysis

14.4.6 Key Developments

14.5 Araxxe SAS

14.5.1 Key Facts

14.5.2 Business Description

14.5.3 Products and Services

14.5.4 Financial Overview

14.5.5 SWOT Analysis

14.5.6 Key Developments

14.6 Panamax Inc

14.6.1 Key Facts

14.6.2 Business Description

14.6.3 Products and Services

14.6.4 Financial Overview

14.6.5 SWOT Analysis

14.6.6 Key Developments

14.7 LATRO Services Inc

14.7.1 Key Facts

14.7.2 Business Description

14.7.3 Products and Services

14.7.4 Financial Overview

14.7.5 SWOT Analysis

14.7.6 Key Developments

15. Appendix

15.1 About The Insight Partners

15.2 Word Index

List of Tables

Table 1. Revenue Assurance Market Segmentation

Table 2. List of Vendors

Table 3. Revenue Assurance Market - Revenue and Forecast to 2030 (US$ Million)

Table 4. Revenue Assurance Market - Revenue and Forecast to 2030 (US$ Million) - by Component

Table 5. Revenue Assurance Market - Revenue and Forecast to 2030 (US$ Million) - by Deployment

Table 6. Revenue Assurance Market - Revenue and Forecast to 2030 (US$ Million) - by Organization Size

Table 7. Revenue Assurance Market - Revenue and Forecast to 2030 (US$ Million) - by Vertical

Table 8. Middle East: Revenue Assurance Market - Revenue and Forecast to 2030 (US$ Million) - by Country

Table 9. Saudi Arabia: Revenue Assurance Market - Revenue and Forecast to 2030 (US$ Million) - by Component

Table 10. Saudi Arabia: Revenue Assurance Market - Revenue and Forecast to 2030 (US$ Million) - by Deployment

Table 11. Saudi Arabia: Revenue Assurance Market - Revenue and Forecast to 2030 (US$ Million) - by Organization Size

Table 12. Saudi Arabia: Revenue Assurance Market - Revenue and Forecast to 2030 (US$ Million) - by Vertical

Table 13. United Arab Emirates: Revenue Assurance Market - Revenue and Forecast to 2030 (US$ Million) - by Component

Table 14. United Arab Emirates: Revenue Assurance Market - Revenue and Forecast to 2030 (US$ Million) - by Deployment

Table 15. United Arab Emirates: Revenue Assurance Market - Revenue and Forecast to 2030 (US$ Million) - by Organization Size

Table 16. United Arab Emirates: Revenue Assurance Market - Revenue and Forecast to 2030 (US$ Million) - by Vertical

Table 17. Kuwait: Revenue Assurance Market - Revenue and Forecast to 2030 (US$ Million) - by Component

Table 18. Kuwait: Revenue Assurance Market - Revenue and Forecast to 2030 (US$ Million) - by Deployment

Table 19. Kuwait: Revenue Assurance Market - Revenue and Forecast to 2030 (US$ Million) - by Organization Size

Table 20. Kuwait: Revenue Assurance Market - Revenue and Forecast to 2030 (US$ Million) - by Vertical

Table 21. Qatar: Revenue Assurance Market - Revenue and Forecast to 2030 (US$ Million) - by Component

Table 22. Qatar: Revenue Assurance Market - Revenue and Forecast to 2030 (US$ Million) - by Deployment

Table 23. Qatar: Revenue Assurance Market - Revenue and Forecast to 2030 (US$ Million) - by Organization Size

Table 24. Qatar: Revenue Assurance Market - Revenue and Forecast to 2030 (US$ Million) - by Vertical

Table 25. Oman: Revenue Assurance Market - Revenue and Forecast to 2030 (US$ Million) - by Component

Table 26. Oman: Revenue Assurance Market - Revenue and Forecast to 2030 (US$ Million) - by Deployment

Table 27. Oman: Revenue Assurance Market - Revenue and Forecast to 2030 (US$ Million) - by Organization Size

Table 28. Oman: Revenue Assurance Market - Revenue and Forecast to 2030 (US$ Million) - by Vertical

Table 29. Rest of Middle East: Revenue Assurance Market - Revenue and Forecast to 2030 (US$ Million) - by Component

Table 30. Rest of Middle East: Revenue Assurance Market - Revenue and Forecast to 2030 (US$ Million) - by Deployment

Table 31. Rest of Middle East: Revenue Assurance Market - Revenue and Forecast to 2030 (US$ Million) - by Organization Size

Table 32. Rest of Middle East: Revenue Assurance Market - Revenue and Forecast to 2030 (US$ Million) - by Vertical

Table 33. Heat Map Analysis

Table 34. List of Abbreviation

List of Figures

Figure 1. Revenue Assurance Market Segmentation, by Country

Figure 2. PEST Analysis

Figure 3. Ecosystem Analysis

Figure 4. Revenue Assurance Market - Key Market Dynamics

Figure 5. Impact Analysis of Drivers and Restraints

Figure 6. Revenue Assurance Market Revenue (US$ Million), 2020-2030

Figure 7. Revenue Assurance Market Share (%) - by Component (2022 and 2030)

Figure 8. Solution: Revenue Assurance Market - Revenue and Forecast to 2030 (US$ Million)

Figure 9. Services: Revenue Assurance Market - Revenue and Forecast to 2030 (US$ Million)

Figure 10. Revenue Assurance Market Share (%) - by Deployment (2022 and 2030)

Figure 11. On-premise: Revenue Assurance Market - Revenue and Forecast to 2030 (US$ Million)

Figure 12. Cloud-based: Revenue Assurance Market - Revenue and Forecast to 2030 (US$ Million)

Figure 13. Revenue Assurance Market Share (%) - by Organization Size (2022 and 2030)

Figure 14. SMEs: Revenue Assurance Market - Revenue and Forecast to 2030 (US$ Million)

Figure 15. Large Enterprises: Revenue Assurance Market - Revenue and Forecast to 2030 (US$ Million)

Figure 16. Revenue Assurance Market Share (%) - by Vertical (2022 and 2030)

Figure 17. BFSI: Revenue Assurance Market - Revenue and Forecast to 2030 (US$ Million)

Figure 18. Hospitality: Revenue Assurance Market - Revenue and Forecast to 2030 (US$ Million)

Figure 19. Telecom: Revenue Assurance Market - Revenue and Forecast to 2030 (US$ Million)

Figure 20. Utilities: Revenue Assurance Market - Revenue and Forecast to 2030 (US$ Million)

Figure 21. Others: Revenue Assurance Market - Revenue and Forecast to 2030 (US$ Million)

Figure 22. Middle East: Revenue Assurance Market, by Key Country - Revenue (20222) (US$ Million)

Figure 23. Middle East: Revenue Assurance Market Breakdown, by Key Countries, 2022 and 2030 (%)

Figure 24. Saudi Arabia: Revenue Assurance Market - Revenue and Forecast to 2030 (US$ Million)

Figure 25. United Arab Emirates: Revenue Assurance Market - Revenue and Forecast to 2030 (US$ Million)

Figure 26. Kuwait: Revenue Assurance Market - Revenue and Forecast to 2030 (US$ Million)

Figure 27. Qatar: Revenue Assurance Market - Revenue and Forecast to 2030 (US$ Million)

Figure 28. Oman: Revenue Assurance Market - Revenue and Forecast to 2030 (US$ Million)

Figure 29. Rest of Middle East: Revenue Assurance Market - Revenue and Forecast to 2030 (US$ Million)

Figure 30. Company Positioning & Concentration

1. Nokia Corp 
2. Tata Consultancy Services Ltd 
3. Amdocs 
4. Subex Ltd 
5. LATRO Services Inc 
6. Araxxe SAS 
7. Panamax Inc 

  • Save and reduce time carrying out entry-level research by identifying the growth, size, leading players, and segments in the Middle East revenue assurance market.
  • Highlights key business priorities in order to assist companies to realign their business strategies.
  • The key findings and recommendations highlight crucial progressive industry trends in the Middle East revenue assurance market, thereby allowing players across the value chain to develop effective long-term strategies.
  • Develop/modify business expansion plans by using substantial growth offering developed and emerging markets.
  • Scrutinize in-depth Middle East market trends and outlook coupled with the factors driving the Middle East revenue assurance market, as well as those hindering it.
  • Enhance the decision-making process by understanding the strategies that underpin commercial interest with respect to client products, segmentation, pricing, and distribution.
Report Code
Full Name
Country Name
Email Id
Phone Number
Job Title
Company
Requirement

Note : Your data will never be shared with third parties, however, we may send you information from time to time about our products that may be of interest to you. By submitting your details, you agree to be contacted by us. You may contact us at any time to opt-out.


Purchase Options
Single User License
$3550
$2840
Site License
$4550
$3640
Enterprise License
$5550
$4440