中东和非洲生物反应器市场预测至 2030 年 - 区域分析 - 按规模(实验室规模生产、中试规模生产和全面生产)、应用(微生物应用、细胞培养应用和其他)、技术(补料分批生物反应器和灌注生物反应器)和最终用户(生物制药制造商、研发组织和合同制造组织)

BMIRE00030245 | Pages: 80 | Biotechnology | Jun 2024 | Type: Regional | Status: Published
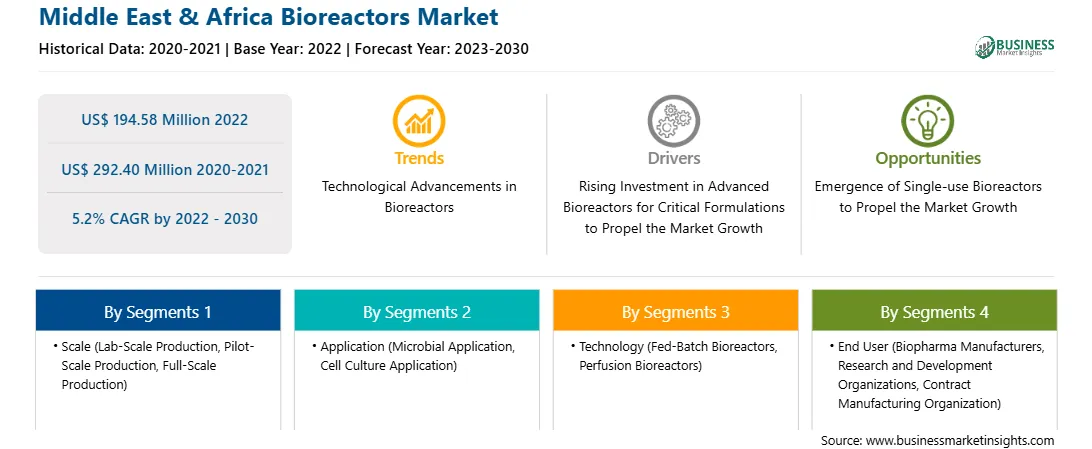
2022 年中东和非洲生物反应器市场价值为 1.9458 亿美元,预计到 2030 年将达到 2.924 亿美元;预计 2022 年至 2030 年的复合年增长率为 5.2%。

一次性生物反应器的采用率不断提高,促进了中东和非洲生物反应器市场的发展

各种制造商都在开发一次性生物反应器 (SUB),因为它们坚固耐用,可提供生物制药商业制造所需的高性能。薄膜技术、搅拌机制、生物反应器设计和传感器系统等优势有助于增加一次性反应器从实验室到生产规模的采用。一次性生物反应器提供下一代细胞和基因疗法以及连续生物处理。细胞培养过程的进步已经开发出更高的滴度和细胞密度,这促进了 SUB 的采用。

一次性生物反应器可降低污染风险并缩短生产周转时间。在过去几年中,由于一次性生物反应器具有提高灵活性、减少投资和限制运营成本的独特能力,其在现代生物制药工艺中的使用有所增加。此外,许多公司还开发了一次性生物反应器,用于生产多种治疗剂。例如,2021 年 3 月,赛默飞世尔科技推出了 3,000 L 和 5,000 L HyPerforma DynaDrive 一次性生物反应器。

验证时间的减少是一次性生物反应器的主要优势之一。上游生物加工越来越多地采用一次性生物反应器,推动了市场增长。例如,Sartorius AG 提供各种一次性生物反应器。该公司为 10-15 mL 微型生物反应器规模提供 ambr 15,为 50-2000L 提供 Biostat STR。一次性生物反应器在治疗药物生产中的应用越来越广泛,这推动了生物反应器市场的发展。

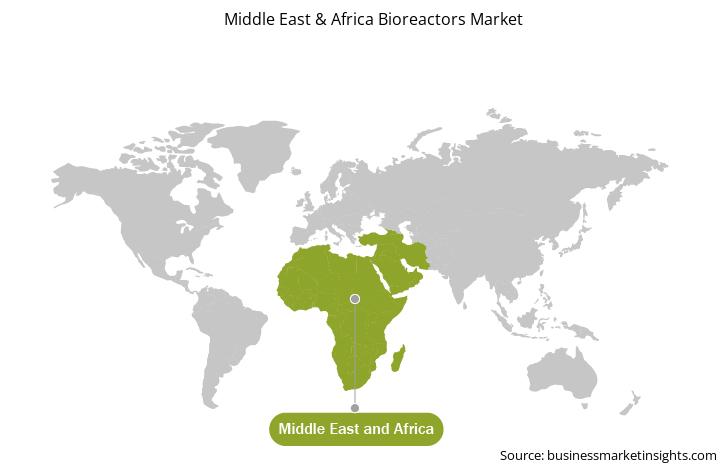
中东和非洲生物反应器市场概览

在沙特阿拉伯,生物反应器市场的发展受到越来越多的初创公司和人们对该国正在进行的研究和开发的认识不断提高的推动,以加强研究活动。研究和技术在很大程度上受到阿卜杜拉国王科技大学等机构开展的越来越多的研究项目的支配。发达的研究中心专注于增加治疗各种疾病的研究,这反过来又会增加新治疗方法的开发,从而也推动市场增长。例如,2022 年,在沙特阿拉伯王国费萨尔国王专科医院和研究中心的干细胞和组织再造计划下,进行了一项研究“嵌合抗原受体结构和使用不同生物反应器制造临床级 CAR 工程细胞”。

在沙特阿拉伯,政府举措负责私营部门参与医疗保健扩张和投资。沙特阿拉伯发达的医疗保健支出和日益增加的政府举措正在影响生物反应器市场的增长。

中东和非洲生物反应器市场收入和预测到 2030 年(百万美元)

中东和非洲生物反应器市场细分

中东和非洲生物反应器市场根据规模、应用、技术、最终用户和国家进行细分。根据规模,中东和非洲生物反应器市场细分为实验室规模生产、中试规模生产和全面生产。中试规模生产部分在 2022 年占据了最大的市场份额。

在应用方面,中东和非洲生物反应器市场分为微生物应用、细胞培养应用和其他应用。细胞培养应用部分在 2022 年占据了最大的市场份额。

按技术,中东和非洲生物反应器市场分为补料分批生物反应器和灌注生物反应器。 2022 年,补料分批生物反应器细分市场占有较大的市场份额。

根据最终用户,中东和非洲生物反应器市场分为生物制药制造商、研发组织和合同制造组织。研发组织细分市场在 2022 年占有最大的市场份额。

根据国家/地区,中东和非洲生物反应器市场细分为沙特阿拉伯、南非、阿联酋和中东及非洲其他地区。沙特阿拉伯在 2022 年占据了中东和非洲生物反应器市场份额的主导地位。

Applikon Biotechnology BV、通用电气公司、默克集团、Pall Corp、PBS Biotech Inc、Sartorius AG、Solaris Biotechnology SRL 和赛默飞世尔科技公司是中东和非洲生物反应器市场的一些领先参与者。

Table of Content


1. Introduction

1.1 The Insight Partners Research Report Guidance

1.2 Market Segmentation

2. Executive Summary

2.1 Key Insights

3. Research Methodology

3.1 Coverage

3.2 Secondary Research

3.3 Primary Research

4. Middle East & Africa Bioreactors Market - Key Industry Dynamics

4.1 Bioreactors Market - Key Industry Dynamics

4.2 Market Drivers

4.2.1 Increasing Adoption of Single-Use Bioreactors

4.2.2 Rapid Growth of Pharmaceutical and Biotechnology Industry

4.3 Market Restraints

4.3.1 Stringent Regulatory Framework

4.4 Market Opportunities

4.4.1 Rising Demand for Personalized Medicine

4.5 Future Trends

4.5.1 Technological Advancements in Bioreactors

4.6 Impact of Drivers and Restraints:

5. Bioreactors Market - Middle East & Africa Market Analysis

5.1 Overview

5.2 Bioreactors Market Revenue (US$ Million), 2020 - 2030

6. Middle East & Africa Bioreactors Market Analysis - Scale

6.1 Overview

6.2 Bioreactors Market Revenue Share, by Scale 2022 & 2030 (%)

6.3 Lab-Scale Production

6.3.1 Overview

6.3.2 Lab-Scale Production Market, Revenue and Forecast to 2030 (US$ Million)

6.4 Pilot-Scale Production

6.4.1 Overview

6.4.2 Pilot-Scale Production Market, Revenue and Forecast to 2030 (US$ Million)

6.5 Full-Scale Production

6.5.1 Overview

6.5.2 Full-Scale Production Market, Revenue and Forecast to 2030 (US$ Million)

7. Middle East & Africa Bioreactors Market Analysis - Application

7.1 Overview

7.2 Bioreactors Market Revenue Share, by Application 2022 & 2030 (%)

7.3 Microbial Application

7.3.1 Overview

7.3.2 Microbial Application Market, Revenue and Forecast to 2030 (US$ Million)

7.4 Cell Culture Application

7.4.1 Overview

7.4.2 Cell Culture Application Market, Revenue and Forecast to 2030 (US$ Million)

7.5 Others

7.5.1 Overview

7.5.2 Others Market, Revenue and Forecast to 2030 (US$ Million)

8. Middle East & Africa Bioreactors Market Analysis - Technology

8.1 Overview

8.2 Bioreactors Market Revenue Share, by Technology 2022 & 2030 (%)

8.3 Fed-Batch Bioreactors

8.3.1 Overview

8.3.2 Fed-Batch Bioreactors Market, Revenue and Forecast to 2030 (US$ Million)

8.4 Perfusion Bioreactors

8.4.1 Overview

8.4.2 Perfusion Bioreactors Market, Revenue and Forecast to 2030 (US$ Million)

9. Middle East & Africa Bioreactors Market Analysis - End User

9.1 Overview

9.2 Bioreactors Market Revenue Share, by End User 2022 & 2030 (%)

9.3 Biopharma Manufacturers

9.3.1 Overview

9.3.2 Biopharma Manufacturers Market, Revenue and Forecast to 2030 (US$ Million)

9.4 Research and Development Organizations

9.4.1 Overview

9.4.2 Research and Development Organizations Market, Revenue and Forecast to 2030 (US$ Million)

9.5 Contract Manufacturing Organization

9.5.1 Overview

9.5.2 Contract Manufacturing Organization Market, Revenue and Forecast to 2030 (US$ Million)

10. Middle East & Africa Bioreactors Market - by Country Analysis

10.1 Middle East & Africa Bioreactors Market

10.1.1 Middle East & Africa Bioreactors Market Revenue and Forecasts and Analysis - By Country

10.1.1.1 Saudi Arabia

10.1.1.2 Overview

10.1.1.3 Saudi Arabia: Bioreactors Market - Revenue and Forecast to 2030 (US$ Million)

10.1.1.4 Saudi Arabia Bioreactors Market Revenue and Forecasts to 2030 (US$ Mn)

10.1.1.4.1 Saudi Arabia Bioreactors Market Breakdown by Scale

10.1.1.4.2 Saudi Arabia Bioreactors Market Breakdown by Application

10.1.1.4.3 Saudi Arabia Bioreactors Market Breakdown by Technology

10.1.1.4.4 Saudi Arabia Bioreactors Market Breakdown by End User

10.1.1.5 South Africa

10.1.1.6 Overview

10.1.1.7 South Africa: Bioreactors Market - Revenue and Forecast to 2030 (US$ Million)

10.1.1.7.1 South Africa Bioreactors Market Breakdown by Scale

10.1.1.7.2 South Africa Bioreactors Market Breakdown by Application

10.1.1.7.3 South Africa Bioreactors Market Breakdown by Technology

10.1.1.7.4 South Africa Bioreactors Market Breakdown by End User

10.1.1.8 UAE

10.1.1.9 Overview

10.1.1.10 United Arab Emirates: Bioreactors Market - Revenue and Forecast to 2030 (US$ Million)

10.1.1.10.1 United Arab Emirates Bioreactors Market Breakdown by Scale

10.1.1.10.2 United Arab Emirates Bioreactors Market Breakdown by Application

10.1.1.10.3 United Arab Emirates Bioreactors Market Breakdown by Technology

10.1.1.10.4 United Arab Emirates Bioreactors Market Breakdown by End User

10.1.1.11 Rest of Middle East & Africa

10.1.1.12 Overview

10.1.1.13 Rest of Middle East & Africa: Bioreactors Market - Revenue and Forecast to 2030 (US$ Million)

10.1.1.13.1 Rest of Middle East & Africa Bioreactors Market Breakdown by Scale

10.1.1.13.2 Rest of Middle East & Africa Bioreactors Market Breakdown by Application

10.1.1.13.3 Rest of Middle East & Africa Bioreactors Market Breakdown by Technology

10.1.1.13.4 Rest of Middle East & Africa Bioreactors Market Breakdown by End User

11. Bioreactors Market-Industry Landscape

11.1 Overview

11.2 Growth Strategies in the Bioreactors Market

11.3 Inorganic Growth Strategies

11.3.1 Overview

11.4 Organic Growth Strategies

11.4.1 Overview

12. Company Profiles

12.1 PBS Biotech Inc

12.1.1 Key Facts

12.1.2 Business Description

12.1.3 Products and Services

12.1.4 Financial Overview

12.1.5 SWOT Analysis

12.1.6 Key Developments

12.2 General Electric Co

12.2.1 Key Facts

12.2.2 Business Description

12.2.3 Products and Services

12.2.4 Financial Overview

12.2.5 SWOT Analysis

12.2.6 Key Developments

12.3 Merck KGaA

12.3.1 Key Facts

12.3.2 Business Description

12.3.3 Products and Services

12.3.4 Financial Overview

12.3.5 SWOT Analysis

12.3.6 Key Developments

12.4 Thermo Fisher Scientific Inc

12.4.1 Key Facts

12.4.2 Business Description

12.4.3 Products and Services

12.4.4 Financial Overview

12.4.5 SWOT Analysis

12.4.6 Key Developments

12.5 Sartorius AG

12.5.1 Key Facts

12.5.2 Business Description

12.5.3 Products and Services

12.5.4 Financial Overview

12.5.5 SWOT Analysis

12.5.6 Key Developments

12.6 Pall Corp

12.6.1 Key Facts

12.6.2 Business Description

12.6.3 Products and Services

12.6.4 Financial Overview

12.6.5 SWOT Analysis

12.6.6 Key Developments

12.7 Solaris Biotechnology SRL

12.7.1 Key Facts

12.7.2 Business Description

12.7.3 Products and Services

12.7.4 Financial Overview

12.7.5 SWOT Analysis

12.7.6 Key Developments

13. Appendix

13.1 About The Insight Partners

13.2 Glossary of Terms


List of Tables

Table 1. Bioreactors Market Segmentation

Table 2. Saudi Arabia Bioreactors Market Revenue and Forecasts to 2030 (US$ Mn) - By Scale

Table 3. Saudi Arabia Bioreactors Market Revenue and Forecasts to 2030 (US$ Mn) - By Application

Table 4. Saudi Arabia Bioreactors Market Revenue and Forecasts to 2030 (US$ Mn) - By Technology

Table 5. Saudi Arabia Bioreactors Market Revenue and Forecasts to 2030 (US$ Mn) - By End User

Table 6. South Africa Bioreactors Market Revenue and Forecasts to 2030 (US$ Mn) - By Scale

Table 7. South Africa Bioreactors Market Revenue and Forecasts to 2030 (US$ Mn) - By Application

Table 8. South Africa Bioreactors Market Revenue and Forecasts to 2030 (US$ Mn) - By Technology

Table 9. South Africa Bioreactors Market Revenue and Forecasts to 2030 (US$ Mn) - By End User

Table 10. United Arab Emirates Bioreactors Market Revenue and Forecasts to 2030 (US$ Mn) - By Scale

Table 11. United Arab Emirates Bioreactors Market Revenue and Forecasts to 2030 (US$ Mn) - By Application

Table 12. United Arab Emirates Bioreactors Market Revenue and Forecasts to 2030 (US$ Mn) - By Technology

Table 13. United Arab Emirates Bioreactors Market Revenue and Forecasts to 2030 (US$ Mn) - By End User

Table 14. Rest of Middle East & Africa Bioreactors Market Revenue and Forecasts to 2030 (US$ Mn) - By Scale

Table 15. Rest of Middle East & Africa Bioreactors Market Revenue and Forecasts to 2030 (US$ Mn) - By Application

Table 16. Rest of Middle East & Africa Bioreactors Market Revenue and Forecasts to 2030 (US$ Mn) - By Technology

Table 17. Rest of Middle East & Africa Bioreactors Market Revenue and Forecasts to 2030 (US$ Mn) - By End User

Table 18. Recent Inorganic Growth Strategies in the Bioreactors Market

Table 19. Recent Organic Growth Strategies in the Bioreactors Market

Table 20. Glossary of Terms, Bioreactors Market


List of Figures

Figure 1. Bioreactors Market Segmentation, By Country

Figure 2. Impact Analysis of Drivers and Restraints

Figure 3. Bioreactors Market Revenue (US$ Million), 2020 - 2030

Figure 4. Bioreactors Market Revenue Share, by Scale 2022 & 2030 (%)

Figure 5. Lab-Scale Production Market Revenue and Forecasts to 2030 (US$ Million)

Figure 6. Pilot-Scale Production Market Revenue and Forecasts to 2030 (US$ Million)

Figure 7. Full-Scale Production Market Revenue and Forecasts to 2030 (US$ Million)

Figure 8. Bioreactors Market Revenue Share, by Application 2022 & 2030 (%)

Figure 9. Microbial Application Market Revenue and Forecasts to 2030 (US$ Million)

Figure 10. Cell Culture Application Market Revenue and Forecasts to 2030 (US$ Million)

Figure 11. Others Market Revenue and Forecasts to 2030 (US$ Million)

Figure 12. Bioreactors Market Revenue Share, by Technology 2022 & 2030 (%)

Figure 13. Fed-Batch Bioreactors Market Revenue and Forecasts to 2030 (US$ Million)

Figure 14. Perfusion Bioreactors Market Revenue and Forecasts to 2030 (US$ Million)

Figure 15. Bioreactors Market Revenue Share, by End User 2022 & 2030 (%)

Figure 16. Biopharma Manufacturers Market Revenue and Forecasts to 2030 (US$ Million)

Figure 17. Research and Development Organizations Market Revenue and Forecasts to 2030 (US$ Million)

Figure 18. Contract Manufacturing Organization Market Revenue and Forecasts to 2030 (US$ Million)

Figure 19. Middle East & Africa: Bioreactors Market, by Key Country - Revenue (2022) (US$ Million)

Figure 20. Middle East & Africa Bioreactors Market Breakdown by Key Countries, 2022 and 2030 (%)

Figure 21. Saudi Arabia Bioreactors Market Revenue and Forecasts to 2030 (US$ Mn)

Figure 22. South Africa Bioreactors Market Revenue and Forecasts to 2030 (US$ Mn)

Figure 23. United Arab Emirates Bioreactors Market Revenue and Forecasts to 2030 (US$ Mn)

Figure 24. Rest of Middle East & Africa Bioreactors Market Revenue and Forecasts to 2030 (US$ Mn)

Figure 25. Growth Strategies in the Bioreactors Market


1. Thermo Fisher Scientific Inc

2. General Electric Co

3. Merck KGaA

4. Pall Corp

5. PBS Biotech Inc

6. Sartorius AG

7. Solaris Biotechnology SRL


  • Save and reduce time carrying out entry-level research by identifying the growth, size, leading players, and segments in the Middle East & Africa bioreactors market.
  • Highlights key business priorities in order to assist companies to realign their business strategies.
  • The key findings and recommendations highlight crucial progressive industry trends in the Middle East & Africa bioreactors market, thereby allowing players across the value chain to develop effective long-term strategies.
  • Develop/modify business expansion plans by using substantial growth offering developed and emerging markets.
  • Scrutinize in-depth Middle East & Africa market trends and outlook coupled with the factors driving the Middle East & Africa bioreactors market, as well as those hindering it.
  • Enhance the decision-making process by understanding the strategies that underpin commercial interest with respect to client products, segmentation, pricing, and distribution.
Report Code
Full Name
Country Name
Email Id
Phone Number
Job Title
Company
Requirement

Note : Your data will never be shared with third parties, however, we may send you information from time to time about our products that may be of interest to you. By submitting your details, you agree to be contacted by us. You may contact us at any time to opt-out.


Purchase Options
Single User License
$3550
$2840
Site License
$4550
$3640
Enterprise License
$5550
$4440