欧洲绘图软件市场预测至 2028 年 - 按部署类型(云和本地)、企业规模(中小企业和大型企业)和应用程序(教育机构、企业和个人)划分的 COVID-19 影响和区域分析)

TIPRE00025754 | Pages: 83 | Technology, Media and Telecommunications | Nov 2021 | Type: Regional | Status: Published

市场介绍

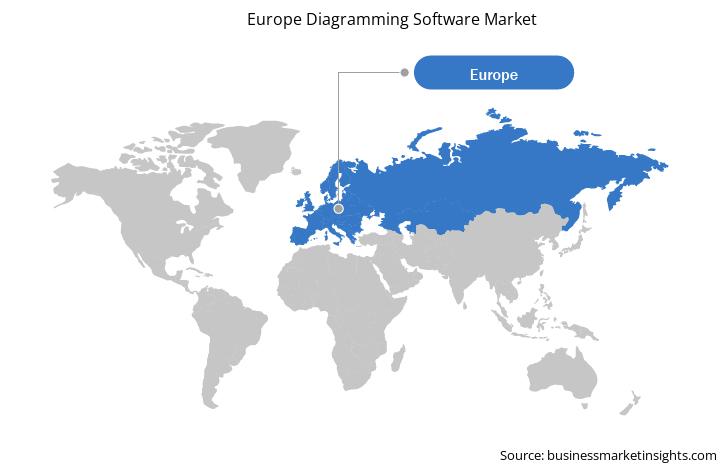
欧洲的图表软件市场细分为法国、德国、俄罗斯、意大利、英国等欧洲的。与北欧和东欧国家相比,西欧国家更加发达,技术先进。德国、挪威、芬兰、瑞典、荷兰、丹麦、瑞士和英国在国家技术实力方面处于强势地位,这有助于开发行业先进技术和软件。预计这将促进图表软件市场的增长。目前,每个组织都有部门,其中的工作主要围绕PowerPoint演示文稿和Excel表格,以及以图表和图形的形式易于理解的最简单的数据表示。大型企业和中小企业对可视化数据的需求以及图表软件的易用性预计将推动该地区的图表软件市场。欧洲图表软件市场的公司注重将并购作为在全球范围内提升品牌价值的主要策略。这些参与者还采用收购和合作等无机增长战略,与其他提供商建立业务关系,从而提高现有的市场地位。 2019 年 3 月,英国组织 Visirule 将人工智能与其图表软件平台集成。该地区的国家拥有最好的管理系统,再加上教育机构和企业部门的流行趋势,正在推动对图表软件的需求,从而导致该地区软件部署的增加。先进学习软件的使用越来越多,以及一些国家的外国和本地学生的增加,正在推动教育机构应用中对图表软件的需求。例如,英国是全球继续教育中心,这为在该国部署图表软件等先进教育系统创造了巨大的机会。


在欧洲, COVID-19大流行对不同国家有不同的影响,因为只有部分国家出现了COVID-19病例数量的上升,并随后实施了严格且长期的封锁和社会隔离规范。然而,由于医疗保健系统健全,德国、法国、俄罗斯和英国等西欧国家的增长活动相对温和。该地区突然爆发的新型冠状病毒肺炎(COVID-19)不仅导致企业运营停滞,还导致该地区多家中小企业倒闭。欧洲整个地区的技术投资有所下降。 但是,该地区企业越来越多地采用远程工作,这产生了对图表软件的需求,以便在组织之间有效地沟通工作流程和项目资助图。医疗保健行业对图表软件的需求也在不断增长,以实现该地区医生和护士之间的沟通治疗和疫苗接种程序。因此,COVID-19 的爆发大流行促进了欧洲图表软件市场的增长。

市场概况和动态

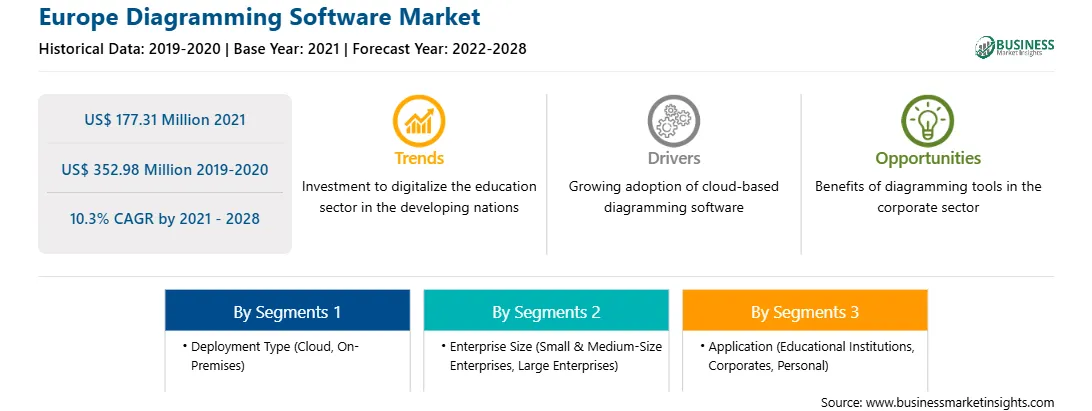
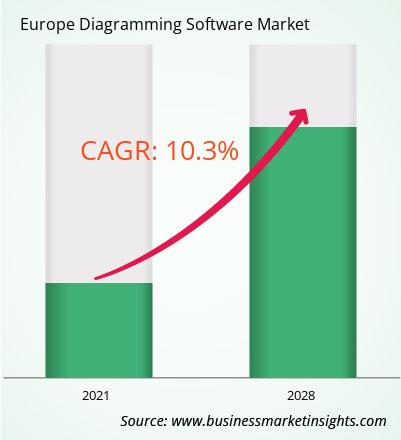
欧洲制图软件市场预计将从2021年的1.7731亿美元增长到2028年的3.5298亿美元;预计 2021 年至 2028 年复合年增长率为 10.3%。先进技术与图表软件的结合;文档和图表自动化在各行各业中得到广泛采用,以消除重复的人工工作。人工智能 (AI) 等技术与图表软件集成,可自动创建流程图、组织结构图、映射图和工作流程。人工智能等先进技术与图表解决方案的集成,可以根据预先输入的标准实现图表创建和更新的自动化。例如,亿图软件提供了基于矢量的自动组织结构图制作解决方案,使企业能够创建各种格式的组织结构图,例如基本组织结构图、照片组织结构图、家谱、自定义组织结构图和人员组织结构图。该解决方案与人力资源系统集成,并自动根据此类系统上的信息和职称生成图表。当员工离开组织时,该解决方案还会自动更新信息。这些优势预计将影响技术先进的图表软件的采用。因此,预计上述因素将在预测期内推动欧洲图表软件市场的增长。这促进了图表软件市场的增长。


关键市场细分

根据部署类型,图表软件市场可以分为云和本地。 2020 年,云细分市场占据欧洲图表软件市场最大份额。根据企业规模,图表软件市场分为小型和大型。中型企业和大型企业。 2020 年,大型企业细分市场在欧洲制图软件市场中占据最大份额。根据用途,图表软件可分为教育机构、企业和个人。企业部门在 2020 年贡献了相当大的份额。

主要来源和上市公司

一些主要的一手和二手来源准备本欧洲图表软件市场报告所参考的资料包括公司网站、年度报告、财务报告、国家政府文件和统计数据库等。报告中列出的主要公司有CREATELY (CINERGIX PTY LTD); DRAW.IO(//SEIBERT/MEDIA GMBH);亿图软件; Gliffy(Perforce 软件公司); Lucid 软件公司;微软公司;米罗; MYDRAW(NEVRON 软件有限责任公司);努拉布公司; Samepage.io;和 SmartDraw, LLC 等

购买报告的理由

  • 了解欧洲图表软件市场格局,并确定最有可能保证丰厚回报的细分市场
  • 通过了解不断变化的趋势,在竞争中保持领先地位-改变欧洲图表软件市场的竞争格局
  • 通过确定最有可能销售的细分市场,有效规划欧洲图表软件市场的并购和合作伙伴交易
  • 帮助吸收知识丰富的人才通过对欧洲图表软件市场各个细分市场的市场表现进行敏锐和全面的分析来制定业务决策
  • 获取欧洲地区 2021-2028 年各个细分市场的市场收入预测

欧洲图表软件市场细分

按部署类型

  • 本地


企业规模

  • 中小企业
  • 大型企业

申请

  • 企业
  • 教育机构
  • 个人

按国家/地区

  • 德国
  • 英国
  • 法国
  • 意大利
  • 俄罗斯
  • 俄罗斯
  • 法国
  • 意大利
  • 俄罗斯
  • li>
  • 欧盟其他地区

公司简介

  • CREATELY (CINERGIX PTY LTD)
  • DRAW.IO (//SEIBERT/MEDIA GMBH)
  • Edrawsoft
  • Gliffy(Perforce Software, Inc.)
  • Lucid Software Inc
  • 微软公司
  • Miro
  • MYDRAW(NEVRON SOFTWARE LLC)
  • Nulab Inc
  • Samepage.io
  • SmartDraw, LLC
 

TABLE OF CONTENTS

1.           Introduction

1.1         Study Scope

1.2         The Insight Partners Research Report Guidance

1.3         Market Segmentation

2.           Key Takeaways

3.           Research Methodology

3.1         Coverage

3.2         Secondary Research

3.3         Primary Research

4.           Europe Diagramming Software Market Landscape

4.1         Market Overview

4.2         PEST Analysis

4.2.1        Europe

4.3         Ecosystem Analysis

4.4         Expert Opinion

5.           Europe Diagramming Software Market – Key Market Dynamics

5.1         Market Drivers

5.1.1        Rising Adoption of Diagramming Software Across Large Enterprises

5.1.2        Increasing Adoption of Cloud-Based Diagramming Software across Organizations

5.2         Market Restraints

5.2.1        Prevalence of Freely Available Diagramming Solutions

5.3         Market Opportunities

5.3.1        Combination of Advanced Technologies with Diagramming Software

5.4         Future Trends

5.4.1        Strategic initiatives by Major Players

5.5         Impact Analysis of Drivers and Restraints

6.           Diagramming Software Market – Europe Analysis

6.1         Diagramming Software Market Europe Overview

6.2         Europe Diagramming Software Market –Revenue and Forecast to 2028 (US$ Million)

7.           Europe Diagramming Software Market– By Deployment Type

7.1         Overview

7.2         Europe Diagramming Software Market, by Deployment Type (2020 and 2028)

7.3         Cloud

7.3.1        Overview

7.3.2        Cloud: Europe Diagramming Software Market – Revenue and Forecast to 2028 (US$ Million)

7.4         On-Premises

7.4.1        Overview

7.4.2        On-premises: Europe Diagramming Software Market – Revenue and Forecast to 2028 (US$ Million)

8.           Europe Diagramming Software Market – By Enterprise Size

8.1         Overview

8.2         Europe Diagramming Software Market, by Enterprise Size (2020 and 2028)

8.3         SMEs

8.3.1        Overview

8.3.2        SMEs: Europe Diagramming Software Market – Revenue and Forecast to 2028 (US$ Million)

8.4         Large Enterprises

8.4.1        Overview

8.4.2        Large Enterprises: Europe Diagramming Software Market – Revenue and Forecast to 2028 (US$ Million)

9.           Europe Diagramming Software Market – By Application

9.1         Overview

9.2         Europe Diagramming Software Market, by Application (2020 and 2028)

9.3         Educational Institutions

9.3.1        Overview

9.3.2        Educational Institutions: Europe Diagramming Software Market – Revenue and Forecast to 2028 (US$ Million)

9.4         Corporates

9.4.1        Overview

9.4.2        Corporates: Europe Diagramming Software Market – Revenue and Forecast to 2028 (US$ Million)

9.5         Personal

9.5.1        Overview

9.5.2        Personal: Europe Diagramming Software Market – Revenue and Forecast to 2028 (US$ Million)

10.        Europe Diagramming Software Market – Country Analysis

10.1      Europe: Diagramming Software Market

10.1.1     Europe: Diagramming Software Market- by Key Country

10.1.1.1       Germany: Diagramming Software Market – Revenue and Forecast to 2028 (US$ Million)

10.1.1.1.1       Germany: Diagramming Software Market- By Deployment Type

10.1.1.1.2       Germany: Diagramming Software Market- By Enterprise Size

10.1.1.1.3       Germany: Diagramming Software Market- By Application

10.1.1.2       France: Diagramming Software Market – Revenue and Forecast to 2028 (US$ Million)

10.1.1.2.1       France: Diagramming Software Market- By Deployment Type

10.1.1.2.2       France: Diagramming Software Market- By Enterprise Size

10.1.1.2.3       France: Diagramming Software Market- By Application

10.1.1.3       Italy: Diagramming Software Market – Revenue and Forecast to 2028 (US$ Million)

10.1.1.3.1       Italy: Diagramming Software Market- By Deployment Type

10.1.1.3.2       Italy: Diagramming Software Market- By Enterprise Size

10.1.1.3.3       Italy: Diagramming Software Market- By Application

10.1.1.4       UK: Diagramming Software Market – Revenue and Forecast to 2028 (US$ Million)

10.1.1.4.1       UK: Diagramming Software Market- By Deployment Type

10.1.1.4.2       UK: Diagramming Software Market- By Enterprise Size

10.1.1.4.3       UK: Diagramming Software Market- By Application

10.1.1.5       Russia: Diagramming Software Market – Revenue and Forecast to 2028 (US$ Million)

10.1.1.5.1       Russia: Diagramming Software Market- By Deployment Type

10.1.1.5.2       Russia: Diagramming Software Market- By Enterprise Size

10.1.1.5.3       Russia: Diagramming Software Market- By Application

10.1.1.6       Rest of Europe: Diagramming Software Market – Revenue and Forecast to 2028 (US$ Million)

10.1.1.6.1       Rest of Europe: Diagramming Software Market- By Deployment Type

10.1.1.6.2       Rest of Europe: Diagramming Software Market- By Enterprise Size

10.1.1.6.3       Rest of Europe: Diagramming Software Market- By Application

11.        Impact of COVID-19 Pandemic on Europe Diagramming Software Market

11.1      Europe: Impact Assessment of COVID-19 Pandemic

12.        Europe Diagramming Software Market- Industry Landscape

12.1      Overview

12.2      New Product Development

13.        Company Profiles

13.1      CREATELY (CINERGIX PTY LTD)

13.1.1     Key Facts

13.1.2     Business Description

13.1.3     Products and Services

13.1.4     Financial Overview

13.1.5     SWOT Analysis

13.1.6     Key Developments

13.2      Microsoft Corporation

13.2.1     Key Facts

13.2.2     Business Description

13.2.3     Products and Services

13.2.4     Financial Overview

13.2.5     SWOT Analysis

13.2.6     Key Developments

13.3      SmartDraw, LLC

13.3.1     Key Facts

13.3.2     Business Description

13.3.3     Products and Services

13.3.4     Financial Overview

13.3.5     SWOT Analysis

13.3.6     Key Developments

13.4      DRAW.IO (//SEIBERT/MEDIA GMBH)

13.4.1     Key Facts

13.4.2     Business Description

13.4.3     Products and Services

13.4.4     Financial Overview

13.4.5     SWOT Analysis

13.4.6     Key Developments

13.5      MYDRAW (NEVRON SOFTWARE LLC)

13.5.1     Key Facts

13.5.2     Business Description

13.5.3     Products and Services

13.5.4     Financial Overview

13.5.5     SWOT Analysis

13.5.6     Key Developments

13.6      Edrawsoft

13.6.1     Key Facts

13.6.2     Business Description

13.6.3     Products and Services

13.6.4     Financial Overview

13.6.5     SWOT Analysis

13.6.6     Key Developments

13.7      Gliffy (Perforce Software, Inc.)

13.7.1     Key Facts

13.7.2     Business Description

13.7.3     Products and Services

13.7.4     Financial Overview

13.7.5     SWOT Analysis

13.7.6     Key Developments

13.8      Lucid Software Inc.

13.8.1     Key Facts

13.8.2     Business Description

13.8.3     Products and Services

13.8.4     Financial Overview

13.8.5     SWOT Analysis

13.8.6     Key Developments

13.9      Nulab Inc.

13.9.1     Key Facts

13.9.2     Business Description

13.9.3     Products and Services

13.9.4     Financial Overview

13.9.5     SWOT Analysis

13.9.6     Key Developments

13.10   Samepage.io

13.10.1  Key Facts

13.10.2  Business Description

13.10.3  Products and Services

13.10.4  Financial Overview

13.10.5  SWOT Analysis

13.10.6  Key Developments

13.11   Miro

13.11.1  Key Facts

13.11.2  Business Description

13.11.3  Products and Services

13.11.4  Financial Overview

13.11.5  SWOT Analysis

13.11.6  Key Developments

14.        Appendix

14.1      About The Insight Partners

14.2      Word Index

LIST OF TABLES

Table 1.             Europe Diagramming Software Market – Revenue and Forecast to 2028 (US$ Million)

Table 2.             Germany: Diagramming Software Market- By Deployment Type –Revenue and Forecast to 2028 (US$ Million)

Table 3.             Germany: Diagramming Software Market- By Enterprise Size –Revenue and Forecast to 2028 (US$ Million)

Table 4.             Germany: Diagramming Software Market- By Application –Revenue and Forecast to 2028 (US$ Million)

Table 5.             France: Diagramming Software Market- By Deployment Type –Revenue and Forecast to 2028 (US$ Million)

Table 6.             France: Diagramming Software Market- By Enterprise Size –Revenue and Forecast to 2028 (US$ Million)

Table 7.             France: Diagramming Software Market- By Application –Revenue and Forecast to 2028 (US$ Million)

Table 8.             Italy: Diagramming Software Market- By Deployment Type –Revenue and Forecast to 2028 (US$ Million)

Table 9.             Italy: Diagramming Software Market- By Enterprise Size –Revenue and Forecast to 2028 (US$ Million)

Table 10.          Italy: Diagramming Software Market- By Application –Revenue and Forecast to 2028 (US$ Million)

Table 11.          UK: Diagramming Software Market- By Deployment Type –Revenue and Forecast to 2028 (US$ Million)

Table 12.          UK: Diagramming Software Market- By Enterprise Size –Revenue and Forecast to 2028 (US$ Million)

Table 13.          UK: Diagramming Software Market- By Application –Revenue and Forecast to 2028 (US$ Million)

Table 14.          Russia: Diagramming Software Market- By Deployment Type –Revenue and Forecast to 2028 (US$ Million)

Table 15.          Russia: Diagramming Software Market- By Enterprise Size –Revenue and Forecast to 2028 (US$ Million)

Table 16.          Russia: Diagramming Software Market- By Application –Revenue and Forecast to 2028 (US$ Million)

Table 17.          Rest of Europe: Diagramming Software Market- By Deployment Type –Revenue and Forecast to 2028 (US$ Million)

Table 18.          Rest of Europe: Diagramming Software Market- By Enterprise Size –Revenue and Forecast to 2028  (US$ Million)

Table 19.          Rest of Europe: Diagramming Software Market- By Application –Revenue and Forecast to 2028 (US$ Million)

Table 20.          List of Abbreviation

LIST OF FIGURES

Figure 1.           Europe Diagramming Software Market Segmentation

Figure 2.           Europe Diagramming Software Market Segmentation – By Country

Figure 3.           Europe Diagramming Software Market Overview

Figure 4.           Cloud Segment Held the Largest Market Share in 2020

Figure 5.           Large Enterprises Segment Held the Largest Market Share in 2020

Figure 6.           Corporates Application Held the Largest Market Share in 2020

Figure 7.           Germany was the Largest Revenue Contributor in 2020

Figure 8.           Europe: PEST Analysis

Figure 9.           Expert Opinion

Figure 10.        Europe Diagramming Software Market Impact Analysis of Drivers and Restraints

Figure 11.        Europe Diagramming Software Market – Revenue and Forecast to 2028 (US$ Million)

Figure 12.        Europe Diagramming Software Market Revenue Share, by Deployment Type (2020 and 2028)

Figure 13.        Cloud: Europe Diagramming Software Market – Revenue and Forecast to 2028 (US$ Million)

Figure 14.        On-premises: Europe Diagramming Software Market – Revenue and Forecast to 2028 (US$ Million)

Figure 15.        Europe Diagramming Software Market Revenue Share, by Enterprise Size (2020 and 2028)

Figure 16.        SMEs: Europe Diagramming Software Market – Revenue and Forecast to 2028 (US$ Million)

Figure 17.        Large Enterprises: Europe Diagramming Software Market – Revenue and Forecast to 2028 (US$ Million)

Figure 18.        Europe Diagramming Software Market Revenue Share, by Application (2020 and 2028)

Figure 19.        Educational Institutions: Europe Diagramming Software Market – Revenue and Forecast to 2028 (US$ Million)

Figure 20.        Corporates: Europe Diagramming Software Market – Revenue and Forecast to 2028 (US$ Million)

Figure 21.        Personal: Europe Diagramming Software Market – Revenue and Forecast to 2028 (US$ Million)

Figure 22.        Europe: Diagramming Software Market – Revenue by Country to 2028 (US$ Million)

Figure 23.        Europe: Diagramming Software Market Revenue Share, By Key Country (2020 and 2028)

Figure 24.        Germany: Diagramming Software Market – Revenue and Forecast to 2028 (US$ Million)

Figure 25.        France: Diagramming Software Market – Revenue and Forecast to 2028 (US$ Million)

Figure 26.        Italy: Diagramming Software Market – Revenue and Forecast to 2028 (US$ Million)

Figure 27.        UK: Diagramming Software Market – Revenue and Forecast to 2028 (US$ Million)

Figure 28.        Russia: Diagramming Software Market – Revenue and Forecast to 2028 (US$ Million)

Figure 29.        Rest of Europe: Diagramming Software Market – Revenue and Forecast to 2028 (US$ Million)

Figure 30.        Impact of COVID-19 Pandemic in Europe Country Markets


  1. CREATELY (CINERGIX PTY LTD)
  2. DRAW.IO (//SEIBERT/MEDIA GMBH)
  3. Edrawsoft
  4. Gliffy (Perforce Software, Inc.)
  5. Lucid Software Inc
  6. Microsoft Corporation
  7. Miro
  8. MYDRAW (NEVRON SOFTWARE LLC)
  9. Nulab Inc
  10. Samepage.io
  11. SmartDraw, LLC
  • To understand the Europe diagramming software market landscape and identify market segments that are most likely to guarantee a strong return
  • Stay ahead of the race by comprehending the ever-changing competitive landscape for Europe diagramming software market
  • Efficiently plan M&A and partnership deals in Europe diagramming software market by identifying market segments with the most promising probable sales
  • Helps to take knowledgeable business decisions from perceptive and comprehensive analysis of market performance of various segment form Europe diagramming software market
  • Obtain market revenue forecast for market by various segments from 2021-2028 in Europe region.
Report Code
Full Name
Country Name
Email Id
Phone Number
Job Title
Company
Requirement

Note : Your data will never be shared with third parties, however, we may send you information from time to time about our products that may be of interest to you. By submitting your details, you agree to be contacted by us. You may contact us at any time to opt-out.


Purchase Options
Single User License
$3000
$1800
Site License
$4000
$2400
Enterprise License
$5000
$3000