Analysis - by Type (Fully Rugged Tablet, Semi Rugged Tablet, and Ultra Rugged Tablet), Operating System (Android, Windows, and iOS), and Application (Aerospace & Defense, Automotive, Construction, Energy & Utilities, Manufacturing, Oil & Gas, and Others)
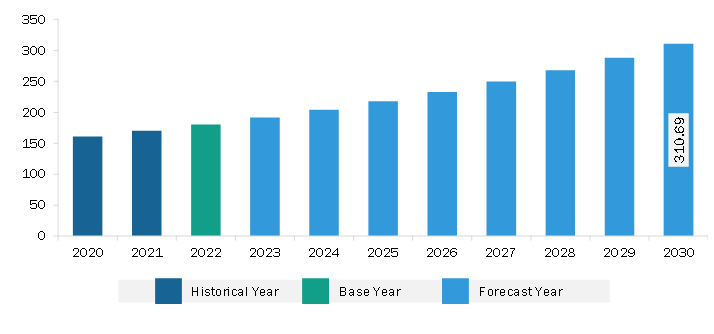
The Asia Pacific rugged tablet market was valued at US$ 180.45 million in 2022 and is expected to reach US$ 310.69 million by 2030; it is estimated to grow at a CAGR of 7.0% from 2022 to 2030.
Rise of New Technologies, such as AI and IoT Boost Asia Pacific Rugged Tablet Market
AI-enabled devices are all over the place. According to Simpli Learn, AI technology is used in some form or another in over 77% of today's electronics. Moreover, Rugged tablet computers can gather and send data from numerous sensors and devices in the field regarding IoT. These tablets may be fitted with specific data collection and analysis software, making it more straightforward to monitor and manage IoT devices remotely. For instance, a rugged tablet can be used to track the whereabouts of a fleet of cars, operate industrial machinery, and check the temperature and humidity levels in a warehouse.
Rugged tablets can also be integrated with AI devices for safety. Various authorities are using collaborated rugged tablets for school safety, government buildings, and other public spaces. For instance, in October 2023, KYOCERA collaborated with three technology developers on an innovative solution to improve safety in schools, government buildings, and other public spaces. Kyocera's ultra-rugged mobile technology (Android smartphones and tablets); Omni-Response 360° sensory technology for optimal situational awareness with a comprehensive dashboard; ZeroEyes AI gun detection and intelligent situational awareness software; and Cradlepoint networks that connect sites, vehicles, IoT technology, and safety personnel comprise the school safety solution. Thus, the rise of new technologies, such as AI and IoT, is expected to offer lucrative opportunities for market growth.
Asia Pacific Rugged Tablet Market Overview
Several market players across India launch rugged tablets. In December 2021, Panasonic India launched the Toughbook S1 rugged tablet for the Indian market. The tablet Toughbook FZ-S1 runs Android Enterprise. It includes a 7-inch display that can be seen outside. It has the Android 10.0 operating system installed. The tablet can function in a wide temperature range of -20°C to 50°C and is drop-resistant. In February 2019, Samsung launched the Galaxy Tab Active 2 with a military-grade rugged design and durability for harsh work environments.
Surveyors in the Australian Outback rely on rugged mobile technology to navigate and map remote regions in paperless field surveys. Central Australia's Cooper Basin is a harsh, isolated desert region roughly the size of Greece. Bulldust from the desert winds blows across the arid plains and dunes, and summer temperatures there can exceed 50°C. Crews from Terrex Spatial explore, map, and survey remote regions across Australia for clients in the coal seam gas, shale gas, oil & gas, geothermal, coal, and minerals industries. Terrex Spatial relies on the Algiz 10X rugged tablet PC to guide its operations. Thus, all the factors mentioned above propel the rugged tablet growth in Asia Pacific.
Asia Pacific Rugged Tablet Market Revenue and Forecast to 2030 (US$ Million)
Asia Pacific Rugged Tablet Market Segmentation
The Asia Pacific rugged tablet market is segmented based on type, operating system, application, and country. Based on type, the Asia Pacific rugged tablet market is segmented into fully rugged tablet, semi rugged tablet, and ultra rugged tablet. The fully rugged tablet segment held the largest market share in 2022.
In terms of operating system, the Asia Pacific rugged tablet market is segmented into android, windows, and iOS. The android segment held the largest market share in 2022.
By application, the Asia Pacific rugged tablet market is categorized into aerospace & defense, automotive, construction, energy & utilities, manufacturing, oil & gas, and others. The aerospace & defense segment held the largest market share in 2022.
Based on country, the Asia Pacific rugged tablet market is segmented into China, India, Japan, Australia, South Korea, Indonesia, Singapore, Malaysia, Thailand, Philippines, Vietnam, and the Rest of Asia Pacific. China dominated the Asia Pacific rugged tablet market share in 2022.
AAEON Technology Inc, Dell Technologies Inc, Panasonic Holdings Corp, Getac Holdings Corp, MilDef Group AB, DT Research Inc, NEXCOM International Co Ltd, Zebra Technologies Corp, and Kontron AG are some of the leading players operating in the Asia Pacific rugged tablet market.
Asia Pacific Rugged Tablet Market Strategic Insights
Get more information on this report
Asia Pacific Rugged Tablet Market Segmentation Analysis
Asia Pacific Rugged Tablet Market Report Highlights
Asia Pacific Rugged Tablet Report Scope
Report Attribute
Details
Market size in 2022
US$ 180.45 Million
Market Size by 2030
US$ 310.69 Million
CAGR (2022 - 2030)
7.0%
Historical Data
2020-2021
Forecast period
2023-2030
Segments Covered
By Type
Fully Rugged Tablet
Semi Rugged Tablet
Ultra Rugged Tablet
By Operating System
Android
Windows
iOS
By Application
Aerospace & Defense
Automotive
Construction
Energy & Utilities
Manufacturing
Oil & Gas
Regions and Countries Covered
Asia-Pacific
China, India, Japan, Australia, Rest of Asia-Pacific
Market leaders and key company profiles
AAEON Technology Inc
Dell Technologies Inc
DT Research Inc
Panasonic Holdings Corp
Getac Holdings Corp
MilDef Group AB
NEXCOM International Co Ltd
Zebra Technologies Corp
Kontron AG
Get more information on this report
Asia Pacific Rugged Tablet Market Country and Regional Insights
Get more information on this report
Identical Market Reports with other Region/Countries
The List of Companies - Asia Pacific Rugged Tablet Market
1. AAEON Technology Inc 2. Dell Technologies Inc3. DT Research Inc4. Panasonic Holdings Corp5. Getac Holdings Corp6. MilDef Group AB7. NEXCOM International Co Ltd8. Zebra Technologies Corp9. Kontron AG
Frequently Asked Questions
How big is the Asia Pacific Rugged Tablet Market?
The Asia Pacific Rugged Tablet Market is valued at US$ 180.45 Million in 2022, it is projected to reach US$ 310.69 Million by 2030.
What is the CAGR for Asia Pacific Rugged Tablet Market by (2022 - 2030)?
As per our report Asia Pacific Rugged Tablet Market, the market size is valued at US$ 180.45 Million in 2022, projecting it to reach US$ 310.69 Million by 2030. This translates to a CAGR of approximately 7.0% during the forecast period.
What segments are covered in this report?
The Asia Pacific Rugged Tablet Market report typically cover these key segments-
Type (Fully Rugged Tablet, Semi Rugged Tablet, Ultra Rugged Tablet)
What is the historic period, base year, and forecast period taken for Asia Pacific Rugged Tablet Market?
The historic period, base year, and forecast period can vary slightly depending on the specific market research report. However, for the Asia Pacific Rugged Tablet Market report:
Historic Period : 2020-2021
Base Year : 2022
Forecast Period : 2023-2030
Who are the major players in Asia Pacific Rugged Tablet Market?
The Asia Pacific Rugged Tablet Market is populated by several key players, each contributing to its growth and innovation. Some of the major players include:
AAEON Technology Inc
Dell Technologies Inc
DT Research Inc
Panasonic Holdings Corp
Getac Holdings Corp
MilDef Group AB
NEXCOM International Co Ltd
Zebra Technologies Corp
Kontron AG
Who should buy this report?
The Asia Pacific Rugged Tablet Market report is valuable for diverse stakeholders, including:
Investors: Provides insights for investment decisions pertaining to market growth, companies, or industry insights. Helps assess market attractiveness and potential returns.
Industry Players: Offers competitive intelligence, market sizing, and trend analysis to inform strategic planning, product development, and sales strategies.
Suppliers and Manufacturers: Helps understand market demand for components, materials, and services related to concerned industry.
Researchers and Consultants: Provides data and analysis for academic research, consulting projects, and market studies.
Financial Institutions: Helps assess risks and opportunities associated with financing or investing in the concerned market.
Essentially, anyone involved in or considering involvement in the Asia Pacific Rugged Tablet Market value chain can benefit from the information contained in a comprehensive market report.


 Get Free Sample For Asia Pacific Rugged Tablet Market


