Analysis - by Form (Fresh and Processed), Category (Organic and Conventional), and Application (Functional Food and Beverages, Pharmaceuticals and Nutraceuticals, Personal Care and Cosmetics, and Animal Nutrition)
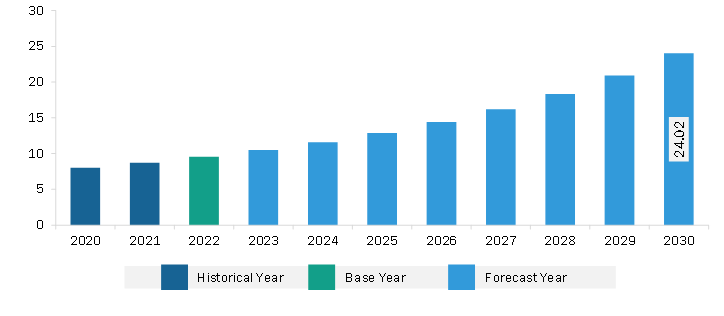
The Asia Pacific maqui berries market is expected to grow from US$ 9.56 million in 2022 to US$ 24.02 million by 2030. It is estimated to record a CAGR of 12.2% from 2022 to 2030.
Development of Medicines with Maqui Berry Extracts that Support Eye Health Boosts Asia Pacific Maqui Berries Market
Dry eye happens when tear glands in the eyes do not make enough tears to stay wet and lubricated. This causes irritation in the eyes, redness, sensitivity to light, blurry vision, and a stinging or burning feeling. Dry eyes, if left untreated, can cause severe eye inflammation, corneal ulcers, abrasion of corneal surface, and vision loss. Since maqui berries are antioxidant-rich superfruits, it is seen that they can help reduce dry eye symptoms by reducing inflammation, increasing natural tear production, and improving tear quality.
In 2015, scientists in Japan discovered that oral medication made from maqui berry extracts can alleviate dry eye syndrome without using commercial eye drops. These oral supplements support healthy tear fluid generation and is a safer alternative to artificial tears. The company also conducted trials to see the effect of MaquiBright extract on dry eye discomfort. The participants reported significant improvement in tear production and dry eye discomfort. Thus, the rising development of innovative medicines and supplements with maqui berry extracts that support eye health is expected to open lucrative opportunities for the Asia Pacific maqui berry market in the coming years.
Asia Pacific Maqui Berries Market Overview
Asia Pacific is one of the emerging markets for maqui berries. The Asia Pacific maqui berries market is segmented into China, Japan, India, Australia, South Korea, and the Rest of Asia Pacific. Countries such as South Korea, Australia, and Japan are among the major importers of maqui berries. The dietary supplement manufacturers targeting eye health are increasingly using maqui berries in their products due to the presence of anthocyanins and flavonoids in maqui berries. Anthocyanins reduce oxidative stress in the retina, reduce inflammation, provide antiallergic and antimicrobial effects, and support blood circulation through fine capillaries in the eye. Thus, the demand for maqui berries is rising in the eye supplements space. In February 2021, Nano Japan, a beauty and health supplements company, launched Nano Optivue, a liquid supplement containing lutein, astaxanthin, maqui berry extract, blackcurrant, vitamin B, quercetin, and kuromanin-10. The company claims that the supplement can reduce digital eye strain and fatigue and improve focus. Nano Japan is planning to expand its geographical reach across Southeast Asia with the launch of its products in markets, including Singapore, Malaysia, and Japan.
Further, skin care products with maqui berries as a key ingredient are witnessing heavy demand in Asia Pacific countries, especially South Korea, India, and Australia. People in the region are focusing on natural skin care due to rising awareness of the harmful effects of toxic chemicals present in skin care products and cosmetics. The preference for berry-infused products is increasing significantly due to their brightening, purifying, and antiaging effects. This factor is expected to provide immense opportunities for the maqui berries market in Asia Pacific in the coming years.
Asia Pacific Maqui Berries Market Revenue and Forecast to 2030 (US$ Million)
Asia Pacific Maqui Berries Market Segmentation
The Asia Pacific maqui berries market is segmented into form, category, application, and country.
Based on form, the Asia Pacific maqui berries market is bifurcated into fresh and processed. The processed segment held a larger share of the Asia Pacific maqui berries market in 2022.
In terms of category, the Asia Pacific maqui berries market is bifurcated into organic and conventional. The conventional segment held a larger share of the Asia Pacific maqui berries market in 2022.
By application, the Asia Pacific maqui berries market is segmented into functional food and beverage, pharmaceuticals and nutraceuticals, personal care and cosmetics, and animal nutrition. The functional food and beverage segment held the largest share of the Asia Pacific maqui berries market in 2022.
Based on country, the Asia Pacific maqui berries market is segmented into China, Japan, India, Australia, South Korea, and the Rest of Asia Pacific. The Rest of Asia Pacific dominated Asia Pacific maqui berries market in 2022.
HP Ingredients Corp, Jeeva Organic Pvt Ltd, Shaanxi LonierHerb Bio-Technology Co Ltd, and Xi'an Herb Bio-Tech Co Ltd are some of the leading companies operating in the Asia Pacific maqui berries market.
Asia Pacific Maqui Berries Market Strategic Insights
Get more information on this report
Asia Pacific Maqui Berries Market Segmentation Analysis
Asia Pacific Maqui Berries Market Report Highlights
Asia Pacific Maqui Berries Report Scope
Report Attribute
Details
Market size in 2022
US$ 9.56 Million
Market Size by 2030
US$ 24.02 Million
CAGR (2022 - 2030)
12.2%
Historical Data
2020-2021
Forecast period
2023-2030
Segments Covered
By Form
Fresh and Processed
By Category
Organic
Conventional
By Application
Functional Food and Beverages
Pharmaceuticals and Nutraceuticals
Personal Care and Cosmetics
Animal Nutrition
Regions and Countries Covered
Asia-Pacific
China, India, Japan, Australia, Rest of Asia-Pacific
Market leaders and key company profiles
HP Ingredients Corp
Jeeva Organic Pvt Ltd
Shaanxi LonierHerb Bio-Technology Co Ltd
Xi'an Herb Bio-Tech Co Ltd
Get more information on this report
Asia Pacific Maqui Berries Market Country and Regional Insights
Get more information on this report
Identical Market Reports with other Region/Countries
The List of Companies - Asia Pacific Maqui Berries Market
1. HP Ingredients Corp2. Jeeva Organic Pvt Ltd3. Shaanxi LonierHerb Bio-Technology Co Ltd4. Xi'an Herb Bio-Tech Co Ltd
Frequently Asked Questions
How big is the Asia Pacific Maqui Berries Market?
The Asia Pacific Maqui Berries Market is valued at US$ 9.56 Million in 2022, it is projected to reach US$ 24.02 Million by 2030.
What is the CAGR for Asia Pacific Maqui Berries Market by (2022 - 2030)?
As per our report Asia Pacific Maqui Berries Market, the market size is valued at US$ 9.56 Million in 2022, projecting it to reach US$ 24.02 Million by 2030. This translates to a CAGR of approximately 12.2% during the forecast period.
What segments are covered in this report?
The Asia Pacific Maqui Berries Market report typically cover these key segments-
Form (Fresh and Processed)
Category (Organic, Conventional)
Application (Functional Food and Beverages, Pharmaceuticals and Nutraceuticals, Personal Care and Cosmetics, Animal Nutrition)
What is the historic period, base year, and forecast period taken for Asia Pacific Maqui Berries Market?
The historic period, base year, and forecast period can vary slightly depending on the specific market research report. However, for the Asia Pacific Maqui Berries Market report:
Historic Period : 2020-2021
Base Year : 2022
Forecast Period : 2023-2030
Who are the major players in Asia Pacific Maqui Berries Market?
The Asia Pacific Maqui Berries Market is populated by several key players, each contributing to its growth and innovation. Some of the major players include:
HP Ingredients Corp
Jeeva Organic Pvt Ltd
Shaanxi LonierHerb Bio-Technology Co Ltd
Xi'an Herb Bio-Tech Co Ltd
Who should buy this report?
The Asia Pacific Maqui Berries Market report is valuable for diverse stakeholders, including:
Investors: Provides insights for investment decisions pertaining to market growth, companies, or industry insights. Helps assess market attractiveness and potential returns.
Industry Players: Offers competitive intelligence, market sizing, and trend analysis to inform strategic planning, product development, and sales strategies.
Suppliers and Manufacturers: Helps understand market demand for components, materials, and services related to concerned industry.
Researchers and Consultants: Provides data and analysis for academic research, consulting projects, and market studies.
Financial Institutions: Helps assess risks and opportunities associated with financing or investing in the concerned market.
Essentially, anyone involved in or considering involvement in the Asia Pacific Maqui Berries Market value chain can benefit from the information contained in a comprehensive market report.


 Get Free Sample For Asia Pacific Maqui Berries Market


