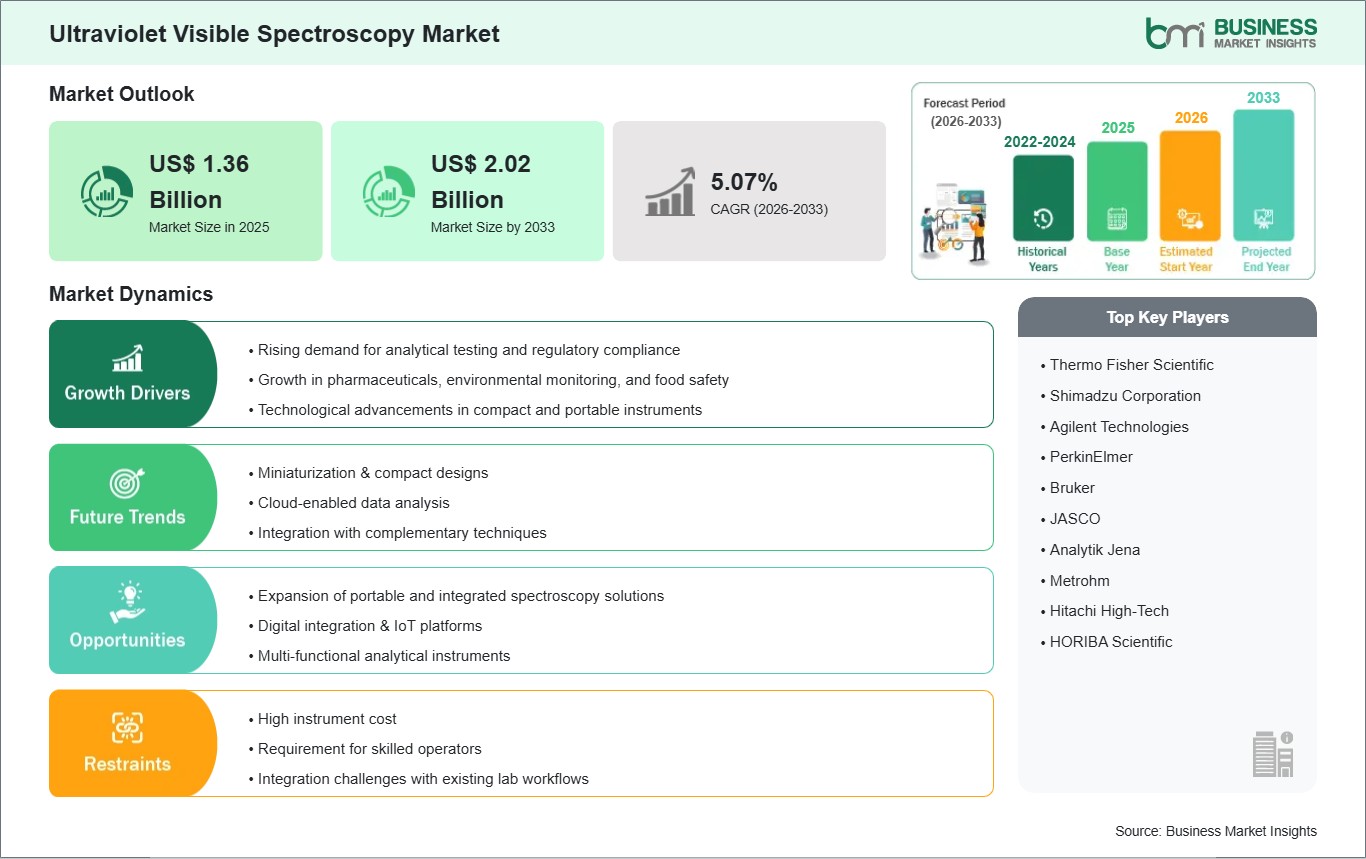
The Ultraviolet Visible Spectroscopy Market size is expected to reach US$ 2.02 billion by 2033 from US$ 1.36 billion in 2025. The market is estimated to record a CAGR of 5.07% from 2026 to 2033.
Executive Summary and Global Market Analysis:
The global ultraviolet visible (UV-Vis) spectroscopy market is witnessing steady growth, driven by demand across pharmaceuticals, environmental monitoring, food safety, and industrial quality control. UV-Vis spectroscopy is used for quantitative and qualitative chemical analysis by measuring light absorption in the ultraviolet and visible spectrum, making it fundamental in laboratories and industrial processes.
Growth is supported by quality assurance, regulatory compliance, and research advancements. In pharmaceuticals and biotechnology, UV-Vis systems are critical for drug development, formulation analysis, and validation. Environmental agencies use UV-Vis for water and air quality monitoring to support regulatory and sustainability initiatives.
Technological advancements, including compact/portable spectrometers, enhanced optics, and digital integration, expand applications. Modern instruments often feature advanced software for automation, data analysis, and remote operation. Integration with complementary analytical techniques enhances versatility.
Competitive dynamics focus on product innovation, expanded services, and strategic collaborations, improving sensitivity, reducing analysis time, and offering user-friendly interfaces for both research and routine testing.
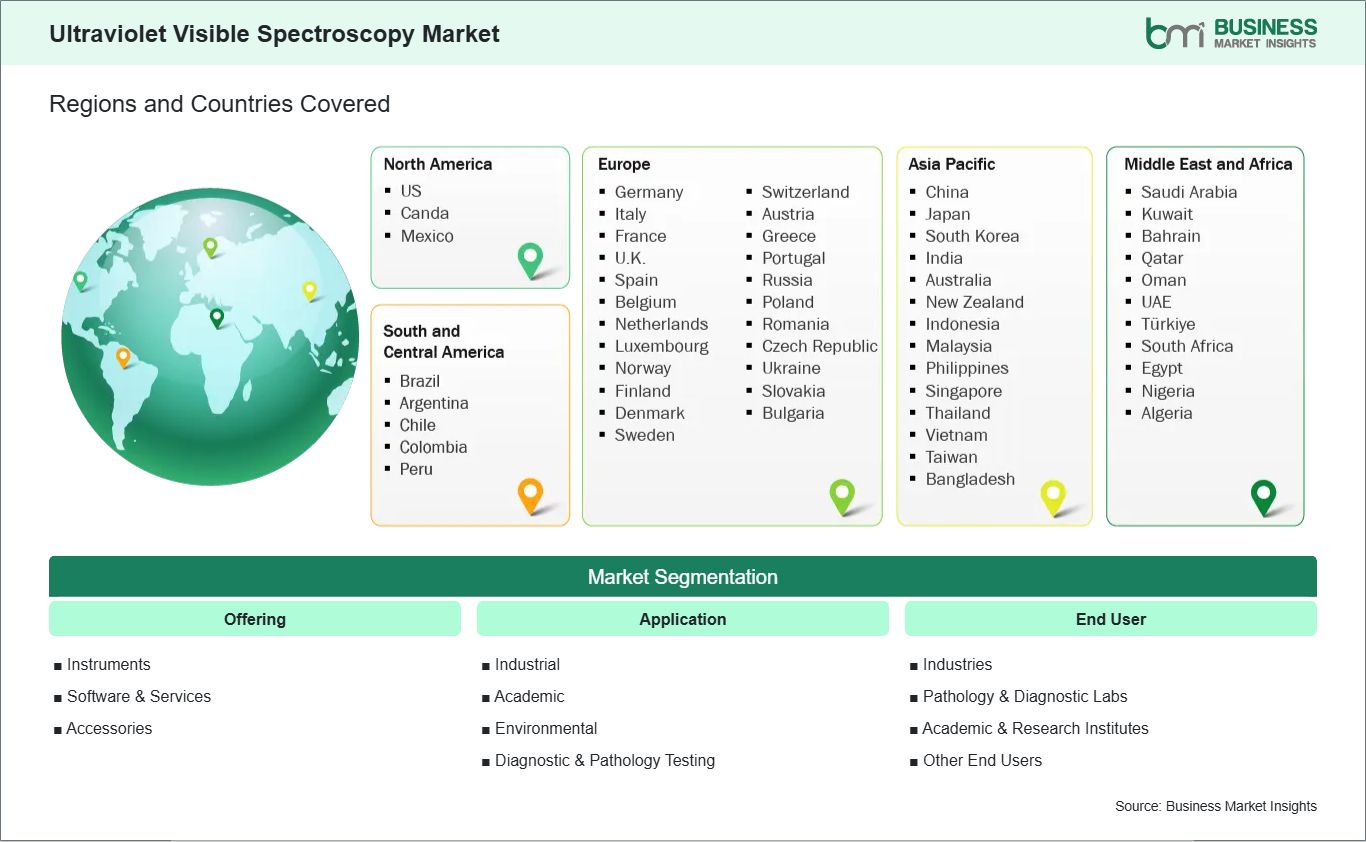
Key segments that contributed to the derivation of the ultraviolet visible spectroscopy market analysis are offering, application, and end user.
By offering, the ultraviolet visible spectroscopy market is segmented into instruments, software & services, and accessories. The instruments segment dominated the market in 2025.
In terms of application, the ultraviolet visible spectroscopy market is segmented into industrial, academic, environmental, and diagnostic & pathology testing. The industrial segment dominated the market in 2025.
By end user, the ultraviolet visible spectroscopy market is segmented into industries, pathology & diagnostic labs, academic & research institutes, and other end users. The industries segment dominated the market in 2025.
Ultraviolet Visible Spectroscopy Market Drivers and Opportunities:
Rising Demand for Analytical Testing and Regulatory Compliance
UV-Vis spectroscopy growth is driven by analytical testing needs and regulatory requirements across pharmaceuticals, food & beverage, environmental monitoring, and chemicals. It enables accurate measurements, impurity detection, and ensures compliance with quality and safety standards.
Pharmaceutical use includes active ingredient measurement, drug development, dissolution testing, and quality control. Environmental agencies use UV-Vis for water and air quality monitoring, chemical concentration measurement, and regulatory compliance.
Food safety applications involve measuring content to ensure regulatory compliance and detect adulteration. Automation and digital technologies reduce human error and increase production efficiency.
Expansion of Portable and Integrated Spectroscopy Solutions
Portable and integrated UV-Vis solutions allow field analysis, eliminating sample transport delays and enabling real-time decision-making. Applications include environmental monitoring, agriculture, food safety, and industrial QA/QC.
Integration with cloud computing, IoT, and mobile apps enhances remote monitoring, centralized data management, and compliance reporting. Combining UV-Vis with complementary techniques like IR spectroscopy or chromatography enables multifunctional analytical platforms.
Ultraviolet Visible Spectroscopy Market Size and Share Analysis:
The Ultraviolet Visible Spectroscopy Market demonstrates steady growth, with size and share analysis highlighting evolving trends and competitive dynamics among key players. The report examines subsegments categorized within offering, application, and end user, offering insights into their contribution to overall market performance.
By offering, the instruments subsegment dominated the market in 2025, driven by high demand for spectrophotometers and continuous advancements in optical performance and analytical capabilities.
By application, the industrial subsegment dominated the market in 2025, driven by extensive use in quality control, process monitoring, and material analysis across manufacturing industries.
By end user, the industries subsegment dominated the market in 2025, driven by widespread adoption across pharmaceuticals, chemicals, food & beverages, and environmental testing sectors.
Australia, China, India, Japan, South Korea, Indonesia, Malaysia, Philippines, Singapore, Thailand, Vietnam, Bangladesh, New Zealand, Taiwan
South and Central America
Brazil, Argentina, Peru, Chile, Colombia
Middle East and Africa
Bahrain, Kuwait, Oman, Qatar, Saudi Arabia, United Arab Emirates, Turkiye, South Africa, Egypt, Algeria, Nigeria
Market leaders and key company profiles
Thermo Fisher Scientific
Shimadzu Corporation
Agilent Technologies
PerkinElmer
Bruker
JASCO
Analytik Jena
Metrohm
Hitachi High-Tech
HORIBA Scientific
Get more information on this report
Ultraviolet Visible Spectroscopy Market Report Coverage and Deliverables:
The "Ultraviolet Visible Spectroscopy Market Size and Forecast (2022 - 2033)" report provides a detailed analysis of the market covering below areas:
Ultraviolet Visible Spectroscopy Market size and forecast at global, regional, and country levels for all the key market segments covered under the scope
Ultraviolet Visible Spectroscopy Market trends, as well as drivers, restraints, and opportunities
Ultraviolet Visible Spectroscopy Market analysis covering key trends, global and regional framework, major players, regulations, and recent developments
Industry landscape and competition analysis covering market concentration, heat map analysis, prominent players, and recent developments for the Ultraviolet Visible Spectroscopy Market
Detailed company profiles, including SWOT analysis
The geographical scope of the Ultraviolet Visible Spectroscopy Market report is divided into North America, Asia Pacific, Europe, Middle East & Africa, and South & Central America. North America held the largest share in 2025.
North America held a significant share in 2025, driven by strong presence of pharmaceutical and biotechnology industries, advanced research infrastructure, and stringent regulatory standards for quality and safety. The region benefits from continuous investments in R&D and early adoption of advanced analytical technologies.
Europe represents another major market, supported by robust environmental regulations, strong academic research networks, and well-established pharmaceutical and chemical industries. Countries such as Germany, the UK, and France emphasize quality control and sustainability, driving demand for UV-Vis spectroscopy systems.
The Asia Pacific region is expected to witness rapid growth due to expanding pharmaceutical manufacturing, increasing industrialization, and rising investments in research and education. Countries like China, India, and Japan are key contributors, with growing demand for analytical instruments in both industrial and academic sectors.
Middle East & Africa and South & Central America are emerging markets, where adoption is gradually increasing due to improvements in healthcare infrastructure, environmental monitoring initiatives, and industrial development. However, budget constraints and limited access to advanced technologies may moderate growth in these regions. Overall, regional growth is driven by the increasing need for analytical precision, regulatory compliance, and advancements in scientific research.
Get more information on this report
Ultraviolet Visible Spectroscopy Market Research Report Guidance:
The report includes qualitative and quantitative data in the Ultraviolet Visible Spectroscopy Market across type, application, industry, and geography.
The report starts with key takeaways (chapter 2), highlighting key trends and outlook of the Ultraviolet Visible Spectroscopy Market.
Chapter 3 focuses on research methodology.
Chapter 4 includes ecosystem analysis.
Chapter 5 highlights major industry dynamics, including drivers, restraints, and opportunities.
Chapter 6 discusses historical revenues and forecast till 2033.
Chapters 7 to 11 cover segment analysis across regions.
Chapter 12 describes competitive analysis.
Chapter 13 describes industry landscape analysis.
Chapter 14 provides company profiles.
Chapter 15 includes appendix and disclaimer.
Ultraviolet Visible Spectroscopy Market News and Key Development:
The Ultraviolet Visible Spectroscopy Market is evaluated by gathering qualitative and quantitative data post primary and secondary research, which includes important corporate publications, association data, and databases. A few of the key developments in the ultraviolet visible spectroscopy market are:
In May 2025, Thermo Fisher Scientific launched an advanced UV-Vis spectrophotometer with enhanced automation and cloud-based data analysis capabilities for pharmaceutical and industrial applications.
In February 2025, Shimadzu Corporation expanded its UV-Vis product portfolio with a new model featuring advanced optical design for environmental and academic research applications.
Key Sources Referred:
International Organization for Standardization (ISO)
U.S. Food and Drug Administration (FDA)
World Health Organization (WHO)
Environmental Protection Agency (EPA)
European Medicines Agency (EMA)
The List of Companies - Ultraviolet Visible Spectroscopy Market
Thermo Fisher Scientific
Shimadzu Corporation
Agilent Technologies
PerkinElmer
Bruker
JASCO
Analytik Jena
Metrohm
Hitachi High-Tech
HORIBA Scientific
Frequently Asked Questions
How big is the Ultraviolet Visible Spectroscopy Market?
The Ultraviolet Visible Spectroscopy Market is valued at US$ 1.36 Billion in 2025, it is projected to reach US$ 2.02 Billion by 2033.
What is the CAGR for Ultraviolet Visible Spectroscopy Market by (2026 - 2033)?
As per our report Ultraviolet Visible Spectroscopy Market, the market size is valued at US$ 1.36 Billion in 2025, projecting it to reach US$ 2.02 Billion by 2033. This translates to a CAGR of approximately 5.07% during the forecast period.
What segments are covered in this report?
The Ultraviolet Visible Spectroscopy Market report typically cover these key segments-
End User (Industries, Pathology & Diagnostic Labs, Academic & Research Institutes, Other End Users)
What is the historic period, base year, and forecast period taken for Ultraviolet Visible Spectroscopy Market?
The historic period, base year, and forecast period can vary slightly depending on the specific market research report. However, for the Ultraviolet Visible Spectroscopy Market report:
Historic Period : 2022-2024
Base Year : 2025
Forecast Period : 2026-2033
Who are the major players in Ultraviolet Visible Spectroscopy Market?
The Ultraviolet Visible Spectroscopy Market is populated by several key players, each contributing to its growth and innovation. Some of the major players include:
Thermo Fisher Scientific
Shimadzu Corporation
Agilent Technologies
PerkinElmer
Bruker
JASCO
Analytik Jena
Metrohm
Hitachi High-Tech
HORIBA Scientific
Who should buy this report?
The Ultraviolet Visible Spectroscopy Market report is valuable for diverse stakeholders, including:
Investors: Provides insights for investment decisions pertaining to market growth, companies, or industry insights. Helps assess market attractiveness and potential returns.
Industry Players: Offers competitive intelligence, market sizing, and trend analysis to inform strategic planning, product development, and sales strategies.
Suppliers and Manufacturers: Helps understand market demand for components, materials, and services related to concerned industry.
Researchers and Consultants: Provides data and analysis for academic research, consulting projects, and market studies.
Financial Institutions: Helps assess risks and opportunities associated with financing or investing in the concerned market.
Essentially, anyone involved in or considering involvement in the Ultraviolet Visible Spectroscopy Market value chain can benefit from the information contained in a comprehensive market report.


 Get Free Sample For Ultraviolet Visible Spectroscopy Market


