South America Epirubicin Market Forecast to 2028 – COVID-19 Impact and Regional Analysis – by Dosage (10mg/Vial, 50mg/Vial, 100mg/Vial, and 200mg/Vial), Application (Breast Cancer, Liver Cancer, Bladder Cancer, and Others), and Distribution Channel (Hospital Pharmacies, Retail Pharmacies, and Online Pharmacies)
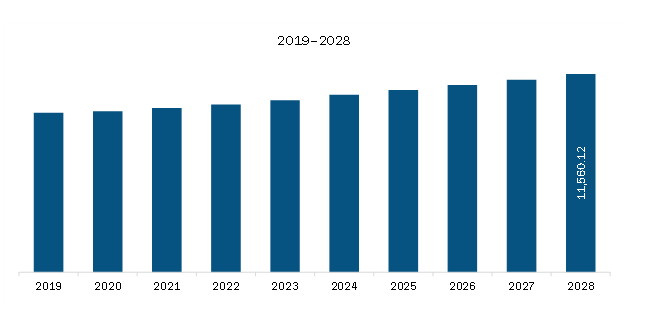
The SAM epirubicin market is expected to grow from US$ 9,806.94 thousand in 2022 to US$ 11,560.12 thousand by 2028; it is estimated to grow at a CAGR of 2.8% from 2022 to 2028.
Rising Number of Cancer Research Programs Boosts Epirubicin Market
Cancer is the one of the leading causes of mortality across the region. Furthermore, several researchers across the region are working on cancer research programs. Some research is fundamental, exploring questions as diverse as the biological foundations of cancer and the social factors that affect cancer risk. Several research efforts have taken place in recent years. For instance, the Breast Specialized Programs of Research Excellence (Breast SPOREs) are designed to move basic scientific findings into clinical settings quickly. The Breast SPOREs support the development of new therapies, technologies, and studies for a better understanding of tumor resistance, diagnosis, prognosis, screening, prevention, and treatment of breast cancer. Secondly, the Cancer Intervention and Surveillance Modeling Network (CISNET) focuses using modeling to improve knowledge to prevent, early detection, screening, and treatment affect breast cancer results. Ongoing programs help prevention and early detection research in different cancers. The factors mentioned above would fuel the growth of the epirubicin market across the region.
Market Overview
The SAM epirubicin market is segmented into Brazil, Argentina, and the Rest of SAM. The market growth is attributed to an increase in the prevalence of cancer, a surge in various research activities, increasing awareness regarding diagnostic imaging procedures, and rising healthcare expenditure. As per the International Trade Administration (ITA), Brazil is the largest healthcare market in Latin America and spends 9.1% of its GDP on healthcare. For instance, health spending in Brazil is expected to increase from 9.6% of GDP in 2019 to 12.6% of GDP by 2040. The growth in healthcare spending results in providing better care for patients in the country by launching awareness programs for diseases, routine checkups for early disease diagnosis, and better treatment facilities, among others. Healthcare spending can be used to increase the efficiency of primary health care, hospital care, pharmaceuticals, long-term care, and governance. Thus, an increase in healthcare spending across the country is also expected to fuel the market growth during the forecast period.
SAM Epirubicin Market Revenue and Forecast to 2028 (US$ Thousand)
SAM Epirubicin Market Segmentation
The SAM epirubicin market is segmented based on dosage, application, distribution channel, and country
- Based on dosage, the SAM epirubicin market is segmented into 10mg/vial, 50mg/vial, 100mg/vial, and 200mg/vial. The 50mg/vial segment held the largest market share in 2022.
- Based on application, the SAM epirubicin market is segmented into breast cancer, liver cancer, bladder cancer, and others. The breast cancer segment held the largest market share in 2022.
- Based on distribution channel, the SAM epirubicin market is segmented into hospital pharmacies, retail pharmacies, and online pharmacies. The hospital pharmacies segment held the largest market share in 2022.
- Based on country, the SAM epirubicin market is segmented into Brazil, Argentina, and the Rest of SAM. Further, Brazil dominated the market in 2022.
Fresenius Kabi AG, Hikma Pharmaceuticals PLC, Mylan N.V., Pfizer Inc., and Teva Pharmaceutical Industries Ltd. are the leading companies operating in the SAM epirubicin market.
1. Introduction
1.1 Scope of the Study
1.2 The Insight Partners Research Report Guidance
1.3 Market Segmentation
1.3.1 SAM Epirubicin Market – By Dosage
1.3.2 SAM Epirubicin Market – By Application
1.3.3 SAM Epirubicin Market – By Distribution Channel
1.3.4 SAM Epirubicin Market – By Country
2. Key Takeaways
3. Research Methodology
3.1 Coverage
3.2 Secondary Research
3.3 Primary Research
4. SAM Epirubicin Market – Market Landscape
4.1 Overview
4.2 SAM PEST Analysis
4.3 Experts Opinion
5. SAM Epirubicin Market– Key Market Dynamics
5.1 Market Drivers
5.1.1 Rising Prevalence of Cancer
5.1.2 Increasing Awareness Regarding Cancer
5.2 Market Restraints
5.2.1 Elevated Risk of Adverse Effects due to Epirubicin
5.3 Future Trends
5.3.1 Increase in Number of Cancer Research Programs
5.4 Impact Analysis
6. Epirubicin Market– SAM Analysis
6.1 SAM Epirubicin Market Revenue Forecasts and Analysis
7. SAM Epirubicin Market Analysis – By Dosage
7.1 Overview
7.2 SAM Epirubicin Market, by Dosage, 2022 & 2028 (%)
7.3mg/Vial
7.3.1 Overview
7.3.2mg/Vial Market Revenue and Forecast to 2028 (US$ Thousand)
7.4mg/Vial
7.4.1 Overview
7.4.2mg/Vial Market Revenue and Forecast to 2028 (US$ Thousand)
7.5mg/Vial
7.5.1 Overview
7.5.2mg/Vial Market Revenue and Forecast to 2028 (US$ Thousand)
7.6mg/Vial
7.6.1 Overview
7.6.2 Mg/Vial Market Revenue and Forecast to 2028 (US$ Thousand)
8. SAM Epirubicin Market Analysis – By Application
8.1 Overview
8.2 SAM Epirubicin Market, by Application, 2022 & 2028 (%)
8.3 Breast Cancer
8.3.1 Overview
8.3.2 Breast Cancer Market Revenue and Forecast to 2028 (US$ Thousand)
8.4 Liver Cancer
8.4.1 Overview
8.4.2 Liver Cancer Market Revenue and Forecast to 2028 (US$ Thousand)
8.5 Bladder Cancer
8.5.1 Overview
8.5.2 Bladder Cancer Market Revenue and Forecast to 2028 (US$ Thousand)
8.6 Others
8.6.1 Overview
8.6.2 Others Cancer Market Revenue and Forecast to 2028 (US$ Thousand)
9. SAM Epirubicin Market Analysis – By Distribution Channel
9.1 Overview
9.2 SAM Epirubicin Market, by Distribution Channel, 2022 & 2028 (%)
9.3 Hospital Pharmacies
9.3.1 Overview
9.3.2 Hospital Pharmacies Market Revenue and Forecast to 2028 (US$ Thousand)
9.4 Retail Pharmacies
9.4.1 Overview
9.4.2 Retail Pharmacies Market Revenue and Forecast to 2028 (US$ Thousand)
9.5 Online Pharmacies
9.5.1 Overview
9.5.2 Online Pharmacies Market Revenue and Forecast to 2028 (US$ Thousand)
10. SAM Epirubicin Market – Country Analysis
10.1 Overview
10.1.2 SAM: Epirubicin Market, by Country, 2022 & 2028 (%)
10.1.2.1 Brazil: Epirubicin Market – Revenue and Forecast to 2028 (USD Thousand)
10.1.2.1.1 Overview
10.1.2.1.2 Brazil: Epirubicin Market – Revenue and Forecast to 2028 (USD Thousand)
10.1.2.1.3 Brazil: Epirubicin Market, by Dosage, 2019–2028 (USD Thousand)
10.1.2.1.4 Brazil: Epirubicin Market, by Application, 2019–2028 (USD Thousand)
10.1.2.1.5 Brazil: Epirubicin Market, by Distribution Channel, 2019–2028 (USD Thousand)
10.1.2.2 Argentina: Epirubicin Market – Revenue and Forecast to 2028 (USD Thousand)
10.1.2.2.1 Overview
10.1.2.2.2 Argentina: Epirubicin Market – Revenue and Forecast to 2028 (USD Thousand)
10.1.2.2.3 Argentina: Epirubicin Market, by Dosage, 2019–2028 (USD Thousand)
10.1.2.2.4 Argentina: Epirubicin Market, by Application, 2019–2028 (USD Thousand)
10.1.2.2.5 Argentina: Epirubicin Market, by Distribution Channel, 2019–2028 (USD Thousand)
10.1.2.3 Rest of SAM: Epirubicin Market – Revenue and Forecast to 2028 (USD Thousand)
10.1.2.3.1 Overview
10.1.2.3.2 Rest of SAM: Epirubicin Market – Revenue and Forecast to 2028 (USD Thousand)
10.1.2.3.3 Rest of SAM: Epirubicin Market, by Dosage, 2019–2028 (USD Thousand)
10.1.2.3.4 Rest of SAM: Epirubicin Market, by Application, 2019–2028 (USD Thousand)
10.1.2.3.5 Rest of SAM: Epirubicin Market, by Distribution Channel, 2019–2028 (USD Thousand)
11. Industry Landscape
11.1 Overview
11.2 Growth Strategies
11.2.1 Overview
12. Company Profiles
12.1 Pfizer Inc.
12.1.1 Key Facts
12.1.2 Business Description
12.1.3 Products and Services
12.1.4 Financial Overview
12.1.5 SWOT Analysis
12.1.6 Key Developments
12.2 Teva Pharmaceutical Industries Ltd.
12.2.1 Key Facts
12.2.2 Business Description
12.2.3 Products and Services
12.2.4 Financial Overview
12.2.5 SWOT Analysis
12.2.6 Key Developments
12.3 Mylan N.V.
12.3.1 Key Facts
12.3.2 Business Description
12.3.3 Products and Services
12.3.4 Financial Overview
12.3.5 SWOT Analysis
12.3.6 Key Developments
12.4 Hikma Pharmaceuticals PLC
12.4.1 Key Facts
12.4.2 Business Description
12.4.3 Products and Services
12.4.4 Financial Overview
12.4.5 SWOT Analysis
12.4.6 Key Developments
12.5 Fresenius Kabi AG
12.5.1 Key Facts
12.5.2 Business Description
12.5.3 Products and Services
12.5.4 Financial Overview
12.5.5 SWOT Analysis
12.5.6 Key Developments
13. Appendix
13.1 About The Insight Partners
13.2 Glossary of Terms
LIST OF TABLES
Table 1. SAM Epirubicin Market – Revenue and Forecast to 2028 (US$ Thousand)
Table 2. Brazil: Epirubicin Market, by Dosage – Revenue and Forecast to 2028 (USD Thousand)
Table 3. Brazil: Epirubicin Market, by Application – Revenue and Forecast to 2028 (USD Thousand)
Table 4. Brazil: Epirubicin Market, by Distribution Channel– Revenue and Forecast to 2028 (USD Thousand)
Table 5. Argentina: Epirubicin Market, by Dosage – Revenue and Forecast to 2028 (USD Thousand)
Table 6. Argentina: Epirubicin Market, by Application – Revenue and Forecast to 2028 (USD Thousand)
Table 7. Argentina: Epirubicin Market, by Distribution Channel– Revenue and Forecast to 2028 (USD Thousand)
Table 8. Rest of SAM: Epirubicin Market, by Dosage – Revenue and Forecast to 2028 (USD Thousand)
Table 9. Rest of SAM: Epirubicin Market, by Application – Revenue and Forecast to 2028 (USD Thousand)
Table 10. Rest of SAM: Epirubicin Market, by Distribution Channel– Revenue and Forecast to 2028 (USD Thousand)
Table 11. Recent Growth Strategies
Table 12. Glossary of Terms
LIST OF FIGURES
Figure 1. SAM Epirubicin Market Segmentation
Figure 2. SAM Epirubicin Market, By Country
Figure 3. SAM Epirubicin Market Overview
Figure 4. SAM Epirubicin Market, By Dosage
Figure 5. SAM Epirubicin Market, By Country
Figure 6. SAM: PEST Analysis
Figure 7. Experts Opinion
Figure 8. Impact Analysis of Drivers and Restraints on SAM Epirubicin Market
Figure 9. SAM Epirubicin Market – Revenue Forecasts and Analysis
Figure 10. SAM Epirubicin Market, by Dosage, 2022 & 2028 (%)
Figure 11. SAM 10mg/Vial Market Revenue and Forecast to 2028 (US$ Thousand)
Figure 12. SAM 50mg/Vial Market Revenue and Forecast to 2028 (US$ Thousand)
Figure 13. SAM 100mg/Vial Market Revenue and Forecast to 2028 (US$ Thousand)
Figure 14. SAM 200 Mg/Vial Market Revenue and Forecast to 2028 (US$ Thousand)
Figure 15. SAM Epirubicin Market, by Application, 2022 & 2028 (%)
Figure 16. SAM Breast Cancer Market Revenue and Forecast to 2028 (US$ Thousand)
Figure 17. SAM Liver Cancer Market Revenue and Forecast to 2028 (US$ Thousand)
Figure 18. SAM Bladder Cancer Market Revenue and Forecast to 2028 (US$ Thousand)
Figure 19. SAM Others Cancer Market Revenue and Forecast to 2028 (US$ Thousand)
Figure 20. SAM Epirubicin Market, by Distribution Channel, 2022 & 2028 (%)
Figure 21. SAM Hospital Pharmacies Market Revenue and Forecast to 2028 (US$ Thousand)
Figure 22. SAM Retail Pharmacies Market Revenue and Forecast to 2028 (US$ Thousand)
Figure 23. SAM Online Pharmacies Market Revenue and Forecast to 2028 (US$ Thousand)
Figure 24. SAM: Epirubicin Market, by Key Country – Revenue (2022) (USD Thousand)
Figure 25. SAM: Epirubicin Market, by Country, 2022 & 2028 (%)
Figure 26. Brazil: Epirubicin Market – Revenue and Forecast to 2028 (USD Thousand)
Figure 27. Argentina: Epirubicin Market – Revenue and Forecast to 2028 (USD Thousand)
Figure 28. Rest of SAM: Epirubicin Market – Revenue and Forecast to 2028 (USD Thousand)
- Fresenius Kabi AG
- Hikma Pharmaceuticals PLC
- Mylan N.V.
- Pfizer Inc.
- Teva Pharmaceutical Industries Ltd.
- Save and reduce time carrying out entry-level research by identifying the growth, size, leading players, and segments in the SAM epirubicin market.
- Highlights key business priorities in order to assist companies to realign their business strategies
- The key findings and recommendations highlight crucial progressive industry trends in the SAM epirubicin market, thereby allowing players across the value chain to develop effective long-term strategies
- Develop/modify business expansion plans by using substantial growth offering developed and emerging markets
- Scrutinize in-depth SAM market trends and outlook coupled with the factors driving the epirubicin market, as well as those hindering it
- Enhance the decision-making process by understanding the strategies that underpin commercial interest with respect to client products, segmentation, pricing, and distribution