South America Diagramming Software Market Forecast to 2028 - COVID-19 Impact and Regional Analysis By Deployment Type (Cloud and On-Premises), Enterprise Size (Small & Medium-Size Enterprises and Large Enterprises), and Application (Educational Institutions, Corporates, and Personal)
Market Introduction
The diagramming software market in South America is further segmented into Brazil, Argentina, and the rest of South America. This region exhibits a diversified growth scenario, wherein a few countries have complex macroeconomic and political environments. Uruguay, Chile, and Argentina have higher standards of living, while most of the remaining countries are still in the developing stage. Venezuela, Bolivia, Suriname, Guyana, etc., are poor countries in the region with a per capita income less than US$ 5,799. These developing countries presently lack the required resources and infrastructure for the development of industrial and manufacturing sectors. Despite several challenges, government authorities in many countries are trying to take initiatives to encourage economic growth. Many industries in this region have been undergoing digital transformations to become more competitive in the respective markets they serve. Chile, Brazil, and Colombia are experiencing rapid digitalization. In the last few months, technological adoption in all corporate offices is rising. As a matter of fact, for getting highly efficient work from the employees by saving time, corporate enterprises are demanding diagramming software to generate detailed diagrams such as flow charts and floor plans with the help of data and images. Countries such as Brazil, Argentina, Colombia, Ecuador, and Peru are gaining a lot of attention from diagramming software companies. Furthermore, the increase in per capita disposable income, digital transformation, and growth of IoT-based technology are driving the demand for diagramming software in South America. Also, high penetration and a rapidly growing young population, coupled with an increase in usage of IoT and cloud-based software, will propel the demand for diagramming software in this region.
Brazil reported the largest number of COVID-19 cases across South America, followed by Ecuador, Chile, Peru, and Argentina. The COVID-19 pandemic has compelled several country governments to impose lockdowns and suspend economic activities to contain the spread of the novel coronavirus. The implementation of restrictions negatively impacted the technological investments made by the companies in the region. However, the strict lockdown across the region has propelled the adoption of cloud solutions among enterprises to continue business operations and efficient communications among teams. Thus, the rising adoption of such cloud solutions is expected to drive the growth of the South America diagramming software market in the coming years.
Get more information on this report : 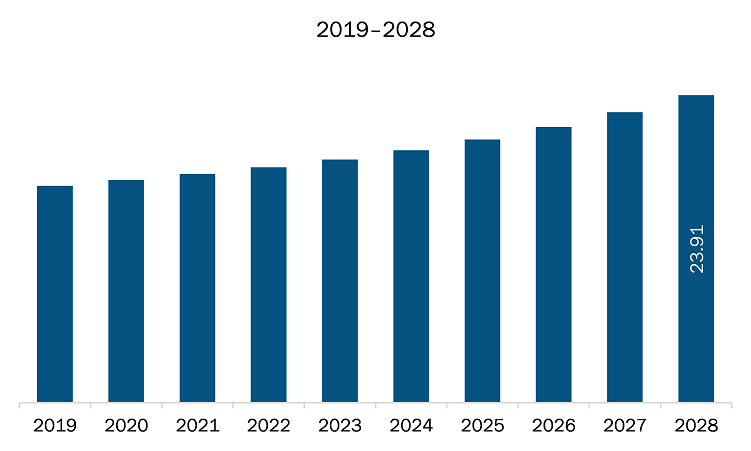
Market Overview and Dynamics
The diagramming software market in South America is expected to grow from US$ 17.78 million in 2021 to US$ 23.91 million by 2028; it is estimated to grow at a CAGR of 4.3% from 2021 to 2028. Increasing adoption of diagramming software across large enterprises; diagramming software is experiencing a rise in adoption across both large enterprises and small and medium enterprises over the years. Enterprises are adopting these solutions for various applications including flowchart, mind map, organization chart, timeline, and grant chart. The adoption of diagramming software enables to define workflow and hierarchy in a better manner, thereby offering transparency among organizations. For example, the increasing expansion of businesses across the region and rising adoption of centralized management among them is widening the employee base for the organizations. This is boosting the demand among the enterprises to have a proper organization chart that will enable them to allocate resources to projects undertaken as per their expertise. Additionally, the diagramming software are useful for various departments of an organization. These solutions are applied across departments such as marketing, human resources, operations, and engineering. These solutions help different departments to create flowcharts, customer journey mapping, process diagrams, project mapping, and timeline diagrams. Companies such as Lucid Software Inc. is offering different solutions for each department based on their requirements. These solutions are also able to easily collaborate on a real-time basis with the teams across remote locations. Thus, the above-mentioned factors are influencing the rapid adoption of diagramming software across enterprises, thereby contributing to the growth of the South America market. This is bolstering the growth of the diagramming software market.
Key Market Segments
Based on deployment type, the diagramming software market can be bifurcated into cloud and on-premises. In 2020, the cloud segment held the largest share South America diagramming software market. Based on enterprise size, the diagramming software market is categorized into small & medium-size enterprises and large enterprises. In 2020, the large enterprises segment held the largest share South America diagramming software market. Based on application, the diagramming software can be categorized into educational institutions, corporates, and personals. The corporates segment contributed a substantial share in 2020.
Major Sources and Companies Listed
A few major primary and secondary sources referred to for preparing this report on the diagramming software market in South America are company websites, annual reports, financial reports, national government documents, and statistical database, among others. Major companies listed in the report are CREATELY (CINERGIX PTY LTD); Edrawsoft; Microsoft Corporation; and SmartDraw, LLC among others.
Reasons to buy report
- To understand the South America diagramming software market landscape and identify market segments that are most likely to guarantee a strong return
- Stay ahead of the race by comprehending the ever-changing competitive landscape for South America diagramming software market
- Efficiently plan M&A and partnership deals in South America diagramming software market by identifying market segments with the most promising probable sales
- Helps to take knowledgeable business decisions from perceptive and comprehensive analysis of market performance of various segment form South America diagramming software market
- Obtain market revenue forecast for market by various segments from 2021-2028 in South America region.
SOUTH AMERICA DIAGRAMMING SOFTWARE MARKET SEGMENTATION
By Deployment Type
- Cloud
- On-Premises
By Enterprise Size
- SMEs
- Large Enterprises
By Application
- Corporates
- Educational Institutions
- Personal
By Country
- Brazil
- Argentina
- Rest of South America
Company Profiles
- CREATELY (CINERGIX PTY LTD)
- Edrawsoft
- Microsoft Corporation
- SmartDraw, LLC
TABLE OF CONTENTS
1. Introduction
1.1 Study Scope
1.2 The Insight Partners Research Report Guidance
1.3 Market Segmentation
2. Key Takeaways
3. Research Methodology
3.1 Coverage
3.2 Secondary Research
3.3 Primary Research
4. SAM Diagramming Software Market Landscape
4.1 Market Overview
4.2 PEST Analysis
4.2.1 SAM
4.3 Ecosystem Analysis
4.4 Expert Opinion
5. SAM Diagramming Software Market – Key Market Dynamics
5.1 Market Drivers
5.1.1 Increasing Adoption of Diagramming Software Across Large Enterprises
5.1.2 Rising Adoption of Cloud-Based Diagramming Software across Organizations
5.2 Market Restraints
5.2.1 Prevalence of Freely Available Diagramming Solutions
5.3 Market Opportunities
5.3.1 Integration of Advanced Technologies with Diagramming Software
5.4 Future Trends
5.4.1 Strategic initiatives by Major Players
5.5 Impact Analysis of Drivers and Restraints
6. Diagramming Software Market – SAM Analysis
6.1 Diagramming Software Market SAM Overview
6.2 Diagramming Software Market – SAM Revenue and Forecast to 2028 (US$ Million)
7. SAM Diagramming Software Market Analysis – By Deployment Type
7.1 Overview
7.2 SAM Diagramming Software Market, by Deployment Type (2020 and 2028)
7.3 Cloud
7.3.1 Overview
7.3.2 Cloud: SAM Diagramming Software Market – Revenue and Forecast to 2028 (US$ Million)
7.4 On-Premise
7.4.1 Overview
7.4.2 On-premise: SAM Diagramming Software Market – Revenue and Forecast to 2028 (US$ Million)
8. SAM Diagramming Software Market – By Enterprise Size
8.1 Overview
8.2 SAM Diagramming Software Market, by Enterprise Size (2020 and 2028)
8.3 SMEs
8.3.1 Overview
8.3.2 SMEs: SAM Diagramming Software Market – Revenue and Forecast to 2028 (US$ Million)
8.4 Large Enterprises
8.4.1 Overview
8.4.2 Large Enterprises: SAM Diagramming Software Market – Revenue and Forecast to 2028 (US$ Million)
9. SAM Diagramming Software Market – By Application
9.1 Overview
9.2 SAM Diagramming Software Market, by Application (2020 and 2028)
9.3 Educational Institutions
9.3.1 Overview
9.3.2 Educational Institutions: SAM Diagramming Software Market – Revenue and Forecast to 2028 (US$ Million)
9.4 Corporates
9.4.1 Overview
9.4.2 Corporates: SAM Diagramming Software Market – Revenue and Forecast to 2028 (US$ Million)
9.5 Personal
9.5.1 Overview
9.5.2 Personal: SAM Diagramming Software Market – Revenue and Forecast to 2028 (US$ Million)
10. SAM Diagramming Software Market – Country Analysis
10.1 SAM Diagramming Software Market
10.1.1 SAM: Diagramming Software Market- by Key Country
10.1.1.1 Brazil: Diagramming Software Market – Revenue and Forecast to 2028 (US$ Million)
10.1.1.1.1 Brazil: Diagramming Software Market- By Deployment Type
10.1.1.1.2 Brazil: Diagramming Software Market- By Enterprise Size
10.1.1.1.3 Brazil: Diagramming Software Market- By Application
10.1.1.2 Argentina: Diagramming Software Market – Revenue and Forecast to 2028 (US$ Million)
10.1.1.2.1 Argentina: Diagramming Software Market- By Deployment Type
10.1.1.2.2 Argentina: Diagramming Software Market- By Enterprise Size
10.1.1.2.3 Argentina: Diagramming Software Market- By Application
10.1.1.3 Rest of SAM: Diagramming Software Market – Revenue and Forecast to 2028 (US$ Million)
10.1.1.3.1 Rest of SAM: Diagramming Software Market- By Deployment Type
10.1.1.3.2 Rest of SAM: Diagramming Software Market- By Enterprise Size
10.1.1.3.3 Rest of SAM: Diagramming Software Market- By Application
11. Impact of COVID-19 Pandemic on SAM Diagramming Software Market
11.1 South America: Impact Assessment of COVID-19 Pandemic
12. SAM Diagramming Software Market- Industry Landscape
12.1 Overview
12.2 New Product Development
13. Company Profiles
13.1 CREATELY (CINERGIX PTY LTD)
13.1.1 Key Facts
13.1.2 Business Description
13.1.3 Products and Services
13.1.4 Financial Overview
13.1.5 SWOT Analysis
13.1.6 Key Developments
13.2 Microsoft Corporation
13.2.1 Key Facts
13.2.2 Business Description
13.2.3 Products and Services
13.2.4 Financial Overview
13.2.5 SWOT Analysis
13.2.6 Key Developments
13.3 SmartDraw, LLC
13.3.1 Key Facts
13.3.2 Business Description
13.3.3 Products and Services
13.3.4 Financial Overview
13.3.5 SWOT Analysis
13.3.6 Key Developments
13.4 Edrawsoft
13.4.1 Key Facts
13.4.2 Business Description
13.4.3 Products and Services
13.4.4 Financial Overview
13.4.5 SWOT Analysis
13.4.6 Key Developments
14. Appendix
14.1 About The Insight Partners
14.2 Word Index
LIST OF TABLES
Table 1. SAM Diagramming Software Market – Revenue and Forecast to 2028 (US$ Million)
Table 2. Brazil: Diagramming Software Market- By Deployment Type –Revenue and Forecast to 2028 (US$ Million)
Table 3. Brazil: Diagramming Software Market- By Enterprise Size –Revenue and Forecast to 2028 (US$ Million)
Table 4. Brazil: Diagramming Software Market- By Application –Revenue and Forecast to 2028 (US$ Million)
Table 5. Argentina: Diagramming Software Market- By Deployment Type –Revenue and Forecast to 2028 (US$ Million)
Table 6. Argentina: Diagramming Software Market- By Enterprise Size –Revenue and Forecast to 2028 (US$ Million)
Table 7. Argentina: Diagramming Software Market- By Application –Revenue and Forecast to 2028 (US$ Million)
Table 8. Rest of SAM: Diagramming Software Market- By Deployment Type –Revenue and Forecast to 2028 (US$ Million)
Table 9. Rest of SAM: Diagramming Software Market- By Enterprise Size –Revenue and Forecast to 2028 (US$ Million)
Table 10. Rest of SAM: Diagramming Software Market- By Application–Revenue and Forecast to 2028 (US$ Million)
Table 11. List of Abbreviation
LIST OF FIGURES
Figure 1. SAM Diagramming Software Market Segmentation
Figure 2. SAM Diagramming Software Market Segmentation – By Country
Figure 3. SAM Diagramming Software Market Overview
Figure 4. Cloud Segment Held the Largest Market Share in 2020
Figure 5. Large Enterprises Segment Held the Largest Market Share in 2020
Figure 6. Corporates Application Held the Largest Market Share in 2020
Figure 7. Brazil was the Largest Revenue Contributor in 2020
Figure 8. SAM: PEST Analysis
Figure 9. Expert Opinion
Figure 10. SAM Diagramming Software Market Impact Analysis of Drivers and Restraints
Figure 11. SAM Diagramming Software Market – Revenue and Forecast to 2028 (US$ Million)
Figure 12. SAM Diagramming Software Market Revenue Share, by Deployment Type (2020 and 2028)
Figure 13. Cloud: SAM Diagramming Software Market – Revenue and Forecast to 2028 (US$ Million)
Figure 14. On-premise: SAM Diagramming Software Market – Revenue and Forecast to 2028 (US$ Million)
Figure 15. SAM Diagramming Software Market Revenue Share, by Enterprise Size (2020 and 2028)
Figure 16. SMEs: SAM Diagramming Software Market – Revenue and Forecast to 2028 (US$ Million)
Figure 17. Large Enterprises: SAM Diagramming Software Market – Revenue and Forecast to 2028 (US$ Million)
Figure 18. SAM Diagramming Software Market Revenue Share, by Application (2020 and 2028)
Figure 19. Educational Institutions: SAM Diagramming Software Market – Revenue and Forecast to 2028 (US$ Million)
Figure 20. Corporates: SAM Diagramming Software Market – Revenue and Forecast to 2028 (US$ Million)
Figure 21. Personal: SAM Diagramming Software Market – Revenue and Forecast to 2028 (US$ Million)
Figure 22. SAM: Diagramming Software Market – Revenue and Forecast to 2028 (US$ Million)
Figure 23. SAM: Diagramming Software Market Revenue Share, By Key Country (2020 and 2028)
Figure 24. Brazil: Diagramming Software Market – Revenue and Forecast to 2028 (US$ Million)
Figure 25. Argentina: Diagramming Software Market – Revenue and Forecast to 2028 (US$ Million)
Figure 26. Rest of SAM: Diagramming Software Market – Revenue and Forecast to 2028 (US$ Million)
Figure 27. Impact of COVID-19 Pandemic in South America Country Markets
- CREATELY (CINERGIX PTY LTD)
- Edrawsoft
- Microsoft Corporation
- SmartDraw, LLC
- Save and reduce time carrying out entry-level research by identifying the growth, size, leading players and segments in the South America Diagramming Software Market.
- Highlights key business priorities in order to assist companies to realign their business strategies
- The key findings and recommendations highlight crucial progressive industry trends in the South America Diagramming Software Market, thereby allowing players across the value chain to develop effective long-term strategies
- Develop/modify business expansion plans by using substantial growth offering developed and emerging markets
- Scrutinize in-depth South America market trends and outlook coupled with the factors driving the Diagramming Software Market, as well as those hindering it
- Enhance the decision-making process by understanding the strategies that underpin commercial interest with respect to client products, segmentation, pricing and distribution