Middle East and Africa Soft Tissue Repair Market Forecast to 2028 - COVID-19 Impact and Regional Analysis By Product (Fixation Instruments and Tissue Mesh/Patch) and Application (Orthopedic Repair, Hernia Repair, Breast Reconstruction, Pelvic and Vaginal Prolapse Repair, Skin Repair, Dental Repair, Dural Repair, and Others)
Market Introduction
Saudi Arabia, South Africa, and the UAE are among the key countries in the Middle East & Africa. This region is predicted to experience rapid growth in industrialization and commercialization in the coming years. Several Gulf countries are economically developed, while the African countries are lagging far behind them and are in the developing stage. Furthermore, due to the technological advancements, governments, private organizations, and various educational institutes are inclining more toward advanced software platforms such as diagramming software, which is leading to an increase in the demand for diagramming software in various applications. Government bodies are prioritizing diagramming software to create detailed diagrams—such as flow charts and floor plans—by saving process time. Additionally, government are focusing to increase the attention towards high-quality institutions from different parts of the world will create a demand for diagramming software in various educational institutes.
Saudi Arabia, the UAE, Egypt, Morocco, and Kuwait are the main countries facing the impact of the COVID-19 outbreak in the Middle East and Africa. Saudi Arabia's economy shrank by 7%, indicating how hard the latest pandemic struck both the oil and non-oil industries, and unemployment reached a new high of 15.4%. The crisis adversely impacted the technological adoption and investment in the region. However, in the region, the rising adoption of remote working culture among enterprises to communicate efficiently among teams and clients propels the demand for diagramming solutions for making efficient flowcharts, grantt charts, org charts, and mind mapping. The major adoption of cloud solutions is experienced among SMEs across the region to expand their business activities. Thus, the COVID-19 outbreak pandemic is expected to positively impact the growth of the diagramming software market in the coming years.
Get more information on this report :
Market Overview and Dynamics
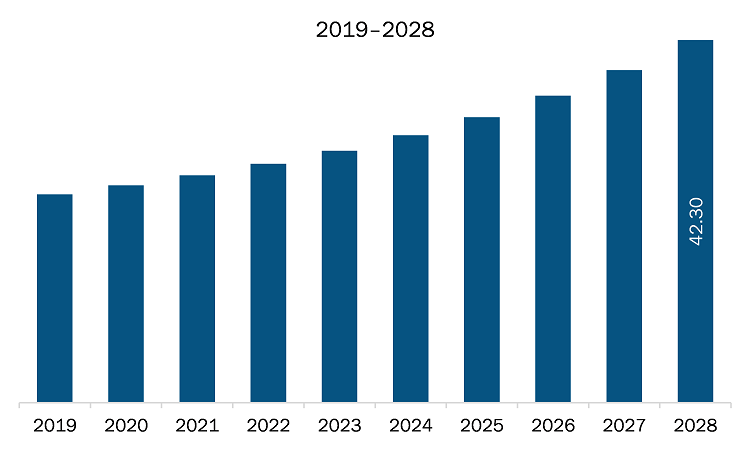
The diagramming software market in MEA is expected to grow from US$ 26.53 million in 2021 to US$ 42.30 million by 2028; it is estimated to grow at a CAGR of 6.9% from 2021 to 2028. Increasing adoption of cloud-based diagramming software across organizations; owing to the rise in industrialization and globalization initiatives in several countries, business activities are growing across all industries. Additionally, it has been observed that more than 75% of enterprises are planning to adopt digital transformation to have business recovery out of 2020. The enterprises are looking ahead to adopt cost-effective and collaborative solutions to accomplish their pre-determined digital goals. For instance, penetration of free and cloud-based platforms such as diagramming software is expected to gain high momentum. The cloud-based platform assists teams to track, collaborate, and possibly manage workflows. The diagramming solutions enable the end users to automate the management approval workflow process for business and release complete transparency. By migrating the diagramming solutions on the cloud, the enterprises are experiencing numerous benefits while propelling the speed of diagramming and reducing internal and external costs. This aspect of reducing costs and accelerating diagram approvals is influencing the adoption of cloud-based diagramming solutions across enterprises, thereby driving the MEA market. This is bolstering the growth of the diagramming software market.
Key Market Segments
Based on deployment type, the diagramming software market can be bifurcated into cloud and on-premises. In 2020, the cloud segment held the largest share MEA diagramming software market. Based on enterprise size, the diagramming software market is categorized into small & medium-size enterprises and large enterprises. In 2020, the large enterprises segment held the largest share MEA diagramming software market. Based on application, the diagramming software can be categorized into educational institutions, corporates, and personals. The corporates segment contributed a substantial share in 2020.
Major Sources and Companies Listed
A few major primary and secondary sources referred to for preparing this report on the diagramming software market in MEA are company websites, annual reports, financial reports, national government documents, and statistical database, among others. Major companies listed in the report are REATELY (CINERGIX PTY LTD); Edrawsoft; Gliffy (Perforce Software, Inc.); Microsoft Corporation; and SmartDraw, LLC among others.
Reasons to buy report
- To understand the MEA diagramming software market landscape and identify market segments that are most likely to guarantee a strong return
- Stay ahead of the race by comprehending the ever-changing competitive landscape for MEA diagramming software market
- Efficiently plan M&A and partnership deals in MEA diagramming software market by identifying market segments with the most promising probable sales
- Helps to take knowledgeable business decisions from perceptive and comprehensive analysis of market performance of various segment form MEA diagramming software market
- Obtain market revenue forecast for market by various segments from 2021-2028 in MEA region.
MEA DIAGRAMMING SOFTWARE MARKET SEGMENTATION
By Deployment Type
- Cloud
- On-Premises
By Enterprise Size
- SMEs
- Large Enterprises
By Application
- Corporates
- Educational Institutions
- Personal
By Country
- UAE
- Saudi Arabia
- South Africa
- Rest of MEA
Company Profiles
- CREATELY (CINERGIX PTY LTD)
- Edrawsoft
- Gliffy (Perforce Software, Inc.)
- Microsoft Corporation
- SmartDraw, LLC
TABLE OF CONTENTS
1. Introduction
1.1 Study Scope
1.2 The Insight Partners Research Report Guidance
1.3 Market Segmentation
2. Key Takeaways
3. Research Methodology
3.1 Coverage
3.2 Secondary Research
3.3 Primary Research
4. MEA Diagramming Software Market Landscape
4.1 Market Overview
4.2 PEST Analysis
4.2.1 MEA
4.3 Ecosystem Analysis
4.4 Expert Opinion
5. MEA Diagramming Software Market – Key Market Dynamics
5.1 Market Drivers
5.1.1 Surge in Adoption of Diagramming Software Across Large Enterprises
5.1.2 Increasing Adoption of Cloud-Based Diagramming Software across Organizations
5.2 Market Restraints
5.2.1 Prevalence of Freely Available Diagramming Solutions
5.3 Market Opportunities
5.3.1 Integration of Advanced Technologies with Diagramming Software
5.4 Future Trends
5.4.1 Strategic initiatives by Major Players
5.5 Impact Analysis of Drivers and Restraints
6. Diagramming Software Market – MEA Analysis
6.1 Diagramming Software Market MEA Overview
6.2 MEA Diagramming Software Market –Revenue and Forecast to 2028 (US$ Million)
7. MEA Diagramming Software Market– By Deployment Type
7.1 Overview
7.2 MEA Diagramming Software Market, by Deployment Type (2020 and 2028)
7.3 Cloud
7.3.1 Overview
7.3.2 Cloud: MEA Diagramming Software Market – Revenue and Forecast to 2028 (US$ Million)
7.4 On-Premises
7.4.1 Overview
7.4.2 On-premises: MEA Diagramming Software Market – Revenue and Forecast to 2028 (US$ Million)
8. MEA Diagramming Software Market – By Enterprise Size
8.1 Overview
8.2 MEA Diagramming Software Market, by Enterprise Size (2020 and 2028)
8.3 SMEs
8.3.1 Overview
8.3.2 SMEs: MEA Diagramming Software Market – Revenue and Forecast to 2028 (US$ Million)
8.4 Large Enterprises
8.4.1 Overview
8.4.2 Large Enterprises: MEA Diagramming Software Market – Revenue and Forecast to 2028 (US$ Million)
9. MEA Diagramming Software Market – By Application
9.1 Overview
9.2 MEA Diagramming Software Market, by Application (2020 and 2028)
9.3 Educational Institutions
9.3.1 Overview
9.3.2 Educational Institutions: MEA Diagramming Software Market – Revenue and Forecast to 2028 (US$ Million)
9.4 Corporates
9.4.1 Overview
9.4.2 Corporates: MEA Diagramming Software Market – Revenue and Forecast to 2028 (US$ Million)
9.5 Personal
9.5.1 Overview
9.5.2 Personal: MEA Diagramming Software Market – Revenue and Forecast to 2028 (US$ Million)
10. MEA Diagramming Software Market – Country Analysis
10.1 MEA: Diagramming Software Market
10.1.1 MEA: Diagramming Software Market- by Key Country
10.1.1.1 South Africa: Diagramming Software Market – Revenue and Forecast to 2028 (US$ Million)
10.1.1.1.1 South Africa: Diagramming Software Market- By Deployment Type
10.1.1.1.2 South Africa: Diagramming Software Market- By Enterprise Size
10.1.1.1.3 South Africa: Diagramming Software Market- By Application
10.1.1.2 Saudi Arabia: Diagramming Software Market – Revenue and Forecast to 2028 (US$ Million)
10.1.1.2.1 Saudi Arabia: Diagramming Software Market- By Deployment Type
10.1.1.2.2 Saudi Arabia: Diagramming Software Market- By Enterprise Size
10.1.1.2.3 Saudi Arabia: Diagramming Software Market- By Application
10.1.1.3 UAE: Diagramming Software Market – Revenue and Forecast to 2028 (US$ Million)
10.1.1.3.1 UAE: Diagramming Software Market- By Deployment Type
10.1.1.3.2 UAE: Diagramming Software Market- By Enterprise Size
10.1.1.3.3 UAE: Diagramming Software Market- By Application
10.1.1.4 Rest of MEA: Diagramming Software Market – Revenue and Forecast to 2028 (US$ Million)
10.1.1.4.1 Rest of MEA: Diagramming Software Market- By Deployment Type
10.1.1.4.2 Rest of MEA: Diagramming Software Market- By Enterprise Size
10.1.1.4.3 Rest of MEA: Diagramming Software Market- By Application
11. Impact of COVID-19 Pandemic on MEA Diagramming Software Market
11.1 Middle East and Africa: Impact Assessment of COVID-19 Pandemic
12. MEA Diagramming Software Market- Industry Landscape
12.1 Overview
12.2 New Product Development
13. Company Profiles
13.1 CREATELY (CINERGIX PTY LTD)
13.1.1 Key Facts
13.1.2 Business Description
13.1.3 Products and Services
13.1.4 Financial Overview
13.1.5 SWOT Analysis
13.1.6 Key Developments
13.2 Microsoft Corporation
13.2.1 Key Facts
13.2.2 Business Description
13.2.3 Products and Services
13.2.4 Financial Overview
13.2.5 SWOT Analysis
13.2.6 Key Developments
13.3 SmartDraw, LLC
13.3.1 Key Facts
13.3.2 Business Description
13.3.3 Products and Services
13.3.4 Financial Overview
13.3.5 SWOT Analysis
13.3.6 Key Developments
13.4 Edrawsoft
13.4.1 Key Facts
13.4.2 Business Description
13.4.3 Products and Services
13.4.4 Financial Overview
13.4.5 SWOT Analysis
13.4.6 Key Developments
13.5 Gliffy (Perforce Software, Inc.)
13.5.1 Key Facts
13.5.2 Business Description
13.5.3 Products and Services
13.5.4 Financial Overview
13.5.5 SWOT Analysis
13.5.6 Key Developments
14. Appendix
14.1 About The Insight Partners
14.2 Word Index
LIST OF TABLES
Table 1. MEA Diagramming Software Market – Revenue and Forecast to 2028 (US$ Million)
Table 2. South Africa: Diagramming Software Market- By Deployment Type –Revenue and Forecast to 2028 (US$ Million)
Table 3. South Africa: Diagramming Software Market- By Enterprise Size –Revenue and Forecast to 2028 (US$ Million)
Table 4. South Africa: Diagramming Software Market- By Application –Revenue and Forecast to 2028 (US$ Million)
Table 5. Saudi Arabia: Diagramming Software Market- By Deployment Type –Revenue and Forecast to 2028 (US$ Million)
Table 6. Saudi Arabia: Diagramming Software Market- By Enterprise Size –Revenue and Forecast to 2028 (US$ Million)
Table 7. Saudi Arabia: Diagramming Software Market- By Application –Revenue and Forecast to 2028 (US$ Million)
Table 8. UAE: Diagramming Software Market- By Deployment Type –Revenue and Forecast to 2028 (US$ Million)
Table 9. UAE: Diagramming Software Market- By Enterprise Size –Revenue and Forecast to 2028 (US$ Million)
Table 10. UAE: Diagramming Software Market- By Application –Revenue and Forecast to 2028 (US$ Million)
Table 11. Rest of MEA: Diagramming Software Market- By Deployment Type –Revenue and Forecast to 2028 (US$ Million)
Table 12. Rest of MEA: Diagramming Software Market- By Enterprise Size –Revenue and Forecast to 2028 (US$ Million)
Table 13. Rest of MEA: Diagramming Software Market- By Application –Revenue and Forecast to 2028 (US$ Million)
Table 14. List of Abbreviation
LIST OF FIGURES
Figure 1. MEA Diagramming Software Market Segmentation
Figure 2. MEA Diagramming Software Market Segmentation – By Country
Figure 3. MEA Diagramming Software Market Overview
Figure 4. Cloud Segment Held the Largest Market Share in 2020
Figure 5. Large Enterprises Segment Held the Largest Market Share in 2020
Figure 6. Corporates Application Held the Largest Market Share in 2020
Figure 7. UAE was the Largest Revenue Contributor in 2020
Figure 8. MEA: PEST Analysis
Figure 9. Expert Opinion
Figure 10. MEA Diagramming Software Market Impact Analysis of Drivers and Restraints
Figure 11. MEA Diagramming Software Market – Revenue and Forecast to 2028 (US$ Million)
Figure 12. MEA Diagramming Software Market Revenue Share, by Deployment Type (2020 and 2028)
Figure 13. Cloud: MEA Diagramming Software Market – Revenue and Forecast to 2028 (US$ Million)
Figure 14. On-premises: MEA Diagramming Software Market – Revenue and Forecast to 2028 (US$ Million)
Figure 15. MEA Diagramming Software Market Revenue Share, by Enterprise Size (2020 and 2028)
Figure 16. SMEs: MEA Diagramming Software Market – Revenue and Forecast to 2028 (US$ Million)
Figure 17. Large Enterprises: MEA Diagramming Software Market – Revenue and Forecast to 2028 (US$ Million)
Figure 18. MEA Diagramming Software Market Revenue Share, by Application (2020 and 2028)
Figure 19. Educational Institutions: MEA Diagramming Software Market – Revenue and Forecast to 2028 (US$ Million)
Figure 20. Corporates: MEA Diagramming Software Market – Revenue and Forecast to 2028 (US$ Million)
Figure 21. Personal: MEA Diagramming Software Market – Revenue and Forecast to 2028 (US$ Million)
Figure 22. MEA: Diagramming Software Market – Revenue by Country to 2028 (US$ Million)
Figure 23. MEA: Diagramming Software Market Revenue Share, By Key Country (2020 and 2028)
Figure 24. South Africa: Diagramming Software Market – Revenue and Forecast to 2028 (US$ Million)
Figure 25. Saudi Arabia: Diagramming Software Market – Revenue and Forecast to 2028 (US$ Million)
Figure 26. UAE: Diagramming Software Market – Revenue and Forecast to 2028 (US$ Million)
Figure 27. Rest of MEA: Diagramming Software Market – Revenue and Forecast to 2028 (US$ Million)
Figure 28. Impact of COVID-19 Pandemic in Middle East and Africa Country Markets
- CREATELY (CINERGIX PTY LTD)
- Edrawsoft
- Gliffy (Perforce Software, Inc.)
- Microsoft Corporation
- SmartDraw, LLC
- To understand the MEA diagramming software market landscape and identify market segments that are most likely to guarantee a strong return
- Stay ahead of the race by comprehending the ever-changing competitive landscape for MEA diagramming software market
- Efficiently plan M&A and partnership deals in MEA diagramming software market by identifying market segments with the most promising probable sales
- Helps to take knowledgeable business decisions from perceptive and comprehensive analysis of market performance of various segment form MEA diagramming software market
- Obtain market revenue forecast for market by various segments from 2021-2028 in MEA region.