Middle East & Africa Automated Cell Counters Market Forecast to 2028 - COVID-19 Impact and Regional Analysis By Type (Hemocytometer, Flow Cytometers, Electrical Impedance Coulter Counters, and Spectrophotometers) and End User (Hospitals, Research Laboratories, Diagnostics Centers, and Others)
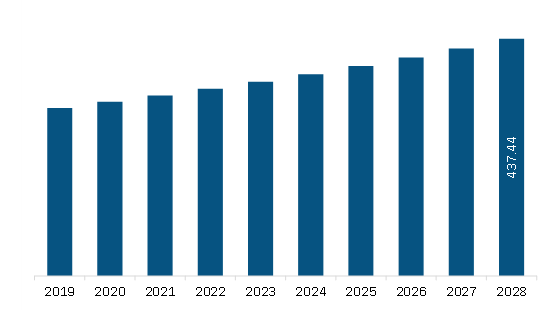
The automated cell counters market in Middle East & Africa is expected to grow from US$ 345.13 million in 2022 to US$ 437.44 million by 2028; it is estimated to grow at a CAGR of 4.0% from 2022 to 2028.
Need of Cell Counters in Personalized Medicine
Personalized medicine is an emerging medicinal practice that uses an individual's genetic profile to make decisions about disease prevention, diagnosis, and treatment. Furthermore, knowledge about a patient's genetic profile can help doctors choose the proper medication or therapy and administer it using the appropriate dose or regimen. Stem cells are key tools that fulfill an improved understanding of disease biology as they can be used to study the effect of compounds and the design of innovative biological treatments tailored to individual patient genotypes/phenotypes. Further, the rapidly rising amount of scientific data on stem cell biology is uncovering its role and involvement in the pathogenesis of diverse conditions characterized by tissue degeneration and decreased endogenous healing capabilities. Stem cells and their derivatives are implemented in innovative therapeutic strategies to restore damaged tissues and organs. The increased knowledge of the location and functions of tissue-specific niches guided stem cell research toward the development of novel targeted strategies to heal structures and restore biological functions following tissue injuries and delayed disease progression. The individual response in maintaining stem cell niche integrity and functionality can lead to significant differences in clinical results and therapeutic response/outcomes. Therefore, stem cells are used for the development of personalized medicines according to an individual’s needs. The automated cell counters are used to study the characteristics of these stem cells. The development of personalized medicines is expected to create opportunities for the growth of the automated cell counters market.
Market Overview
The Middle East & Africa automated cell counter market is segmented into the UAE, Saudi Arabia, South Africa, and the Rest of Middle East & Africa. The market growth is attributed to the increasing prevalence of chronic diseases, innovative product launches, and growing research studies across the region. The prevalence of genetic blood disorders is a critical health issue in Saudi Arabia. To control the growing blood disorder, the Saudi Commission for Health Specialties (SCFHS) association council was formed by the Saudi Society for Blood Disorders (SSBD) in 2018. It includes disciplines for adult hematology, pediatric hematology, hemato-pathology, and blood and bone marrow transplant. Further, a continuous rise in chronic diseases, along with high demand for rapid diagnosis, effective treatment options, and preventive measures, are boosting the demand for automated cell counter products in Saudi Arabia. According to WHO, the increasing incidence of viral hepatitis, HIV, and AIDS continues to be a significant health problem in Iran and Qatar. To prevent the growing number of influenza cases, the Public Health Laboratory in Saudi Arabia has fulfilled all the requirements of the WHO to be recognized as a national influenza center for Saudi Arabia. Thus, rising cases of diseases and government initiatives to control the diseases are anticipated to fuel the growth of the automated cell counter market.
Middle East & Africa Automated Cell Counters Market Revenue and Forecast to 2028 (US$ Million)
Middle East & Africa Automated Cell Counters Market Segmentation
The Middle East & Africa automated cell counters market is segmented on the basis of type, end user, and country. Based on type, the market is segmented into hemocytometer, flow cytometers, electrical impedance coulter counters, and spectrophotometers. The spectrophotometers segment held the largest market share in 2022. Based on end user, the market is categorized into hospitals, research laboratories, diagnostics centers, and others. The hospitals segment held the largest market share in 2022. Based on country, the market is segmented into Saudi Arabia, South Africa, the UAE, and the Rest of Middle East & Africa. Saudi Arabia dominated the market share in 2022.
Eppendorf; Thermo Fisher Scientific Inc.; Countstar Inc.; Bio-Rad Laboratories, Inc.; F. Hoffman-La Roche Ltd; Beckman Coulter, Inc. (Danaher); Nanoentek; Olympus Corporation; MERCK KGaA; Sysmex Corporation; Agilent Technologies, Inc.; Abbott; and Nexcelom Bioscience LLC. are the leading companies operating in the Middle East & Africa automated cell counters market.
1. Introduction
1.1 Study Scope
1.2 The Insight Partners Research Report Guidance
1.3 Market Segmentation
1.3.1 MEA Automated Cell Counters Market – By Type
1.3.2 MEA Automated Cell Counters Market – By End User
1.3.3 MEA Automated Cell Counters Market – By Country
2. Automated Cell Counters Market – Key Takeaways
3. Research Methodology
3.1 Coverage
3.2 Secondary Research
3.3 Primary Research
4. MEA Automated Cell Counters Market – Market Landscape
4.1 Overview
4.2 PEST Analysis
4.2.1 MEA PEST Analysis
4.3 Experts Opinion
5. MEA Automated Cell Counters Market – Key Market Dynamics
5.1 Market Drivers
5.1.1 Incidence of Infectious and Chronic Diseases
5.1.2 Growth in Drug Discovery Activities
5.2 Market Restraints
5.2.1 Deficiency of Skilled Workforce and High Cost of Instrument
5.3 Market Opportunities
5.3.1 Need of Cell Counters in Personalized Medicine
5.4 Future Trends
5.4.1 Progresses in Automated Cell Counters
5.5 Impact Analysis
6. Automated Cell Counters Market – MEA Analysis
6.1 MEA Automated Cell Counters Market Revenue Forecast & Analysis
7. MEA Automated Cell Counter Market – by Type
7.1 Overview
7.2 MEA By Type: Market Revenue and Forecast Analysis (US$ Million)
7.3 Spectrophotometers
7.3.1 Overview
7.3.2 Spectrophotometers Market Revenue and Forecast to 2028 (US$ Million)
7.4 Flow Cytometers
7.4.1 Overview
7.4.2 Flow Cytometers Market Revenue and Forecast to 2028 (US$ Million)
7.5 Hemocytometers
7.5.1 Overview
7.5.2 Hemocytometers Market Revenue and Forecast to 2028 (US$ Million)
7.6 Electrical Impedance Coulter Counters
7.6.1 Overview
7.6.2 Electrical Impedance Coulter Counters Market Revenue and Forecast to 2028 (US$ Million)
8. MEA Automated Cell Counter Market – by End User
8.1 MEA Automated Cell Counter Market Revenue Share, by End User (2022 and 2028)
8.2 Hospitals
8.2.1 Overview
8.2.2 Hospitals: Automated Cell Counter Market – Revenue and Forecast to 2028 (US$ Million)
8.3 Research Laboratories
8.3.1 Overview
8.3.2 Research Laboratories: Automated Cell Counter Market – Revenue and Forecast to 2028 (US$ Million)
8.4 Diagnostic Centres
8.4.1 Overview
8.4.2 Diagnostic Centres: Automated Cell Counter Market – Revenue and Forecast to 2028 (US$ Million)
8.5 Others
8.5.1 Overview
8.5.2 Others: Automated Cell Counter Market – Revenue and Forecast to 2028 (US$ Million)
9. MEA Automated Cell Counters Market – by Country Analysis
9.1 MEA: Automated Cell Counters Market
9.1.1 Overview
9.1.2 Middle East & Africa: Automated Cell Counters Market, by Country, 2022 & 2028 (%)
9.1.2.1 UAE: Automated cell counter Market – Revenue and Forecast to 2028 (USD Million)
9.1.2.1.1 UAE: Automated Cell Counters Market – Revenue and Forecast to 2028 (US$ Million)
9.1.2.1.2 UAE: Automated Cell Counters Market, by Type, 2019–2028 (US$ Million)
9.1.2.1.3 UAE: Automated Cell Counters Market, by End user, 2019–2028 (US$ Million)
9.1.2.2 Saudi Arabia: Automated Cell Counters Market – Revenue and Forecast to 2028 (US$ Million)
9.1.2.2.1 Saudi Arabia: Automated Cell Counters Market – Revenue and Forecast to 2028 (US$ Million)
9.1.2.2.2 Saudi Arabia: Automated Cell Counters Market, by Type, 2019–2028 (US$ Million)
9.1.2.2.3 Saudi Arabia: Automated Cell Counters Market, by End user, 2019–2028 (US$ Million)
9.1.2.3 South Africa: Automated cell counter Market – Revenue and Forecast to 2028 (USD Million)
9.1.2.3.1 South Africa: Automated Cell Counters Market – Revenue and Forecast to 2028 (US$ Million)
9.1.2.3.2 South Africa: Automated Cell Counters Market, by Type, 2019–2028 (US$ Million)
9.1.2.3.3 South Africa: Automated Cell Counters Market, by End user, 2019–2028 (US$ Million)
9.1.2.4 Rest of Middle East & Africa: Automated Cell Counters Market – Revenue and Forecast to 2028 (US$ Million)
9.1.2.4.1 Rest of Middle East & Africa: Automated Cell Counters Market – Revenue and Forecast to 2028 (US$ Million)
9.1.2.4.2 Rest of Middle East & Africa: Automated Cell Counters Market, by Type, 2019–2028 (US$ Million)
9.1.2.4.3 Rest of Middle East & Africa: Automated Cell Counters Market, by End user, 2019–2028 (US$ Million)
10. Automated Cell Counters Market – Industry Landscape
10.1 Overview
10.2 Growth Strategies in the Automated Cell Counters Market, 2022-2028
10.3 Inorganic Growth Strategies
10.3.1 Overview
10.4 Organic Growth Strategies
10.4.1 Overview
11. COMPANY PROFILES
11.1 Eppendorf
11.1.1 Key Facts
11.1.2 Business Description
11.1.3 Products and Services
11.1.4 Financial Overview
11.1.5 SWOT Analysis
11.1.6 Key Developments
11.2 Thermo Fisher Scientific Inc.
11.2.1 Key Facts
11.2.2 Business Description
11.2.3 Products and Services
11.2.4 Financial Overview
11.2.5 SWOT Analysis
11.2.6 Key Developments
11.3 Countstar Inc.
11.3.1 Key Facts
11.3.2 Business Description
11.3.3 Products and Services
11.3.4 Financial Overview
11.3.5 SWOT Analysis
11.3.6 Key Developments
11.4 Bio-Rad Laboratories, Inc.
11.4.1 Key Facts
11.4.2 Business Description
11.4.3 Products and Services
11.4.4 Financial Overview
11.4.5 SWOT Analysis
11.4.6 Key Developments
11.5 F. Hoffmann-La Roche Ltd
11.5.1 Key Facts
11.5.2 Business Description
11.5.3 Products and Services
11.5.4 Financial Overview
11.5.5 SWOT Analysis
11.5.6 Key Developments
11.6 Beckman Coulter, Inc. (Danaher)
11.6.1 Key Facts
11.6.2 Business Description
11.6.3 Products and Services
11.6.4 Financial Overview
11.6.5 SWOT Analysis
11.6.6 Key Developments
11.7 Nanoentek
11.7.1 Key Facts
11.7.2 Business Description
11.7.3 Products and Services
11.7.4 Financial Overview
11.7.5 SWOT Analysis
11.7.6 Key Developments
11.8 Olympus Corporation
11.8.1 Key Facts
11.8.2 Business Description
11.8.3 Products and Services
11.8.4 Financial Overview
11.8.5 SWOT Analysis
11.8.6 Key Developments
11.9 MERCK KGaA
11.9.1 Key Facts
11.9.2 Business Description
11.9.3 Products and Services
11.9.4 Financial Overview
11.9.5 SWOT Analysis
11.9.6 Key Developments
11.10 Sysmex Corporation
11.10.1 Key Facts
11.10.2 Business Description
11.10.3 Products and Services
11.10.4 Financial Overview
11.10.5 SWOT Analysis
11.10.6 Key Developments
11.11 Agilent Technologies, Inc.
11.11.1 Key Facts
11.11.2 Business Description
11.11.3 Products and Services
11.11.4 Financial Overview
11.11.5 SWOT Analysis
11.11.6 Key Developments
11.12 Abbott
11.12.1 Key Facts
11.12.2 Business Description
11.12.3 Products and Services
11.12.4 Financial Overview
11.12.5 SWOT Analysis
11.12.6 Key Developments
11.13 Nexcelom Bioscience LLC.
11.13.1 Key Facts
11.13.2 Business Description
11.13.3 Products and Services
11.13.4 Financial Overview
11.13.5 SWOT Analysis
11.13.6 Key Developments
12. Appendix
12.1 About The Insight Partners
12.2 Glossary of Terms for Automated Cell Counters Market
LIST OF TABLES
Table 1. UAE Automated Cell Counters Market, by Type – Revenue and Forecast to 2028 (US$ Million)
Table 2. UAE Automated Cell Counters Market, by End user – Revenue and Forecast to 2028 (US$ Million)
Table 3. Saudi Arabia Automated Cell Counters Market, by Type – Revenue and Forecast to 2028 (US$ Million)
Table 4. Saudi Arabia Automated Cell Counters Market, by End user – Revenue and Forecast to 2028 (US$ Million)
Table 5. South Africa Automated Cell Counters Market, by Type – Revenue and Forecast to 2028 (US$ Million)
Table 6. South Africa Automated Cell Counters Market, by End user – Revenue and Forecast to 2028 (US$ Million)
Table 7. Rest of Middle East & Africa Automated Cell Counters Market, by Type – Revenue and Forecast to 2028 (US$ Million)
Table 8. Rest of Middle East & Africa Automated Cell Counters Market, by End user – Revenue and Forecast to 2028 (US$ Million)
Table 9. Inorganic Growth Strategies in the Automated Cell Counters Market
Table 10. Organic Growth Strategies in the Automated Cell Counters Market
Table 11. Glossary of Terms
LIST OF FIGURES
Figure 1. MEA Automated Cell Counters Market Segmentation
Figure 2. MEA Automated Cell Counters Market Segmentation, by Country
Figure 3. MEA Automated Cell Counters Market Overview
Figure 4. Spectrophotometers Segment Held Largest Share of Product Segment in Automated Cell Counters Market
Figure 5. Saudi Arabia Is Expected to Show Remarkable Growth During the Forecast Period
Figure 6. MEA: PEST Analysis
Figure 7. MEA Experts Opinion
Figure 8. MEA Impact Analysis
Figure 9. MEA Automated Cell Counters Market – Revenue Forecast and Analysis – 2020- 2028
Figure 10. MEA By Type: Market Analysis and Forecast 2022 and 2028 (%)
Figure 11. MEA Spectrophotometers Market Revenue and Forecast to 2028 (US$ Million)
Figure 12. MEA Flow Cytometers Market Revenue and Forecast to 2028 (US$ Million)
Figure 13. MEA Hemocytometers Market Revenue and Forecast to 2028 (US$ Million)
Figure 14. MEA Electrical Impedance Coulter Counters Market Revenue and Forecast to 2028 (US$ Million)
Figure 15. MEA Automated Cell Counter Market Revenue Share, by End User (2022 and 2028)
Figure 16. MEA Hospitals: Automated Cell Counter Market – Revenue and Forecast to 2028 (US$ Million)
Figure 17. MEA Research Laboratories: Automated Cell Counter Market – Revenue and Forecast to 2028 (US$ Million)
Figure 18. MEA Diagnostic Centers: Automated Cell Counter Market – Revenue and Forecast to 2028 (US$ Million)
Figure 19. MEA Others: Automated Cell Counter Market – Revenue and Forecast to 2028 (US$ Million)
Figure 20. MEA: Automated Cell Counters Market, by Key Country – Revenue (2022) (US$ Million)
Figure 21. UAE: Automated Cell Counters Market – Revenue and Forecast to 2028 (US$ Million)
Figure 22. Saudi Arabia: Automated Cell Counters Market – Revenue and Forecast to 2028 (US$ Million)
Figure 23. South Africa: Automated Cell Counters Market – Revenue and Forecast to 2028 (US$ Million)
Figure 24. Rest of Middle East & Africa: Automated Cell Counters Market – Revenue and Forecast to 2028 (US$ Million)
Figure 25. Growth Strategies in the Automated Cell Counters Market, 2022-2028
- Eppendorf
- Thermo Fisher Scientific Inc.
- Countstar Inc.
- Bio-Rad Laboratories, Inc.
- F. Hoffman-La Roche Ltd
- Beckman Coulter, Inc. (Danaher)
- Nanoentek
- Olympus Corporation
- MERCK KGaA
- Sysmex Corporation
- Agilent Technologies, Inc.
- Abbott
- Nexcelom Bioscience LLC
- Save and reduce time carrying out entry-level research by identifying the growth, size, leading players, and segments in the Middle East & Africa automated cell counters market.
- Highlights key business priorities in order to assist companies to realign their business strategies
- The key findings and recommendations highlight crucial progressive industry trends in the Middle East & Africa automated cell counters market, thereby allowing players across the value chain to develop effective long-term strategies
- Develop/modify business expansion plans by using substantial growth offering developed and emerging markets
- Scrutinize in-depth Middle East & Africa market trends and outlook coupled with the factors driving the Middle East & Africa automated cell counters market, as well as those hindering it
- Enhance the decision-making process by understanding the strategies that underpin commercial interest with respect to client products, segmentation, pricing, and distribution