Share, Trend, and Growth Opportunity Analysis Report Coverage: By Coolant Type (Ethylene Glycol, Propylene Glycol, Glycerin, and Others), Technology (Inorganic Additive Technology, Organic Acid Technology, Hybrid Organic Acid Technology, and Others), Application [Automotive (Passenger Cars, Light Commercial Vehicles, Heavy Duty Vehicles, and Two Wheelers), Industrial Heating or Cooling, Energy, Food Processing, and Others], Distribution Channel (Original Equipment Manufacturers, Aftermarket, and Retail and Others), and Country
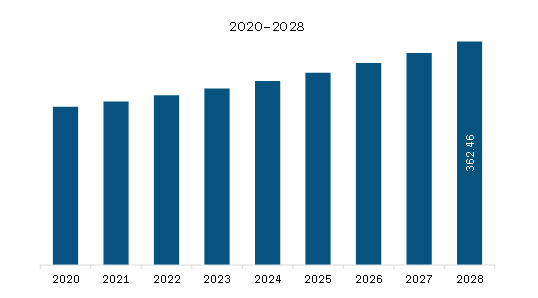
The Middle East & Africa antifreeze market size is projected to reach US$ 454.79 million by 2031 from US$ 292.48 million in 2023; the market is expected to register a CAGR of 5.7% during 2023–2031.
The antifreeze market in the Middle East and Africa is witnessing notable growth driven by increasing automotive production, rising temperatures, and a growing emphasis on vehicle maintenance. As countries in the region invest in infrastructure development and urbanization, the demand for efficient cooling solutions in vehicles and industrial machinery has surged. The major factors driving the Middle East and Africa antifreeze market are the strong presence of the automotive industry and growing demand from the industrial sector, along with the increasing passenger vehicle production and rising middle-class incomes.
Based on the coolant type, the Middle East and Africa antifreeze market is segmented into ethylene glycol, propylene glycol, glycerin, and others.The ethylene glycol segment accounted for the largest Middle East and Africa antifreeze market share in 2023. Ethylene glycol is an alcohol-based organic compound commonly used as an anti-freezing agent in HVAC equipment, vehicle systems, and other applications. It is an odorless, colorless, and viscous liquid. Ethylene glycol possesses high heat transfer capabilities and is commonly used in various commercial and industrial applications, including antifreeze and coolant.
Based on the technology, the Middle East and Africa antifreeze market is segmented into inorganic additive technology, organic acid technology, hybrid organic acid technology, and others. The organic acid technology segment accounted for the largest Middle East and Africa antifreeze market share in 2023. Organic acid technology (OAT) coolants use carboxylic acids as the main inhibitors. During the heating process, carboxylic acids form carboxylates and these compounds deplete far more slowly as compared to the inorganic counterparts. They also help in preventing corrosion effectively. All these advantages of organic acid technology coolants have made them a popular choice for most vehicles across the globe.
Based on the application, the Middle East and Africa antifreeze market is segmented into automotive (passenger cars, light commercial vehicles, heavy duty vehicles, and two wheelers), industrial heating or cooling, energy, food processing, and others. The automotive segment accounted for the largest Middle East and Africa antifreeze market share in 2023. Automotive is one of the major application areas of antifreeze (coolant). Antifreeze is used as an engine coolant in cars, trucks, and buses. It is used in car engines to prevent the engine’s cooling system from freezing and overheating.
A few of the key players in the Middle East & Africa antifreeze market include SA Polichem, Valvoline Inc, Shell Plc, Castrol Ltd, Chevron Corp, Exxon Mobil Corp, TotalEnergies SE, Solventis Ltd, BASF SE, and Armor Lubricants. Players operating in the market focus on providing high-quality products to fulfill customer demand. Also, they focus on adopting various strategies such as new product launches, collaborations, and others in order to stay competitive in the market. For instance, in 2023, BASF introduced its GLYSANTIN engine coolants into the Nigerian market. The coolants offer a unique combination of German premium quality and multiple protection features, making them suitable for a versatile range of applications in various sectors. In 2022, Valvoline, a leading global lubricant manufacturer, launched a glycol-based full-antifreeze coolant. The new Valvoline advanced coolant supports all cars and commercial vehicles and provides a 5-year or up to 500,000 km drain interval.
The overall Middle East and Africa antifreeze market size has been derived using both primary and secondary sources. To begin the research process, exhaustive secondary research has been conducted using internal and external sources to obtain qualitative and quantitative information related to the market. Also, multiple primary interviews have been conducted with industry participants to validate the data and gain more analytical insights into the topic. The participants of this process include industry experts such as VPs, business development managers, market intelligence managers, and national sales managers—along with external consultants such as valuation experts, research analysts, and key opinion leaders—specializing in the Middle East and Africa antifreeze market.
Middle East & Africa Antifreeze Market Strategic Insights
Get more information on this report
Middle East & Africa Antifreeze Market Segmentation Analysis
Middle East & Africa Antifreeze Market Report Highlights
Middle East & Africa Antifreeze Report Scope
Report Attribute
Details
Market size in 2023
US$ 292.48 Million
Market Size by 2031
US$ 454.79 Million
CAGR (2023 - 2031)
5.7%
Historical Data
2021-2022
Forecast period
2024-2031
Segments Covered
By Coolant Type
Ethylene Glycol
Propylene Glycol
Glycerin
By Technology
Inorganic Additive Technology
Organic Acid Technology
Hybrid Organic Acid Technology
By Application
Automotive
Industrial Heating or Cooling
Energy
Food Processing
Others
By Distribution Channel
Original Equipment Manufacturers
Aftermarket
Retail
Regions and Countries Covered
Middle East and Africa
South Africa, Saudi Arabia, UAE, Rest of Middle East and Africa
Market leaders and key company profiles
SA Polichem
Valvoline Inc
Shell Plc
Castrol Ltd
Chevron Corp
Exxon Mobil Corp
TotalEnergies SE
Solventis Ltd
BASF SE
Armor Lubricants
Get more information on this report
Middle East & Africa Antifreeze Market Country and Regional Insights
Get more information on this report
Identical Market Reports with other Region/Countries
The List of Companies - Middle East & Africa Antifreeze Market
SA PolichemValvoline IncShell PlcCastrol LtdChevron CorpExxon Mobil CorpTotalEnergies SESolventis LtdBASF SEArmor Lubricants
Frequently Asked Questions
How big is the Middle East & Africa Antifreeze Market?
The Middle East & Africa Antifreeze Market is valued at US$ 292.48 Million in 2023, it is projected to reach US$ 454.79 Million by 2031.
What is the CAGR for Middle East & Africa Antifreeze Market by (2023 - 2031)?
As per our report Middle East & Africa Antifreeze Market, the market size is valued at US$ 292.48 Million in 2023, projecting it to reach US$ 454.79 Million by 2031. This translates to a CAGR of approximately 5.7% during the forecast period.
What segments are covered in this report?
The Middle East & Africa Antifreeze Market report typically cover these key segments-
Coolant Type (Ethylene Glycol, Propylene Glycol, Glycerin)
Distribution Channel (Original Equipment Manufacturers, Aftermarket, Retail)
What is the historic period, base year, and forecast period taken for Middle East & Africa Antifreeze Market?
The historic period, base year, and forecast period can vary slightly depending on the specific market research report. However, for the Middle East & Africa Antifreeze Market report:
Historic Period : 2021-2022
Base Year : 2023
Forecast Period : 2024-2031
Who are the major players in Middle East & Africa Antifreeze Market?
The Middle East & Africa Antifreeze Market is populated by several key players, each contributing to its growth and innovation. Some of the major players include:
SA Polichem
Valvoline Inc
Shell Plc
Castrol Ltd
Chevron Corp
Exxon Mobil Corp
TotalEnergies SE
Solventis Ltd
BASF SE
Armor Lubricants
Who should buy this report?
The Middle East & Africa Antifreeze Market report is valuable for diverse stakeholders, including:
Investors: Provides insights for investment decisions pertaining to market growth, companies, or industry insights. Helps assess market attractiveness and potential returns.
Industry Players: Offers competitive intelligence, market sizing, and trend analysis to inform strategic planning, product development, and sales strategies.
Suppliers and Manufacturers: Helps understand market demand for components, materials, and services related to concerned industry.
Researchers and Consultants: Provides data and analysis for academic research, consulting projects, and market studies.
Financial Institutions: Helps assess risks and opportunities associated with financing or investing in the concerned market.
Essentially, anyone involved in or considering involvement in the Middle East & Africa Antifreeze Market value chain can benefit from the information contained in a comprehensive market report.


 Get Free Sample For Middle East & Africa Antifreeze Market


