Europe Electric Ship Market Forecast to 2028 - COVID-19 Impact and Regional Analysis By Type (Battery Electric ships, Plug-In Hybrid Electric ships, and Hybrid Electric Ships), Power (Less than 75 Kw, 75 - 150 Kw, 151 - 745 Kw, 746 - 7560 Kw, and More than 7560 Kw), Range (Less than 50 Km, 50 - 100 Km, 101 - 1000 Km, and More than 1000 Km), and Ship Type (Cruise Ships, Ferries, Tankers, Bulk Carriers, Fishing Vessels, Destroyers, Aircraft Carriers, and Others)
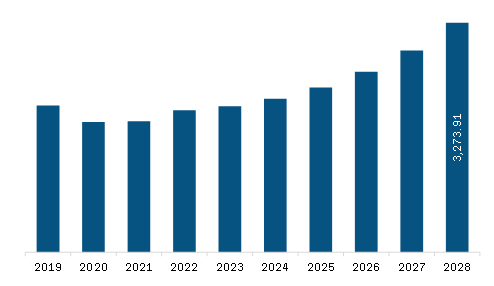
The Europe electric ship market is expected to grow from US$ 1867.68 million in 2021 to US$ 3273.91 million by 2028; it is estimated to grow at a CAGR of 8.3% from 2021 to 2028.
Several marine industry associations are focusing on reducing the gas emission from the shipping industry. For instance, according to a report published by the Norwegian Ministry of Climate and Environment, in April 2018, the International Maritime Organization (IMO) adopted a plan to reduce greenhouse gas emissions from international shipping by at least 50% by the end of 2050 compared with the level in 2008. Additionally, the IMO strategy includes ambitions to improve the energy efficiency of each ship and to reduce the carbon intensity of the whole marine industry by reducing emissions per unit of transport work done by at least 40% by 2030 and further towards 70% by 2050, according to report published by the Norwegian Ministry of Climate and Environment. Also, in January 2020, according to IMO 2020 regulation, the IMO 2020 rule limits the use of Sulphur in the fuel oil used on board ships operating outside designated emission control areas to 0.50% m/m (mass by mass), a significant reduction from the previous limit of sulfur content by 3.50%. This has also resulted in the ship integrators and owners switching the existing diesel-driven engines with electric or hybrid propulsion systems.
Europe Electric Ship Market Revenue and Forecast to 2028 (US$ Million)
Europe Electric Ship Market Segmentation
The Europe electric ship market is segmented based on type, power, range, ship type, and country. Based on type, the Europe electric ship market is segmented into battery electric ships, plug-in hybrid electric ships, and hybrid electric ships. The hybrid electric ships segment dominated the Europe electric ship market in 2020. Based on power, the Europe electric ship market is segmented into Less than 75 Kw, 75 - 150 Kw, 151 - 745 Kw, 746 - 7560 Kw, and more than 7560 Kw. The 746 - 7560 Kw segment dominated the Europe electric ship market in 2020. Based on range, Europe electric ship market is segmented into Less than 50 Km, 50 - 100 Km, 101 - 1000 Km, and more than 1000 Km. The 101 - 1000 Km segment dominated the Europe electric ship market in 2020. Based on ship type, Europe electric ship market is segmented into cruise ships, ferries, tankers, bulk carriers, fishing vessels, destroyers, aircraft carriers, and others. The ferries segment dominated the Europe electric ship market in 2020. Based on country, the Europe electric ship market is segmented into Germany, France, Italy, the UK, Russia, and the Rest of Europe. The Rest of Europe segment dominated the Europe electric ship market in 2020.
BAE System; Fjellstrand AS; X Shore; General Dynamic Electric Boat; Hurtigruten; MAN Energy Solution; PortLiner; Siemens Energy; and Vard AS are among the leading companies in the Europe electric ship market.
1. Introduction
1.1 Scope of the Study
1.2 The Insight Partners Research Report Guidance
1.3 Market Segmentation
2. Key Takeaways
3. Research Methodology
3.1 Coverage
3.2 Secondary Research
3.3 Primary Research
4. Europe Electric Ship Market Landscape
4.1 Market Overview
4.2 PEST Analysis
4.2.1 Europe PEST - Analysis
4.3 Ecosystem Analysis
4.4 Expert Opinions
5. Europe Electric Ship Market – Key Industry Dynamics
5.1 Market Drivers
5.1.1 Increasing in Adoption of Hybrid and Electric Propulsion Systems for Retrofitting Ships
5.1.2 Growing Regulatory Support from Government Authorities and Industry Associations
5.2 Market Restraints
5.2.1 Restricted Range and Capacity of Fully Electric Ships
5.3 Market Opportunities
5.3.1 Growth in the adoption of Hybrid-Electric Propulsion Technology for Large Ships
5.4 Future Trends
5.4.1 Technological Development in Energy Storage Devices
5.5 Impact Analysis of Drivers and Restraints
6. Electric Ship Market – Europe Analysis
6.1 Europe Electric Ship Market Forecast and Analysis
7. Europe Electric Ships Market Analysis and Forecast to 2028 – By Type
7.1 Europe Electric Ships Market Revenue Share, by Type (2020 and 2028)
7.2 Battery Electric Ships
7.2.1 Overview
7.2.2 Battery Electric Ships: Electric Ships Market – Revenue and Forecast to 2028 (US$ Million)
7.3 Plug-in Electric Ships
7.3.1 Overview
7.3.2 Plug-in Electric Ships: Electric Ships Market – Revenue and Forecast to 2028 (US$ Million)
7.4 Hybrid Electric Ships
7.4.1 Overview
7.4.2 Hybrid Electric Ships: Electric Ships Market – Revenue and Forecast to 2028 (US$ Million)
8. Europe Electric Ships Market Analysis and Forecast to 2028 – By Power
8.1 Europe Electric Ships Market Revenue Share, by Power (2020 and 2028)
8.2 Less than 75kW
8.2.1 Overview
8.2.2 Less than 75kW: Electric Ships Market – Revenue and Forecast to 2028 (US$ Million)
8.3kW-150kW
8.3.1 Overview
8.3.2kW-150kW: Electric Ships Market – Revenue and Forecast to 2028 (US$ Million)
8.4kW-745kW
8.4.1 Overview
8.4.2kW-745kW: Electric Ships Market – Revenue and Forecast to 2028 (US$ Million)
8.5kW-7560kW
8.5.1 Overview
8.5.2kW-7560kW: Electric Ships Market – Revenue and Forecast to 2028 (US$ Million)
8.6 More than 7560kW
8.6.1 Overview
8.6.2 More than 7560kW: Electric Ships Market – Revenue and Forecast to 2028 (US$ Million)
9. Europe Electric Ships Market Analysis and Forecast to 2028 – By Range
9.1 Europe Electric Ships Market Revenue Share, by Range (2020 and 2028)
9.2 Less than 50 Km
9.2.1 Overview
9.2.2 Less than 50 km: Electric Ships Market – Revenue and Forecast to 2028 (US$ Million)
9.3-100 Km
9.3.1 Overview
9.3.2-100 Km: Electric Ships Market – Revenue and Forecast to 2028 (US$ Million)
9.4 -1000 Km
9.4.1 Overview
9.4.2-1001 Km: Electric Ships Market – Revenue and Forecast to 2028 (US$ Million)
9.5 More than 1000 Km
9.5.1 Overview
9.5.2 More than 1000 Km: Electric Ships Market – Revenue and Forecast to 2028 (US$ Million)
10. Europe Electric Ships Market Analysis and Forecast to 2028 – By Ship Type
10.1 Europe Electric Ships Market Revenue Share, by Ship Type (2020 and 2028)
10.2 Cruise Ships
10.2.1 Overview
10.2.2 Cruise Ships: Electric Ships Market – Revenue and Forecast to 2028 (US$ Million)
10.3 Ferries
10.3.1 Overview
10.3.2 Ferries: Electric Ships Market – Revenue and Forecast to 2028 (US$ Million)
10.4 Tankers
10.4.1 Overview
10.4.2 Tankers: Electric Ships Market – Revenue and Forecast to 2028 (US$ Million)
10.5 Bulk Carriers
10.5.1 Overview
10.5.2 Bulk Carriers: Electric Ships Market – Revenue and Forecast to 2028 (US$ Million)
10.6 Fishing Vessels
10.6.1 Overview
10.6.2 Fishing Vessels: Electric Ships Market – Revenue and Forecast to 2028 (US$ Million)
10.7 Destroyers
10.7.1 Overview
10.7.2 Destroyers: Electric Ships Market – Revenue and Forecast to 2028 (US$ Million)
10.8 Aircraft Carriers
10.8.1 Overview
10.8.2 Aircraft Carriers: Electric Ships Market – Revenue and Forecast to 2028 (US$ Million)
10.9 Others
10.9.1 Overview
10.9.2 Others: Electric Ships Market – Revenue and Forecast to 2028 (US$ Million)
11. Europe Electric Ship Market – Country Analysis
11.1 Overview
11.1.1 Europe Electric Ship Market Breakdown, by Country
11.1.1.1 Germany Electric Ship Market, Revenue and Forecast to 2028
11.1.1.1.1 Germany Electric Ship Market Breakdown, by Type
11.1.1.1.2 Germany Electric Ship Market Breakdown, by Power
11.1.1.1.3 Germany Electric Ship Market Breakdown, by Range
11.1.1.1.4 Germany Electric Ship Market Breakdown, by Ship Type
11.1.1.2 France Electric Ship Market, Revenue and Forecast to 2028
11.1.1.2.1 France Electric Ship Market Breakdown, by Type
11.1.1.2.2 France Electric Ship Market Breakdown, by Power
11.1.1.2.3 France Electric Ship Market Breakdown, by Range
11.1.1.2.4 France Electric Ship Market Breakdown, by Ship Type
11.1.1.3 Italy Electric Ship Market, Revenue and Forecast to 2028
11.1.1.3.1 Italy Electric Ship Market Breakdown, by Type
11.1.1.3.2 Italy Electric Ship Market Breakdown, by Power
11.1.1.3.3 Italy Electric Ship Market Breakdown, by Range
11.1.1.3.4 Italy Electric Ship Market Breakdown, by Ship Type
11.1.1.4 UK Electric Ship Market, Revenue and Forecast to 2028
11.1.1.4.1 UK Electric Ship Market Breakdown, by Type
11.1.1.4.2 UK Electric Ship Market Breakdown, by Power
11.1.1.4.3 UK Electric Ship Market Breakdown, by Range
11.1.1.4.4 UK Electric Ship Market Breakdown, by Ship Type
11.1.1.5 Rest of Europe Electric Ship Market, Revenue and Forecast to 2028
11.1.1.5.1 Rest of Europe Electric Ship Market Breakdown, by Type
11.1.1.5.2 Rest of Europe Electric Ship Market Breakdown, by Power
11.1.1.5.3 Rest of Europe Electric Ship Market Breakdown, by Range
11.1.1.5.4 Rest of Europe Electric Ship Market Breakdown, by Ship Type
12. Industry Landscape
12.1 Overview
12.2 Agreements, Collaborations and Joint Ventures
12.3 New Product Launches
12.4 EXPANSIONS AND OTHER STRATEGIC DEVELOPMENTS
13. Company Profiles
13.1 BAE Systems
13.1.1 Key Facts
13.1.2 Business Description
13.1.3 Products and Services
13.1.4 Financial Overview
13.1.5 SWOT Analysis
13.1.6 Key Developments
13.2 Fjellstrand AS
13.2.1 Key Facts
13.2.2 Business Description
13.2.3 Products and Services
13.2.4 Financial Overview
13.2.5 SWOT Analysis
13.2.6 Key Developments
13.3 X Shore
13.3.1 Key Facts
13.3.2 Business Description
13.3.3 Products and Services
13.3.4 Financial Overview
13.3.5 SWOT Analysis
13.3.6 Key Developments
13.4 General Dynamic Electric Boat
13.4.1 Key Facts
13.4.2 Business Description
13.4.3 Products and Services
13.4.4 Financial Overview
13.4.5 SWOT Analysis
13.4.6 Key Developments
13.5 Hurtigruten
13.5.1 Key Facts
13.5.2 Business Description
13.5.3 Products and Services
13.5.4 Financial Overview
13.5.5 SWOT Analysis
13.5.6 Key Developments
13.6 MAN Energy Solutions
13.6.1 Key Facts
13.6.2 Business Description
13.6.3 Products and Services
13.6.4 Financial Overview
13.6.5 SWOT Analysis
13.6.6 Key Developments
13.7 PortLiner
13.7.1 Key Facts
13.7.2 Business Description
13.7.3 Products and Services
13.7.4 Financial Overview
13.7.5 SWOT Analysis
13.7.6 Key Developments
13.8 Siemens Energy
13.8.1 Key Facts
13.8.2 Business Description
13.8.3 Products and Services
13.8.4 Financial Overview
13.8.5 SWOT Analysis
13.8.6 Key Developments
13.9 VARD AS
13.9.1 Key Facts
13.9.2 Business Description
13.9.3 Products and Services
13.9.4 Financial Overview
13.9.5 SWOT Analysis
13.9.6 Key Developments
14. Appendix
14.1 About The Insight Partners
14.2 Glossary of Terms
LIST OF TABLES
Table 1. Europe Electric Ship Market Revenue and Forecasts to 2027 (US$ Million)
Table 2. Europe Electric Ship Market, Revenue and Forecast To 2028 – By Country (US$ million)
Table 3. Germany Electric Ship Market, Revenue and Forecast to 2028 – By Type (US$ million)
Table 4. Germany Electric Ship Market, Revenue and Forecast to 2028 – By Power (US$ million)
Table 5. Germany Electric Ship Market, Revenue and Forecast to 2028 – By Range (US$ million)
Table 6. Germany Electric Ship Market, Revenue and Forecast to 2028 – By Ship Type (US$ million)
Table 7. France Electric Ship Market, Revenue and Forecast to 2028 – By Type (US$ million)
Table 8. France Electric Ship Market, Revenue and Forecast to 2028 – By Power (US$ million)
Table 9. France Electric Ship Market, Revenue and Forecast to 2028 – By Range (US$ million)
Table 10. France Electric Ship Market, Revenue and Forecast to 2028 – By Ship Type (US$ million)
Table 11. Italy Electric Ship Market, Revenue and Forecast to 2028 – By Type (US$ million)
Table 12. Italy Electric Ship Market, Revenue and Forecast to 2028 – By Power (US$ million)
Table 13. Italy Electric Ship Market, Revenue and Forecast to 2028 – By Range (US$ million)
Table 14. Italy Electric Ship Market, Revenue and Forecast to 2028 – By Ship Type (US$ million)
Table 15. UK Electric Ship Market, Revenue and Forecast to 2028 – By Type (US$ million)
Table 16. UK Electric Ship Market, Revenue and Forecast to 2028 – By Power (US$ million)
Table 17. UK Electric Ship Market, Revenue and Forecast to 2028 – By Range (US$ million)
Table 18. UK Electric Ship Market, Revenue and Forecast to 2028 – By Ship Type (US$ million)
Table 19. Rest of Europe Electric Ship Market, Revenue and Forecast to 2028 – By Type (US$ million)
Table 20. Rest of Europe Electric Ship Market, Revenue and Forecast to 2028 – By Power (US$ million)
Table 21. Rest of Europe Electric Ship Market, Revenue and Forecast to 2028 – By Range (US$ million)
Table 22. Rest of Europe Electric Ship Market, Revenue and Forecast to 2028 – By Ship Type (US$ million)
Table 23. Glossary of Term
LIST OF FIGURES
Figure 1. Europe Electric Ship Market Segmentation
Figure 2. Europe Electric Ship Market Segmentation – By Country
Figure 3. Europe Electric Ship Market Overview
Figure 4. Hybrid Electric Ships Segment Held the Largest Market Share in 2020
Figure 5. Europe 746 - 7560 Kw Held the Largest Market Share in 2020
Figure 6. Europe 101 – 1000 Km Held the Largest Market Share in 2020
Figure 7. Ferries Held the Largest Market Share in 2020
Figure 8. Germany was the Largest Revenue Contributor in 2020
Figure 9. Europe PEST - Analysis
Figure 10. Electric Ship Market – Ecosystem Analysis
Figure 11. Europe Electric Ship Market: Impact Analysis of Drivers and Restraints
Figure 12. Europe Electric Ship Market Forecast and Analysis to 2028, US$ Million
Figure 13. Europe Electric Ships Market Revenue Share, by Type (2020 and 2028)
Figure 14. Europe Battery Electric Ships: Electric Ships Market – Revenue and Forecast to 2028 (US$ Million)
Figure 15. Europe Plug-in Electric Ships: Electric Ships Market – Revenue and Forecast to 2028 (US$ Million)
Figure 16. Europe Hybrid Electric Ships: Electric Ships Market – Revenue and Forecast to 2028 (US$ Million)
Figure 17. Europe Electric Ships Market Revenue Share, by Power (2020 and 2028)
Figure 18. Europe Less than 75kW: Electric Ships Market – Revenue and Forecast to 2028 (US$ Million)
Figure 19. Europe 75kW-150kW: Electric Ships Market – Revenue and Forecast to 2028 (US$ Million)
Figure 20. Europe 151kW-745kW: Electric Ships Market – Revenue and Forecast to 2028 (US$ Million)
Figure 21. Europe 746kW-7560kW: Electric Ships Market – Revenue and Forecast to 2028 (US$ Million)
Figure 22. Europe More than 7560kW: Electric Ships Market – Revenue and Forecast to 2028 (US$ Million)
Figure 23. Europe Electric Ships Market Revenue Share, by Range (2020 and 2028)
Figure 24. Europe Less than 50 Km: Electric Ships Market – Revenue and Forecast to 2028 (US$ Million)
Figure 25. Europe 50-100 Km: Electric Ships Market – Revenue and Forecast to 2028 (US$ Million)
Figure 26. Europe 100-1001 Km: Electric Ships Market – Revenue and Forecast to 2028 (US$ Million)
Figure 27. Europe More than 1000 Km: Electric Ships Market – Revenue and Forecast to 2028 (US$ Million)
Figure 28. Europe Electric Ships Market Revenue Share, by Ship Type (2020 and 2028)
Figure 29. Europe Cruise Ships: Electric Ships Market – Revenue and Forecast to 2028 (US$ Million)
Figure 30. Europe Ferries: Electric Ships Market – Revenue and Forecast to 2028 (US$ Million)
Figure 31. Europe Tankers: Electric Ships Market – Revenue and Forecast to 2028 (US$ Million)
Figure 32. Europe Bulk Carriers: Electric Ships Market – Revenue and Forecast to 2028 (US$ Million)
Figure 33. Europe Fishing Vessels: Electric Ships Market – Revenue and Forecast to 2028 (US$ Million)
Figure 34. Europe Destroyers: Electric Ships Market – Revenue and Forecast to 2028 (US$ Million)
Figure 35. Europe Aircraft Carriers: Electric Ships Market – Revenue and Forecast to 2028 (US$ Million)
Figure 36. Europe Others: Electric Ships Market – Revenue and Forecast to 2028 (US$ Million)
Figure 37. Europe Electric Ship Market, by Key Country – Revenue (2020) (US$ Million)
Figure 38. Europe Electric Ship Market Breakdown, by Country, 2020 & 2027(%)
Figure 39. Germany Electric Ship Market, Revenue and Forecast to 2028 (US$ million)
Figure 40. France Electric Ship Market, Revenue and Forecast to 2028 (US$ million)
Figure 41. Italy Electric Ship Market, Revenue and Forecast to 2028 (US$ million)
Figure 42. UK Electric Ship Market, Revenue and Forecast to 2028 (US$ million)
Figure 43. Rest of Europe Electric Ship Market, Revenue and Forecast to 2028 (US$ million)
CONTACT US
If you have any queries about this report or would like further information, please contact us:
North America: +1 646 491 9876
Asia-Pacific: +91 20 6727 8686
Email: sales@theinsightpartners.com
DISCLAIMER
All Rights Reserved.
No part of this publication may be reproduced, stored in a retrieval system or transmitted in any form by any means, electronic, mechanical, photocopying, recording or otherwise without the prior permission of the publisher, “The Insight Partners”.
- BAE System
- Fjellstrand AS
- X Shore
- General Dynamic Electric Boat
- Hurtigruten
- MAN Energy Solution
- PortLiner
- Siemens Energy
- Vard AS
- Save and reduce time carrying out entry-level research by identifying the growth, size, leading players, and segments in the Europe electric ship market.
- Highlights key business priorities in order to assist companies to realign their business strategies
- The key findings and recommendations highlight crucial progressive industry trends in the Europe electric ship market, thereby allowing players across the value chain to develop effective long-term strategies
- Develop/modify business expansion plans by using substantial growth offering developed and emerging markets
- Scrutinize in-depth Europe market trends and outlook coupled with the factors driving the Europe electric ship market, as well as those hindering it
- Enhance the decision-making process by understanding the strategies that underpin commercial interest with respect to client products, segmentation, pricing, and distribution