Europe Carbon Black Market Forecast to 2028 - COVID-19 Impact and Regional Analysis By Type (Acetylene Black, Channel Black, Furnace Black, Thermal Black, and Others), Grade (Standard Grade and Specialty Grade), and Application (Tire, Non-Tire Rubber, Plastics, Inks & Coatings, and Others)

BMIRE00028316 | Pages: 121 | Chemicals and Materials | Apr 2023 | Type: Regional | Status: Published

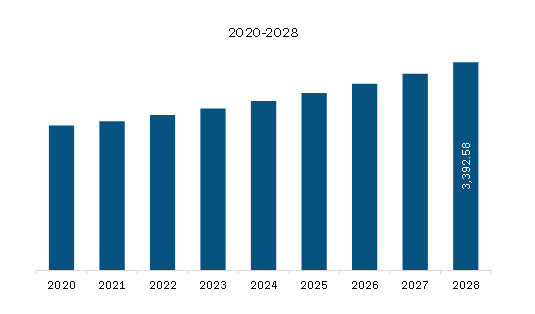
The Europe carbon black market is expected to grow from US$ 2,530.99 million in 2022 to US$ 3,392.58 million by 2028. It is estimated to grow at a CAGR of 5.0% from 2022 to 2028.

Increasing Demand for Specialty Carbon Black is Driving Europe Carbon Black Market

Specialty carbon black is the purest form of carbon black with a low level of ash, sulfur, metals, and other impurities. It is produced through the partial combustion of hydrocarbons such as oil and gas to meet rigorous specifications and deliver necessary functionality according to end-user requirements. Specialty carbon black is used as a reinforcing agent in hoses, belts, gaskets, vibration isolation devices, diaphragms, bushings, air springs, chassis bumpers, conveyor wheels, and grommets. It is also used in refuse sacks, industrial bags, photographic containers, stretch wrap, agriculture mulch film, thermoplastic molding applications for automotive, electrical/electronics, and blow-molded containers.

The rising demand for conductive specialty carbon black products and conductive additives is creating significant potential in various end-use industries such as transportation, industrial, and building & construction. Conductive carbon black is an extremely versatile substance and used for lithium-ion batteries, fuel cells, and polymer applications. Electric vehicles are a promising option to reduce greenhouse gas emissions and air pollution in densely populated areas and contribute to energy diversification. According to the International Energy Agency, in 2020, more than 10 million electric cars were on the road across the world, with an increase of 43% compared to 2019. Battery electric vehicles accounted for two-thirds of new electric car registrations and two-thirds of the stock in 2020. Europe had the largest annual increase and reached 3.2 million electric cars. Increasing preference for electric vehicles is driving the demand for specialty carbon black. Moreover, manufacturers are increasing their investments in developing countries to meet the surging demand for specialty carbon black.   

Europe Carbon Black Market Overview

Major economies in Europe include Germany, France, Italy, the UK, and Russia. The automotive industry is one of the most rapidly growing industries in the European economy. The industry is witnessing significant growth due to an increase in automotive production. According to the European Automobile Manufacturers’ Association (ACEA), in 2021, ~12 million units of motor vehicles were produced in the region. The region holds lucrative opportunities for the carbon black market players, owing to the huge demand from the tire industry. Carbon black is used to improve the processing, strength, and durability of tires, and enhance automotive tire manufacturing and overall tire performance. Thus, the rising automotive industry in Europe is boosting the demand for tires, which is expected to drive the carbon black market during the forecast period.   

Europe Carbon Black Market Revenue and Forecast to 2028 (US$ Million)

Europe Carbon Black Market Revenue and Forecast to 2028 (US$ Million)

Get more information on this report :

Europe Carbon Black Market Segmentation

The Europe carbon black market is segmented into type, grade, application, and country.

Based on type, the Europe carbon black market is sub segmented into acetylene black, channel black, furnace black, thermal black, and others. The furnace black segment held the largest market share in 2022.  

Based on grade, the Europe carbon black market is segmented into standard grade and specialty grade. The standard grade segment held the larger market share in 2022.

Based on application, the Europe carbon black market is segmented into tire, non-tire rubber, plastics, inks & coatings, and others. The tire segment held the largest market share in 2022.

Based on country, the Europe carbon black market is segmented into Germany, France, the UK, Italy, Russia, and the Rest of Europe. Germany dominated the market in 2022.

HiiROC Ltd; Black Bear Carbon BV; Klean Industries Inc; OMSK Carbon Group Ltd; Imerys SA; Tokai Carbon Co Ltd; Orion Engineered Carbons SA; and Cabot Corp are the leading companies operating in the Europe carbon black market.

1.           Introduction

1.1         Study Scope

1.2         The Insight Partners Research Report Guidance

1.3         Market Segmentation

1.3.1        Europe Carbon Black Market, by Type

1.3.2        Europe Carbon Black Market, by Grade

1.3.3        Europe Carbon Black Market, by Application

1.3.4        Europe Carbon Black Market, by Country

2.           Key Takeaways

3.        Research Methodology

3.1         Scope of the Study

3.2         Research Methodology

3.2.1        Data Collection:

3.2.2        Primary Interviews:

3.2.3        Hypothesis formulation:

3.2.4        Macro-economic factor analysis:

3.2.5        Developing base number:

3.2.6        Data Triangulation:

3.2.7        Country level data:

4.           Europe Carbon Black Market Landscape

4.1         Market Overview

4.2         Porter's Five Forces Analysis

4.2.1        Bargaining Power of Suppliers

4.2.2        Bargaining Power of Buyers

4.2.3        Threat of Substitutes

4.2.4        Threat of New Entrants

4.2.5        Competitive Rivalry

4.3         Ecosystem Analysis

4.4         Expert Opinions

5.           Europe Carbon Black Market – Key Market Dynamics

5.1         Market Drivers

5.1.1        Growing Automotive Tire Sector in Developing Economies

5.1.2        Increasing Demand for Specialty Carbon Black

5.2         Market Restraints

5.2.1        High Carbon Emission by Virgin Carbon Black

5.3         Market Opportunities

5.3.1        Rising Need for Green Alternatives with Shift Toward Sustainability

5.4         Future Trends

5.4.1        Emphasis on Waste Tire Management

5.5         Impact Analysis

6.           Carbon Black Market – Europe Analysis

6.1         Europe Carbon Black Market –Revenue and Forecast to 2028 (US$ Million)

7.           Europe Carbon Black Market Analysis – By Type

7.1         Overview

7.2         Europe Carbon Black Market, By Type (2021 and 2028)

7.3         Acetylene Black

7.3.1        Overview

7.3.2        Acetylene Black: Europe Carbon Black Market – Revenue and Forecast to 2028 (US$ Million)

7.4         Channel Black

7.4.1        Overview

7.4.2        Channel Black: Europe Carbon Black Market – Revenue and Forecast to 2028 (US$ Million)

7.5         Furnace Black

7.5.1        Overview

7.5.2        Furnace Black: Europe Carbon Black Market – Revenue and Forecast to 2028 (US$ Million)

7.6         Thermal Black

7.6.1        Overview

7.6.2        Thermal Black: Carbon Black Market – Revenue and Forecast to 2028 (US$ Million)

7.7         Others

7.7.1        Overview

7.7.2        Others: Carbon Black Market – Revenue and Forecast to 2028 (US$ Million)

8.           Europe Carbon Black Market Analysis – By Grade

8.1         Overview

8.2         Europe Carbon Black Market, By Grade (2021 and 2028)

8.3         Standard Grade

8.3.1        Overview

8.3.2        Standard Grade: Europe Carbon Black Market – Revenue and Forecast to 2028 (US$ Million)

8.4         Specialty Grade

8.4.1        Overview

8.4.2        Specialty Grade: Europe Carbon Black Market – Revenue and Forecast to 2028 (US$ Million)

9.           Europe Carbon Black Market Analysis – By Application

9.1         Overview

9.2         Europe Carbon Black Market, By Application (2021 and 2028)

9.3         Tire

9.3.1        Overview

9.3.2        Tire: Europe Carbon Black Market – Revenue and Forecast to 2028 (US$ Million)

9.4         Non-Tire Rubber

9.4.1        Overview

9.4.2        Non-Tire Rubber: Europe Carbon Black Market – Revenue and Forecast to 2028 (US$ Million)

9.5         Plastics

9.5.1        Overview

9.5.2        Plastics: Europe Carbon Black Market – Revenue and Forecast to 2028 (US$ Million)

9.6         Inks and Coatings

9.6.1        Overview

9.6.2        Inks and Coatings: Europe Carbon Black Market – Revenue and Forecast to 2028 (US$ Million)

9.7         Others

9.7.1        Overview

9.7.2        Others: Europe Carbon Black Market – Revenue and Forecast to 2028 (US$ Million)

10.        Europe Carbon Black Market – Country Analysis

10.1      Overview

10.1.1     Europe: Carbon Black Market, by Key Country

10.1.1.1       Germany: Carbon Black Market – Revenue and Forecast to 2028 (US$ Million)

10.1.1.1.1       Germany: Carbon Black Market, By Type

10.1.1.1.2       Germany: Carbon Black Market, by Grade

10.1.1.1.3       Germany: Carbon Black Market, by Application

10.1.1.2       France: Carbon Black Market – Revenue and Forecast to 2028 (US$ Million)

10.1.1.2.1       France: Carbon Black Market, By Type

10.1.1.2.2       France: Carbon Black Market, by Grade

10.1.1.2.3       France: Carbon Black Market, by Application

10.1.1.3       UK: Carbon Black Market – Revenue and Forecast to 2028 (US$ Million)

10.1.1.3.1       UK: Carbon Black Market, By Type

10.1.1.3.2       UK: Carbon Black Market, by Grade

10.1.1.3.3       UK: Carbon Black Market, by Application

10.1.1.4       Italy: Carbon Black Market – Revenue and Forecast to 2028 (US$ Million)

10.1.1.4.1       Italy: Carbon Black Market, By Type

10.1.1.4.2       Italy: Carbon Black Market, by Grade

10.1.1.4.3       Italy: Carbon Black Market, by Application

10.1.1.5       Russia: Carbon Black Market – Revenue and Forecast to 2028 (US$ Million)

10.1.1.5.1       Russia: Carbon Black Market, By Type

10.1.1.5.2       Russia: Carbon Black Market, by Grade

10.1.1.5.3       Russia: Carbon Black Market, by Application

10.1.1.6       Rest of Europe: Carbon Black Market – Revenue and Forecast to 2028 (US$ Million)

10.1.1.6.1       Rest of Europe: Carbon Black Market, By Type

10.1.1.6.2       Rest of Europe: Carbon Black Market, by Grade

10.1.1.6.3       Rest of Europe: Carbon Black Market, by Application

11.        Industry Landscape

11.1      Product launch

11.2      Expansion

12.        Company Profiles

12.1      HiiROC Ltd

12.1.1     Key Facts

12.1.2     Business Description

12.1.3     Products and Services

12.1.4     Financial Overview

12.1.5     SWOT Analysis

12.1.6     Key Developments

12.2      Black Bear Carbon BV

12.2.1     Key Facts

12.2.2     Business Description

12.2.3     Products and Services

12.2.4     Financial Overview

12.2.5     SWOT Analysis

12.2.6     Key Developments

12.3      Klean Industries Inc

12.3.1     Key Facts

12.3.2     Business Description

12.3.3     Products and Services

12.3.4     Financial Overview

12.3.5     SWOT Analysis

12.3.6     Key Developments

12.4      OMSK Carbon Group Ltd

12.4.1     Key Facts

12.4.2     Business Description

12.4.3     Products and Services

12.4.4     Financial Overview

12.4.5     SWOT Analysis

12.4.6     Key Developments

12.5      Imerys SA

12.5.1     Key Facts

12.5.2     Business Description

12.5.3     Products and Services

12.5.4     Financial Overview

12.5.5     SWOT Analysis

12.5.6     Key Developments

12.6      Cabot Corp

12.6.1     Key Facts

12.6.2     Business Description

12.6.3     Products and Services

12.6.4     Financial Overview

12.6.5     SWOT Analysis

12.6.6     Key Developments

12.7      Tokai Carbon Co Ltd

12.7.1     Key Facts

12.7.2     Business Description

12.7.3     Products and Services

12.7.4     Financial Overview

12.7.5     SWOT Analysis

12.7.6     Key Developments

12.8      Orion Engineered Carbons SA

12.8.1     Key Facts

12.8.2     Business Description

12.8.3     Products and Services

12.8.4     Financial Overview

12.8.5     SWOT Analysis

12.8.6     Key Developments

13.        Appendix

13.1      About The Insight Partners

13.2      Glossary of Terms


LIST OF TABLES

Table 1.             Europe Carbon Black Market –Revenue and Forecast to 2028 (US$ Million)

Table 2.             Germany Carbon Black Market, By Type – Revenue and Forecast to 2028 (US$ Million)

Table 3.             Germany Carbon Black Market, by Grade – Revenue and Forecast to 2028 (US$ Million)

Table 4.             Germany Carbon Black Market, by Application – Revenue and Forecast to 2028 (US$ Million)

Table 5.             France Carbon Black Market, By Type – Revenue and Forecast to 2028 (US$ Million)

Table 6.             France Carbon Black Market, by Grade – Revenue and Forecast to 2028 (US$ Million)

Table 7.             France Carbon Black Market, by Application – Revenue and Forecast to 2028 (US$ Million)

Table 8.             UK Carbon Black Market, By Type – Revenue and Forecast to 2028 (US$ Million)

Table 9.             UK Carbon Black Market, by Grade – Revenue and Forecast to 2028 (US$ Million)

Table 10.          UK Carbon Black Market, by Application – Revenue and Forecast to 2028 (US$ Million)

Table 11.          Italy Carbon Black Market, By Type – Revenue and Forecast to 2028 (US$ Million)

Table 12.          Italy Carbon Black Market, by Grade – Revenue and Forecast to 2028 (US$ Million)

Table 13.          Italy Carbon Black Market, by Application – Revenue and Forecast to 2028 (US$ Million)

Table 14.          Russia Carbon Black Market, By Type – Revenue and Forecast to 2028 (US$ Million)

Table 15.          Russia Carbon Black Market, by Grade – Revenue and Forecast to 2028 (US$ Million)

Table 16.          Russia Carbon Black Market, by Application – Revenue and Forecast to 2028 (US$ Million)

Table 17.          Rest of Europe Carbon Black Market, By Type – Revenue and Forecast to 2028 (US$ Million)

Table 18.          Rest of Europe Carbon Black Market, by Grade – Revenue and Forecast to 2028 (US$ Million)

Table 19.          Rest of Europe Carbon Black Market, by Application – Revenue and Forecast to 2028 (US$ Million)

Table 20.          Glossary of Terms, Europe Carbon Black Market


LIST OF FIGURES

Figure 1.           Europe Carbon Black Market Segmentation

Figure 2.           Europe Carbon Black Market Segmentation – By Country

Figure 3.           Europe Carbon Black Market Overview

Figure 4.           Europe Carbon Black Market, By Type

Figure 5.           Europe Carbon Black Market, by Country

Figure 6.           Porter's Five Forces Analysis for Europe Carbon Black Market

Figure 7.           Ecosystem: Europe Carbon Black Market

Figure 8.           Expert Opinions

Figure 9.           Europe Carbon Black Market Impact Analysis of Drivers and Restraints

Figure 10.        Europe Carbon Black Market – Revenue and Forecast to 2028 (US$ Million)

Figure 11.        Europe Carbon Black Market Revenue Share, By Type (2021 and 2028)

Figure 12.        Acetylene Black: Europe Carbon Black Market – Revenue and Forecast To 2028 (US$ Million)

Figure 13.        Channel Black: Europe Carbon Black Market – Revenue and Forecast To 2028 (US$ Million)

Figure 14.        Furnace Black: Europe Carbon Black Market – Revenue and Forecast To 2028 (US$ Million)

Figure 15.        Thermal Black: Europe Carbon Black Market – Revenue and Forecast To 2028 (US$ Million)

Figure 16.        Others: Europe Carbon Black Market – Revenue and Forecast To 2028 (US$ Million)

Figure 17.        Europe Carbon Black Market Revenue Share, By Grade (2021 and 2028)

Figure 18.        Standard Grade: Europe Carbon Black Market – Revenue and Forecast To 2028 (US$ Million)

Figure 19.        Specialty Grade: Europe Carbon Black Market – Revenue and Forecast To 2028 (US$ Million)

Figure 20.        Europe Carbon Black Market Revenue Share, By Application (2021 and 2028)

Figure 21.        Tire: Europe Carbon Black Market – Revenue and Forecast To 2028 (US$ Million)

Figure 22.        Non-Tire Rubber: Europe Carbon Black Market – Revenue and Forecast To 2028 (US$ Million)

Figure 23.        Plastics: Europe Carbon Black Market – Revenue and Forecast To 2028 (US$ Million)

Figure 24.        Inks and Coatings: Europe Carbon Black Market – Revenue and Forecast To 2028 (US$ Million)

Figure 25.        Others: Europe Carbon Black Market – Revenue and Forecast To 2028 (US$ Million)

Figure 26.        Europe: Carbon Black Market, by Key Country – Revenue (2021) (US$ Million)

Figure 27.        Europe: Carbon Black Market Revenue Share, by Key Country (2021 and 2028)

Figure 28.        Germany: Carbon Black Market – Revenue and Forecast to 2028 (US$ Million)

Figure 29.        France: Carbon Black Market – Revenue and Forecast to 2028 (US$ Million)

Figure 30.        UK: Carbon Black Market – Revenue and Forecast to 2028 (US$ Million)

Figure 31.        Italy: Carbon Black Market – Revenue and Forecast to 2028 (US$ Million)

Figure 32.        Russia: Carbon Black Market – Revenue and Forecast to 2028 (US$ Million)

Figure 33.        Rest of Europe: Carbon Black Market – Revenue and Forecast to 2028 (US$ Million)


  1. HiiROC Ltd
  2. Black Bear Carbon BV
  3. Klean Industries Inc
  4. OMSK Carbon Group Ltd
  5. Imerys SA
  6. Tokai Carbon Co Ltd
  7. Orion Engineered Carbons SA
  8. Cabot Corp
  • Save and reduce time carrying out entry-level research by identifying the growth, size, leading players and segments in the Europe carbon black market
  • Highlights key business priorities in order to assist companies to realign their business strategies
  • The key findings and recommendations highlight crucial progressive industry trends in the Europe carbon black market, thereby allowing players across the value chain to develop effective long-term strategies
  • Develop/modify business expansion plans by using substantial growth offering developed and emerging markets
  • Scrutinize in-depth Europe market trends and outlook coupled with the factors driving the carbon black market, as well as those hindering it
  • Enhance the decision-making process by understanding the strategies that underpin commercial interest with respect to client products, segmentation, pricing and distribution


Report Code
Full Name
Country Name
Email Id
Phone Number
Job Title
Company
Requirement

Note : Your data will never be shared with third parties, however, we may send you information from time to time about our products that may be of interest to you. By submitting your details, you agree to be contacted by us. You may contact us at any time to opt-out.


Purchase Options
Single User License
$3000
$2400
Site License
$4000
$3200
Enterprise License
$5000
$4000