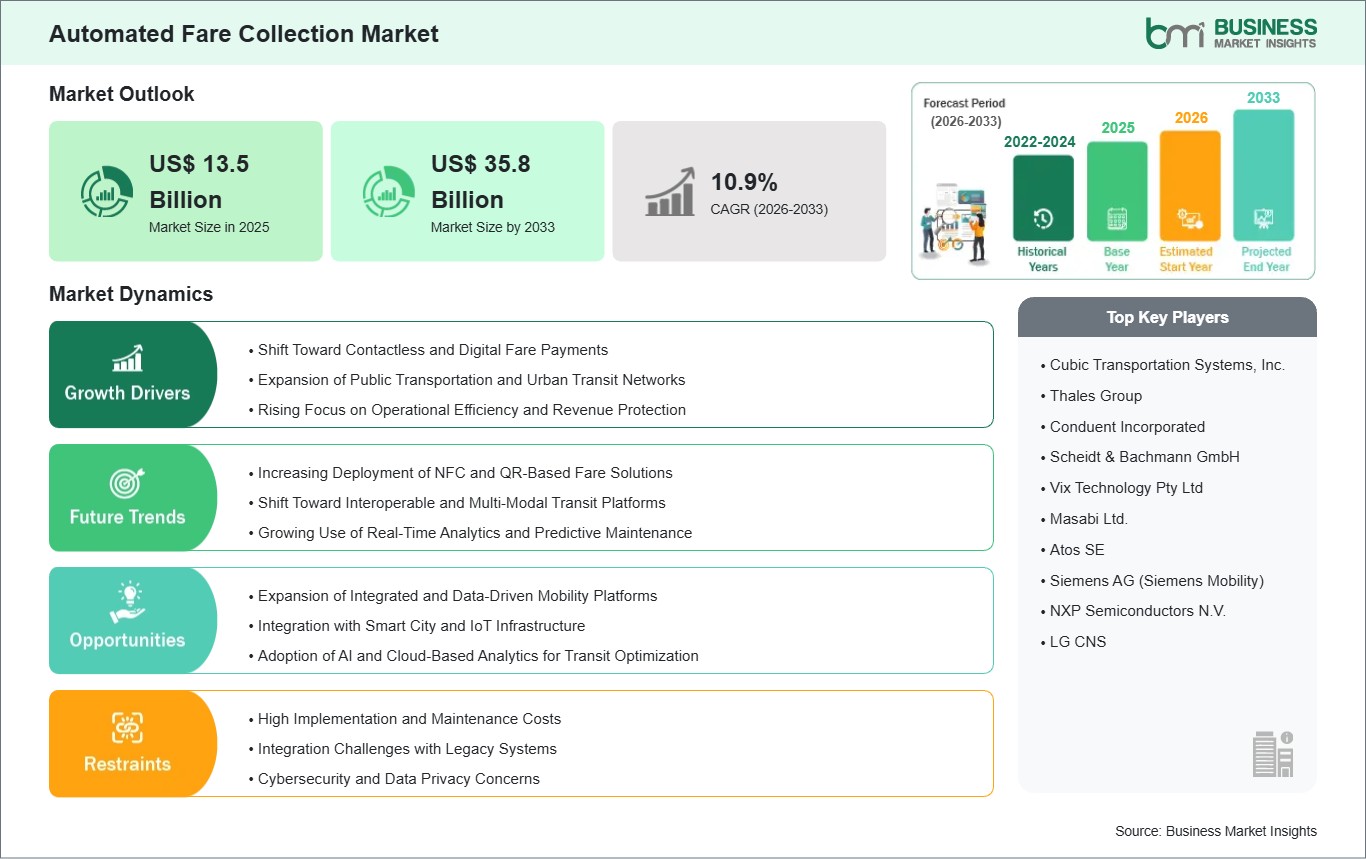
The Automated Fare Collection Market size is expected to reach US$ 35.8 Billion by 2033 from US$ 13.5 Billion in 2025. The market is estimated to record a CAGR of 12.96% from 2026 to 2033.
Executive Summary and Global Market Analysis:
The Automated Fare Collection (AFC) market serves as a critical enabler of modern, intelligent transportation systems, supporting efficient, secure, and seamless fare management across public transit, railways, metros, buses, and tolling infrastructure. Automated Fare Collection solutions integrate hardware components such as smart cards, ticket vending machines, validators, and gates with advanced software platforms to enable real-time fare processing, transaction validation, and revenue management. These systems play a central role in enhancing passenger convenience, minimizing revenue leakage, and improving operational transparency for transport authorities and operators.
Automated Fare Collection systems are pivotal in managing the growing complexity of urban mobility ecosystems, including multimodal transportation networks, contactless and mobile payments, and integrated ticketing platforms. They support key functionalities such as real-time transaction processing, data analytics, passenger flow monitoring, and secure payment authentication, ensuring high reliability, scalability, and interoperability across transport modes and service providers. The integration of AFC systems with cloud platforms, IoT devices, and centralized back-office solutions further enables data-driven decision-making and optimized network performance.
Market growth is driven by rapid urbanization, increasing investments in public transportation infrastructure, and rising demand for contactless and digital payment solutions. The adoption of smart cards, mobile ticketing, QR-based payments, and account-based ticketing is accelerating globally, supported by advancements in connectivity, cybersecurity, and data analytics. Additionally, government initiatives focused on smart cities, sustainable mobility, and cashless economies are further strengthening demand. Collectively, these factors position the Automated Fare Collection market as a foundational component of next-generation, efficient, and user-centric transportation systems.
Automated Fare Collection Market - Strategic Insights:
Get more information on this report
Automated Fare Collection Market Segmentation Analysis:
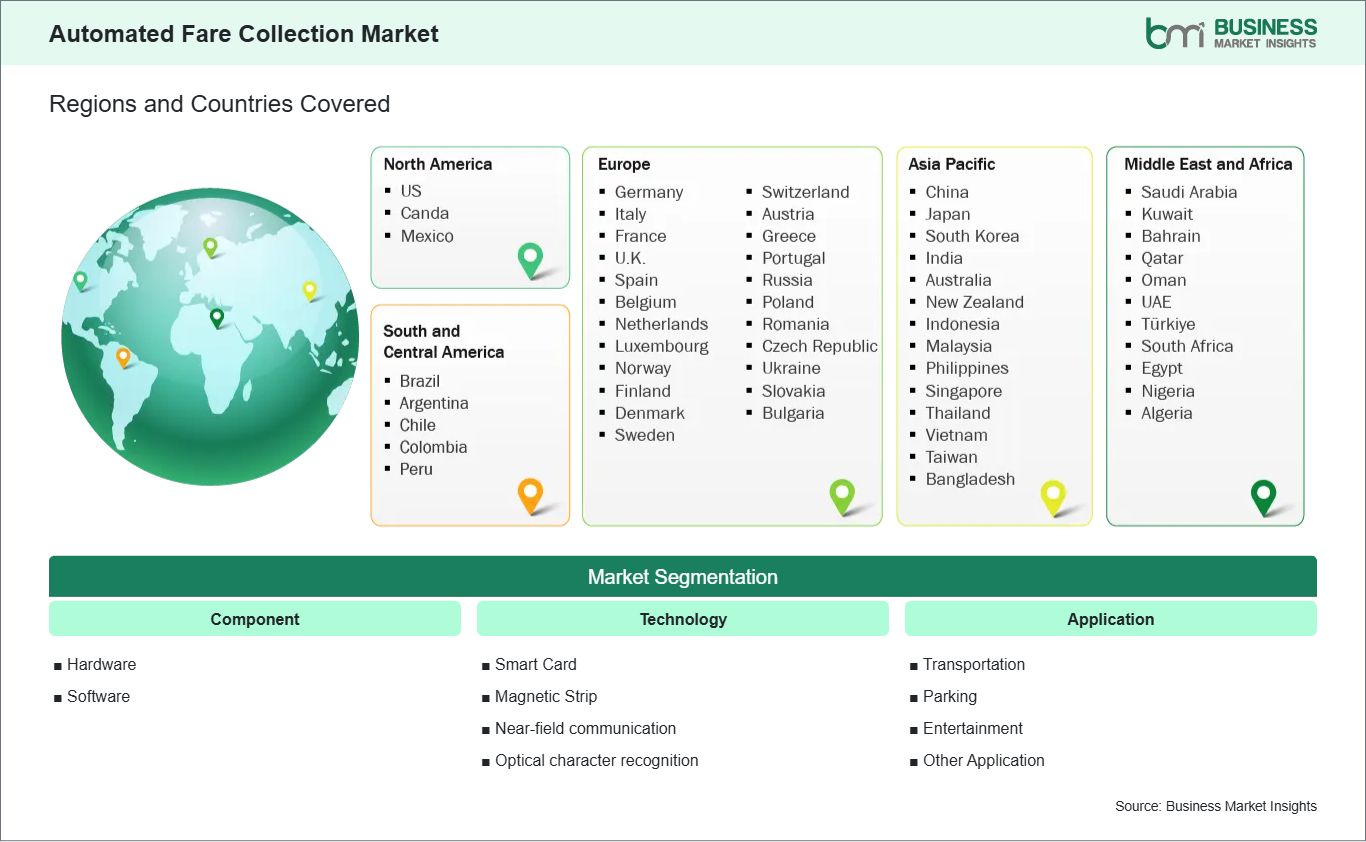
Key segments that contributed to the derivation of the Automated Fare Collection market analysis are component, technology, and application.
By component, the Automated Fare Collection market is divided into Hardware and Software. The Hardware segment held the larger share in 2024.
By technology, the market is divided into Smart Card, Magnetic Strip, Near-field communication (NFC), Optical character recognition (OCR). The Smart Card segment held the larger share in 2024.
By application, the market is divided into Transportation, Parking, Entertainment, Others. The Transportation segment held the larger share in 2024.
Automated Fare Collection Market Drivers and Opportunities:
Shift Toward Contactless and Digital Fare Payments
The accelerating shift toward contactless and digital fare payment systems is a fundamental driver of the Automated Fare Collection market. Urban transit authorities and transport operators are under increasing pressure to modernize legacy fare systems to meet rising passenger expectations for speed, convenience, and safety. Contactless smart cards, mobile ticketing applications, QR-code–based payments, and account-based ticketing models significantly reduce transaction times, eliminate cash handling, and lower operational and maintenance costs. These solutions also enhance revenue protection by minimizing fare evasion and improving transaction accuracy.
The pandemic further reinforced the need for touchless payment methods, creating long-term behavioral changes among commuters and accelerating digital adoption. Additionally, the widespread penetration of smartphones and digital wallets has made mobile-based fare payments more accessible across both developed and emerging economies. Governments and municipalities are actively supporting this transition through smart city initiatives, investments in intelligent transport systems, and policies promoting cashless economies.
Expansion of Integrated and Data-Driven Mobility Platforms
A significant growth opportunity for the Automated Fare Collection market lies in the expansion of integrated, data-driven mobility platforms that go beyond traditional fare payment functions. Transport authorities are increasingly seeking AFC solutions that can seamlessly integrate with cloud infrastructure, advanced analytics, and multimodal transportation networks. Modern AFC platforms generate large volumes of passenger and transaction data, which can be leveraged to gain insights into travel behavior, peak demand patterns, and system performance.
By integrating AFC systems with mobility-as-a-service (MaaS) platforms, operators can enable seamless travel across buses, metros, rail, bike-sharing, and ride-hailing services using a single payment account. This interoperability enhances passenger experience while opening opportunities for dynamic pricing, subscription-based travel models, and personalized fare offerings. Additionally, real-time analytics derived from AFC data can support better route planning, capacity optimization, and service reliability.
Automated Fare Collection Market Size and Share Analysis:
By component, the Automated Fare Collection market is divided into Hardware and Software. The Hardware segment held the larger share in 2024. Hardware remains the backbone of AFC systems, ensuring accurate fare collection, secure access control, and seamless integration with software platforms for transaction processing and reporting.
By technology, the market is divided into Smart Card, Magnetic Strip, Near-field communication (NFC), Optical character recognition (OCR). The Smart Card segment held the larger share in 2024. Smart cards allow contactless, preloaded, or account-based fare payments, supporting rapid passenger throughput and reducing cash handling.
By application, the market is divided into Transportation, Parking, Entertainment, Others. The Transportation segment held the larger share in 2024. This segment includes metros, buses, light rail, and commuter trains, where automated fare collection is critical to managing passenger flows, ensuring operational efficiency, and maximizing revenue.
Automated Fare Collection Market Report Highlights:
Australia, China, India, Japan, South Korea, Indonesia, Malaysia, Philippines, Singapore, Thailand, Vietnam, Bangladesh, New Zealand, Taiwan
South and Central America
Brazil, Argentina, Peru, Chile, Colombia
Middle East and Africa
Bahrain, Kuwait, Oman, Qatar, Saudi Arabia, United Arab Emirates, Turkiye, South Africa, Egypt, Algeria, Nigeria
Market leaders and key company profiles
Cubic Transportation Systems, Inc.
Thales Group
Conduent Incorporated
Scheidt & Bachmann GmbH
Vix Technology Pty Ltd
Masabi Ltd.
Atos SE
Siemens AG (Siemens Mobility)
NXP Semiconductors N.V.
LG CNS
Get more information on this report
Automated Fare Collection Market Report Coverage and Deliverables:
The "Automated Fare Collection Market Size and Forecast (2022–2033)" report provides a detailed analysis of the market covering below areas:
Automated Fare Collection market size and forecast at global, regional, and country levels for all the key market segments covered under the scope
Automated Fare Collection market trends, as well as market dynamics such as drivers, restraints, and key opportunities
Automated Fare Collection market analysis covering key market trends, global and regional framework, major players, regulations, and recent market developments
Industry landscape and competition analysis covering market concentration, heat map analysis, prominent players, and recent developments for the Automated Fare Collection market
Detailed company profiles, including SWOT analysis
Automated Fare Collection Market Geographic Insights:
The Automated Fare Collection market is geographically segmented into North America, Europe, Asia Pacific, the Middle East & Africa, and South & Central America. Among these regions, Asia Pacific is projected to witness the strongest growth and maintain a leading market position throughout the forecast period, driven primarily by rapid urbanization, expanding public transit networks, government investments in smart mobility infrastructure, and increasing adoption of contactless and digital payment systems. The region benefits from large-scale transit modernization projects, high smartphone penetration, and favorable policy initiatives promoting cashless economies, smart city programs, and intelligent transportation systems, positioning it as a strategic hub for Automated Fare Collection deployment and innovation.
Within Asia Pacific, key markets include China, India, Japan, South Korea, Australia, Singapore, Malaysia, Thailand, Indonesia, Vietnam, Taiwan, and the Rest of Asia. Growth is propelled by extensive metro, bus, and rail networks, rising commuter volumes, and government initiatives aimed at improving public transport efficiency, reducing congestion, and enhancing passenger experience. Leading economies such as China, India, and Japan are at the forefront of adopting account-based ticketing, mobile payments, and contactless smart card solutions, leveraging real-time transaction monitoring, cloud-based back-office systems, and advanced analytics to optimize revenue management and operational efficiency.
Demand in Asia Pacific is further supported by investments in public transit infrastructure, multimodal mobility integration, and smart city programs, coupled with regulatory support, public-private partnerships, and workforce development in transportation technology and digital payment ecosystems. These factors collectively strengthen the regional Automated Fare Collection ecosystem, ensuring sustained market growth and adoption across both urban and semi-urban transport networks.
Get more information on this report
Automated Fare Collection Market Research Report Guidance:
The report includes qualitative and quantitative data in the Automated Fare Collection market across component, technology, application and end user, and geography.
The report starts with the key takeaways (chapter 2), highlighting the key trends and outlook of the Automated Fare Collection market.
Chapter 3 includes the research methodology of the study.
Chapter 4 further includes ecosystem analysis.
Chapter 5 highlights the major industry dynamics in the Automated Fare Collection market, including factors that are driving the market, prevailing deterrents, potential opportunities, as well as future trends. Impact analysis of these drivers and restraints is also covered in this section.
Chapter 6 discusses the Automated Fare Collection market scenario, in terms of historical market revenues, and forecast till the year 2031.
Chapters 7 to 10 cover Automated Fare Collection market segments by component, technology, application, and geography across North America, Europe, Asia Pacific, Middle East and Africa, and South and Central America. They cover the market volume revenue forecast and factors driving the market.
Chapter 11 describes the competitive analysis along with the heat map analysis for the key players operating in the market.
Chapter 12 describes the industry landscape analysis. It provides detailed descriptions of business activities such as market initiatives, new developments, mergers, and joint ventures globally, along with a competitive landscape.
Chapter 13 provides detailed profiles of the major companies operating in the Automated Fare Collection market. Companies have been profiled on the basis of their key facts, business descriptions, products and services, financial overview, SWOT analysis, and key developments.
Chapter 14, i.e., the appendix is inclusive of a brief overview of the company, list of abbreviations, and disclaimer
Automated Fare Collection Market News and Key Development:
The Automated Fare Collection market is evaluated by gathering qualitative and quantitative data post primary and secondary research, which includes important corporate publications, association data, and databases. A few of the key developments in the Automated Fare Collection market are:
In August 2025, Aurionpro Solutions Ltd. has won a substantial USD 30 million contract from MMRDA to design, supply, implement, and maintain the Automatic Fare Collection (AFC) system for Mumbai Metro Lines 4 and 4A. The project includes central clearing software, ticketing hardware, and five years of maintenance, enhancing Aurionpro’s Urban Mobility infrastructure.
In June 2025, Aurionpro announced a significant win to implement its Automated Fare Collection (AFC) system for the public transport system in Egypt. This prestigious project marks a major step forward in expanding Aurionpro’s footprint across the Middle East and Africa region. The project will be executed by Aurionpro Transit Pte Ltd, the Company’s dedicated mobility arm, in collaboration with MasterCard, combining Aurionpro’s cutting-edge transit technologies with MasterCard’s global expertise in payments and mobility.
Key Sources Referred:
World Bank – Global Trade Indicators
World Trade Organization (WTO)
International Monetary Fund (IMF)
International Trade Administration (ITA)
Company website
Company annual reports
Company investor presentations
The List of Companies - Automated Fare Collection Market
Cubic Transportation Systems, Inc.
Thales Group
Conduent Incorporated
Scheidt & Bachmann GmbH
Vix Technology Pty Ltd
Masabi Ltd.
Atos SE
Siemens AG (Siemens Mobility)
NXP Semiconductors N.V.
LG CNS
Frequently Asked Questions
How big is the Automated Fare Collection Market?
The Automated Fare Collection Market is valued at US$ 13.5 Billion in 2025, it is projected to reach US$ 35.8 Billion by 2033.
What is the CAGR for Automated Fare Collection Market by (2026 - 2033)?
As per our report Automated Fare Collection Market, the market size is valued at US$ 13.5 Billion in 2025, projecting it to reach US$ 35.8 Billion by 2033. This translates to a CAGR of approximately 12.96% during the forecast period.
What segments are covered in this report?
The Automated Fare Collection Market report typically cover these key segments-
Component (Hardware, Software)
Technology (Smart Card, Magnetic Strip, Near-field communication (NFC), Optical character recognition (OCR))
Application (Transportation, Parking, Entertainment, Other Application)
What is the historic period, base year, and forecast period taken for Automated Fare Collection Market?
The historic period, base year, and forecast period can vary slightly depending on the specific market research report. However, for the Automated Fare Collection Market report:
Historic Period : 2022-2024
Base Year : 2025
Forecast Period : 2026-2033
Who are the major players in Automated Fare Collection Market?
The Automated Fare Collection Market is populated by several key players, each contributing to its growth and innovation. Some of the major players include:
Cubic Transportation Systems, Inc.
Thales Group
Conduent Incorporated
Scheidt & Bachmann GmbH
Vix Technology Pty Ltd
Masabi Ltd.
Atos SE
Siemens AG (Siemens Mobility)
NXP Semiconductors N.V.
LG CNS
Who should buy this report?
The Automated Fare Collection Market report is valuable for diverse stakeholders, including:
Investors: Provides insights for investment decisions pertaining to market growth, companies, or industry insights. Helps assess market attractiveness and potential returns.
Industry Players: Offers competitive intelligence, market sizing, and trend analysis to inform strategic planning, product development, and sales strategies.
Suppliers and Manufacturers: Helps understand market demand for components, materials, and services related to concerned industry.
Researchers and Consultants: Provides data and analysis for academic research, consulting projects, and market studies.
Financial Institutions: Helps assess risks and opportunities associated with financing or investing in the concerned market.
Essentially, anyone involved in or considering involvement in the Automated Fare Collection Market value chain can benefit from the information contained in a comprehensive market report.


 Get Free Sample For Automated Fare Collection Market


