Analysis - by Service Type (Prevention Service, Detection Service, and Incident Response Service), Enterprise Size (Large Enterprises and SMEs), Application (Network Security, Endpoint Security, Application Security, and Cloud Security), and Industry (BFSI, IT and Telecom, Manufacturing, Retail, Government and Public Sector, Healthcare, and Others)
No. of Pages:107
Report Code:
BMIRE00030178
Category:
Technology, Media and Telecommunications
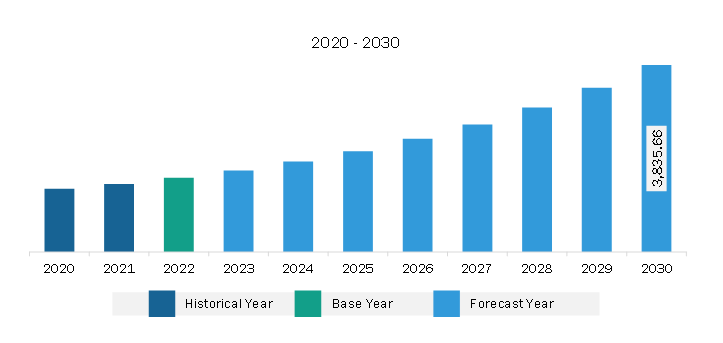
The Asia Pacific SOC as a service market is expected to grow from US$ 1,519.37 million in 2022 to US$ 3,835.66 million by 2030. It is estimated to register a CAGR of 12.3% from 2022 to 2030.
Growing Adoption of SOCaaS in SMEs Boosts Asia Pacific SOC as a Service Market
Various SMEs worldwide have been facing a rise in cyberattacks in recent years. According to Accenture's Cybercrime study, small enterprises record 43% of total cyberattacks annually, of which 46% occurred in small businesses with 1,000 or fewer employees. As a result, on average, SMEs lose US$ 25,000 due to cyberattacks. In addition, in 2020, small enterprises faced over 700,000 attacks, which caused a total of US$ 2.8 billion in damages. Also, as per the World Economic Forum, ~95% of these attacks can be attributed to human error. Also, according to the Check Point, 43% of data breaches are caused by insiders or company employees, considering all cases, whether on purpose or not. Due to such increasing data breach activities, various SMEs witnessed a sharp decline in repeat customers. IBM unveiled that ~50% of small businesses require more than 24 hours to recover from an attack, as over 51% of all small businesses could not access their website for 8-24 hours. Hence, these alarming statistics raise the need for SMEs to implement cybersecurity services to help secure their businesses.
Verizon's 2021 SMB Data Breach Statistics show that SMEs spend between US$ 826 and US$ 653,587 on cybersecurity incidents. According to the same report, cybercrime is also expected to increase by 15%, with costs estimated to reach US$ 10.5 trillion by 2025. Hence, various SMEs are investing in managed security services such as SOCaaS to meet the ever-increasing regulatory and legal requirements. Also, as SOCaaS can provide SMEs with access to a virtual security operations center (SOC), which is responsible for monitoring as well as analyzing network traffic, providing real-time alerts to security teams, and identifying security threats, its adoption is expected to increase in SMEs, creating future opportunities for the growth of the SOC as a service market.
Asia Pacific SOC as a Service Market Overview
The APAC SOC as a service market is categorized into China, India, Japan, Australia, South Korea, and the Rest of APAC. During the forecast period, the market in APAC is anticipated to grow significantly due to the growing need to combine threat detection and prevention operations in a single solution. This shifted enterprises' focus to protect their systems' vulnerability and threat exposures, increasing the demand for SOC as a service among enterprises. The rising adoption of new technologies such as AI and IoT in China, Japan, India, Australia, South Korea, Singapore, and New Zealand is driving the market. AI and IoT technologies are highly vulnerable to cyberattacks, thereby increasing customer demand for SOC as a service to protect data and information. For instance, according to IDC Asia Pacific, spending on IoT is expected to reach US$ 277.5 billion by the end of 2023 and is anticipated to account for US$ 435 billion by 2027. Growing IoT spending increases the risk of cyberattacks on several devices, including smartphones, tablets, laptops, routers, smart watches, webcams, automobiles, household appliances, manufacturing equipment, medical devices, and home security systems connected to the IoT. These devices include sensitive & confidential information and are highly used by consumers in their daily activities. Connected devices are convenient for consumers, and many companies are using them to save money by collecting large amounts of insightful data to streamline their business processes. The growing use of connected devices increases the risk of cyberattacks, making IoT networks more vulnerable to cyber infections and invasions. For instance, if IoT devices get hacked, hackers can use these devices to create havoc, overload networks, or lock down essential equipment for financial gain.
Rising government initiatives for providing security solution to industries is fueling the market. For instance, according to the International Trade Administration, in 2022, Singapore's Cyber Security Agency (CSA) issued licensing for cybersecurity service providers (CSPs). The licensing framework aims to provide greater customer safety by addressing the information imbalance' between customers and CSPs. The licensing framework applies to only two services: penetration testing and managed security operations. These two services have client's sensitive information and are prioritized by the government to protect them from misuse. Moreover, increasing sophisticated cyberattacks and data breaches in China, Japan, and India increase the demand for SOC as a consumer service for protecting data against cyberattacks. For instance, according to AAG report, in Q2 and Q3 2022, China and Japan observed 14,157,775 and 1,246,373 breached accounts and India reached an increase of 15.3% cybercrimes between Q1 and Q2 in 2022, which increases the demand for SOC Services among consumers, thus fueling the market growth in the region.
Asia Pacific SOC as a Service Market Revenue and Forecast to 2030 (US$ Million)
Based on service type, the Asia Pacific SOC as a service market is segmented into prevention service, detection service, and incident response service. The prevention service segment held the largest share of the Asia Pacific SOC as a service market in 2022.
In terms of enterprise size, the Asia Pacific SOC as a service market is bifurcated into large enterprises and SMEs. The large enterprises segment held a larger share of the Asia Pacific SOC as a service market in 2022.
By application, the Asia Pacific SOC as a service market is segmented into network security, endpoint security, application security, and cloud security. The endpoint security segment held the largest share of the Asia Pacific SOC as a service market in 2022.
Based on industry, the Asia Pacific SOC as a service market is categorized into BFSI, IT and telecom, manufacturing, retail, government and public sector, healthcare, and others. The BFSI segment held the largest share of the Asia Pacific SOC as a service market in 2022.
Based on country, the Asia Pacific SOC as a service market is segmented into Australia, China, India, Japan, South Korea, and the Rest of Asia Pacific. China dominated the Asia Pacific SOC as a service market in 2022.
AT&T Inc, Atos SE, Cloudflare Inc, ConnectWise LLC, ESDS Software Solution Ltd, Fortinet Inc, NTT Data Corp, Thales SA, and Verizon Communications Inc are some of the leading companies operating in the Asia Pacific SOC as a service market.
Asia Pacific SOC as a Service Market Strategic Insights
Get more information on this report
Asia Pacific SOC as a Service Market Segmentation Analysis
Asia Pacific SOC as a Service Market Report Highlights
Asia Pacific SOC as a Service Report Scope
Report Attribute
Details
Market size in 2022
US$ 1,519.37 Million
Market Size by 2030
US$ 3,835.66 Million
CAGR (2022 - 2030)
12.3%
Historical Data
2020-2021
Forecast period
2023-2030
Segments Covered
By Service Type
Prevention Service
Detection Service
Incident Response Service
By Enterprise Size
Large Enterprises
SMEs
By Application
Network Security
Endpoint Security
Application Security
Cloud Security
By Industry
BFSI
IT and Telecom
Manufacturing
Retail
Government and Public Sector
Healthcare
Regions and Countries Covered
Asia-Pacific
China, India, Japan, Australia, Rest of Asia-Pacific
Market leaders and key company profiles
AT&T Inc
Atos SE
Cloudflare Inc
ConnectWise LLC
ESDS Software Solution Ltd
Fortinet Inc
NTT Data Corp
Thales SA
Verizon Communications Inc
Get more information on this report
Asia Pacific SOC as a Service Market Country and Regional Insights
Get more information on this report
Identical Market Reports with other Region/Countries
The List of Companies - Asia Pacific SOC as a Service Market
1. AT&T Inc 2. Atos SE3. Cloudflare Inc4. ConnectWise LLC5. ESDS Software Solution Ltd6. Fortinet Inc7. NTT Data Corp8. Thales SA9. Verizon Communications Inc
About Author— Technology, Media and Telecommunications Research Team
Siddhika is an experienced market research professional with over five years of expertise in delivering actionable market intelligence and strategic insights to support business growth and decision-making. She has strong experience in designing and managing end-to-end research engagements, including research planning, data collection, and insight generation.
Proficient in research methodologies, Siddhika synthesizes diverse information sources to deliver accurate, high-quality insights and strategic recommendations. She excels at translating complex market information into strategic narratives that support executive decision-making..
Show More
Frequently Asked Questions
How big is the Asia Pacific SOC as a Service Market?
The Asia Pacific SOC as a Service Market is valued at US$ 1,519.37 Million in 2022, it is projected to reach US$ 3,835.66 Million by 2030.
What is the CAGR for Asia Pacific SOC as a Service Market by (2022 - 2030)?
As per our report Asia Pacific SOC as a Service Market, the market size is valued at US$ 1,519.37 Million in 2022, projecting it to reach US$ 3,835.66 Million by 2030. This translates to a CAGR of approximately 12.3% during the forecast period.
What segments are covered in this report?
The Asia Pacific SOC as a Service Market report typically cover these key segments-
Service Type (Prevention Service, Detection Service, Incident Response Service)
Industry (BFSI, IT and Telecom, Manufacturing, Retail, Government and Public Sector, Healthcare)
What is the historic period, base year, and forecast period taken for Asia Pacific SOC as a Service Market?
The historic period, base year, and forecast period can vary slightly depending on the specific market research report. However, for the Asia Pacific SOC as a Service Market report:
Historic Period : 2020-2021
Base Year : 2022
Forecast Period : 2023-2030
Who are the major players in Asia Pacific SOC as a Service Market?
The Asia Pacific SOC as a Service Market is populated by several key players, each contributing to its growth and innovation. Some of the major players include:
AT&T Inc
Atos SE
Cloudflare Inc
ConnectWise LLC
ESDS Software Solution Ltd
Fortinet Inc
NTT Data Corp
Thales SA
Verizon Communications Inc
Who should buy this report?
The Asia Pacific SOC as a Service Market report is valuable for diverse stakeholders, including:
Investors: Provides insights for investment decisions pertaining to market growth, companies, or industry insights. Helps assess market attractiveness and potential returns.
Industry Players: Offers competitive intelligence, market sizing, and trend analysis to inform strategic planning, product development, and sales strategies.
Suppliers and Manufacturers: Helps understand market demand for components, materials, and services related to concerned industry.
Researchers and Consultants: Provides data and analysis for academic research, consulting projects, and market studies.
Financial Institutions: Helps assess risks and opportunities associated with financing or investing in the concerned market.
Essentially, anyone involved in or considering involvement in the Asia Pacific SOC as a Service Market value chain can benefit from the information contained in a comprehensive market report.


 Get Free Sample For Asia Pacific SOC as a Service Market


