Asia Pacific Photoacoustic Tomography Market
Photoacoustic imaging (optoacoustic imaging or PAI) is an emerging biomedical imaging modality offering the benefits of optical resolution and acoustic depth of penetration. PAI has demonstrated promising potential in a wide range of preclinical and clinical applications with its capacity to provide structural, functional, molecular, and kinetic information using endogenous contrast agents such as hemoglobin, lipid, melanin, and water, or various exogenous contrast agents, or both. Biomedical PAI, which uses mainly pulsed radiation and ultrasound detectors to localize structures with optical absorption contrast, such as blood vessels, was developed in the early 1990s and has led to the rapid growth of research activities. Various clinical studies have shown that the unique diagnostic capability of PAI is related to the detection of malignant tissue by depicting neovascularization and suspicious levels of oxygenation. The central goal in the coming years is to establish PAI as a standard diagnostic tool in a variety of clinical applications. There are fields of biomedical diagnostics where the unique capabilities of PAI make it superior to existing, established imaging methods or in cases where PAI adds additional, previously unachievable diagnostic information to existing imaging techniques in a multimodal imaging system. The use of these features of photoacoustic tomography in clinical research activities will create opportunities for the growth of the photoacoustic tomography market in the forecast period.
With new features and technologies, vendors attract new customers and expand their footprints in upcoming markets. This factor is likely to boost the APAC photoacoustic tomography market at a notable CAGR during the forecast period.

Strategic insights for the Asia Pacific Photoacoustic Tomography provides data-driven analysis of the industry landscape, including current trends, key players, and regional nuances. These insights offer actionable recommendations, enabling readers to differentiate themselves from competitors by identifying untapped segments or developing unique value propositions. Leveraging data analytics, these insights help industry players anticipate the market shifts, whether investors, manufacturers, or other stakeholders. A future-oriented perspective is essential, helping stakeholders anticipate market shifts and position themselves for long-term success in this dynamic region. Ultimately, effective strategic insights empower readers to make informed decisions that drive profitability and achieve their business objectives within the market.
| Report Attribute | Details |
|---|---|
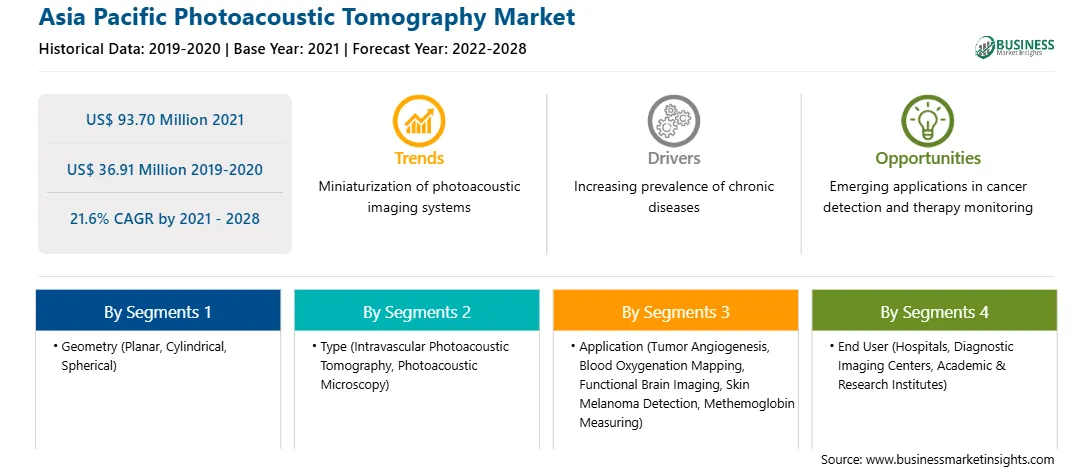
| Market size in 2021 | US$ 93.70 Million |
| Market Size by 2028 | US$ 36.91 Million |
| Global CAGR (2021 - 2028) | 21.6% |
| Historical Data | 2019-2020 |
| Forecast period | 2022-2028 |
| Segments Covered |
By Geometry
|
| Regions and Countries Covered | Asia-Pacific
|
| Market leaders and key company profiles |
The geographic scope of the Asia Pacific Photoacoustic Tomography refers to the specific areas in which a business operates and competes. Understanding local distinctions, such as diverse consumer preferences (e.g., demand for specific plug types or battery backup durations), varying economic conditions, and regulatory environments, is crucial for tailoring strategies to specific markets. Businesses can expand their reach by identifying underserved areas or adapting their offerings to meet local demands. A clear market focus allows for more effective resource allocation, targeted marketing campaigns, and better positioning against local competitors, ultimately driving growth in those targeted areas.
The APAC photoacoustic tomography market is segmented into geometry, type, application, end user, and country. Based on geometry, the photoacoustic tomography market is segmented into planar, cylindrical, and spherical. The planar segment held the largest share of the market in 2021. Based on type, the market is categorized into intravascular photoacoustic tomography, photoacoustic microscopy, and others. The intravascular photoacoustic tomography segment held the largest share of the market in 2021. Based on application, the market is segmented into tumor angiogenesis, blood oxygenation mapping, functional brain imaging, skin melanoma detection, methemoglobin measuring, and others. The tumor angiogenesis segment held the largest market share in 2021. Based on end user, the market is segmented into hospitals, diagnostics imaging centers, academic and research institutes, and others. The hospital segment held the largest market share in 2021. Based on country, the APAC photoacoustic tomography market is categorized into Australia, China, India, Japan, South Korea, and the Rest of APAC.
Advantest Corporation; Aspectus GmbH; CYBERDYNE INC.; and FUJIFILM Visualsonics Inc. are among the leading companies operating in the APAC photoacoustic tomography market.
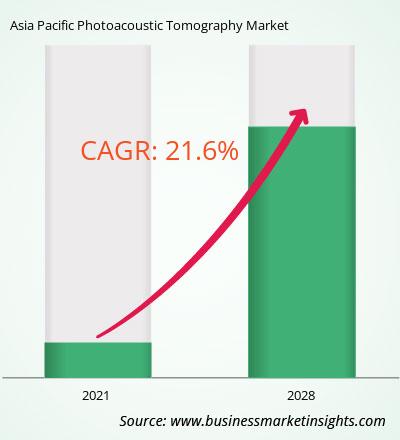
The Asia Pacific Photoacoustic Tomography Market is valued at US$ 93.70 Million in 2021, it is projected to reach US$ 36.91 Million by 2028.
As per our report Asia Pacific Photoacoustic Tomography Market, the market size is valued at US$ 93.70 Million in 2021, projecting it to reach US$ 36.91 Million by 2028. This translates to a CAGR of approximately 21.6% during the forecast period.
The Asia Pacific Photoacoustic Tomography Market report typically cover these key segments-
The historic period, base year, and forecast period can vary slightly depending on the specific market research report. However, for the Asia Pacific Photoacoustic Tomography Market report:
The Asia Pacific Photoacoustic Tomography Market is populated by several key players, each contributing to its growth and innovation. Some of the major players include:
The Asia Pacific Photoacoustic Tomography Market report is valuable for diverse stakeholders, including:
Essentially, anyone involved in or considering involvement in the Asia Pacific Photoacoustic Tomography Market value chain can benefit from the information contained in a comprehensive market report.
E 1803, Panchshil Towers, Vagholi, Haveli, Pune- 412207, Maharashtra, India
US:+16467917070
sales@businessmarketinsights.com


 Get Free Sample For Asia Pacific Photoacoustic Tomography Market
