Asia Pacific Operating Tables Market Forecast to 2028 - COVID-19 Impact and Regional Analysis By Product Type (General Surgery Tables, Specialty Surgery Tables, Radiolucent Operating Tables, and Pediatric Operating Tables), Technology (Non-Powered and Powered), and End User (Hospitals, Ambulatory Surgical Centers, and Specialty Clinics)
Market Introduction
The Asia Pacific operating tables market is a highly fragmented market with the presence of considerable regional and local players providing numerous solutions for companies investing in the market arena. The types of electric operating tables continue to increase, including five-section eccentric columns, built-in kidney bridges, C-arm carbon fiber catheter operating tables, etc., These types are convenient and safe, comprehensive functions, high control precision, and long service life. The power control source is used to operate various settings, such as table movement, table tilt, and height adjustment. It helps simplify the task of an operation without distracting the surgeon's attention. This feature can be used for electric operating tables. With the help of the remote control to assist the operation of the electric actuator, the movement of a table can be easily controlled. For example, the KME-1204 sliding top electric OT from Koinaa Medical Equipments is suitable for various surgeries, such as general surgery; cardiovascular surgery; neurology, gynecology, urology, proctology, and traumatic surgery; plastic surgery; and laparoscopy. The table is equipped with remote control for easy height adjustment; side tilt; longitudinal sliding; and trendelenburg, flexion, and reflex positioning. Also, the nonreflecting surface is antibacterial and easy to clean. Owing to the plenty of power, smooth and quiet movement, multiple value-added features, and unlimited customization options (such as customized positioning), companies continue to add value to the electric adjustment of advanced operating tables. Therefore, it is expected that during the forecast period, a significant shift toward powered surgical tables will become a trend owing to the benefits offered by powered surgical tables.
In Asia Pacific, India reported a huge number of COVID-19 cases, which led to the discontinuation of several business operations, including operating table manufacturing activities. Several measures have been implemented to contain the spread of COVID-19, resulting in significant operational disruption for many companies, including the operating table manufacturing industry. Staff quarantine, supply-chain failures, and reductions in demand have generated serious complications for companies. Also, there has been a significant drop in in-patient and outpatient for private hospital chains. To relieve healthcare systems, many clinics have been postponing non-critical surgical procedures like orthopedic and neuromuscular conditions. To avoid overburdening hospitals already struggling to deal with the rising pandemic pressure, doctors are delaying surgeries till the COVID-19 peak is past. Moreover, medical device companies are starting to forecast large sales declines in their business segments because people are staying at home. All these factors tend to affect the Asia Pacific operating tables market negatively.
Get more information on this report :
Market Overview and Dynamics
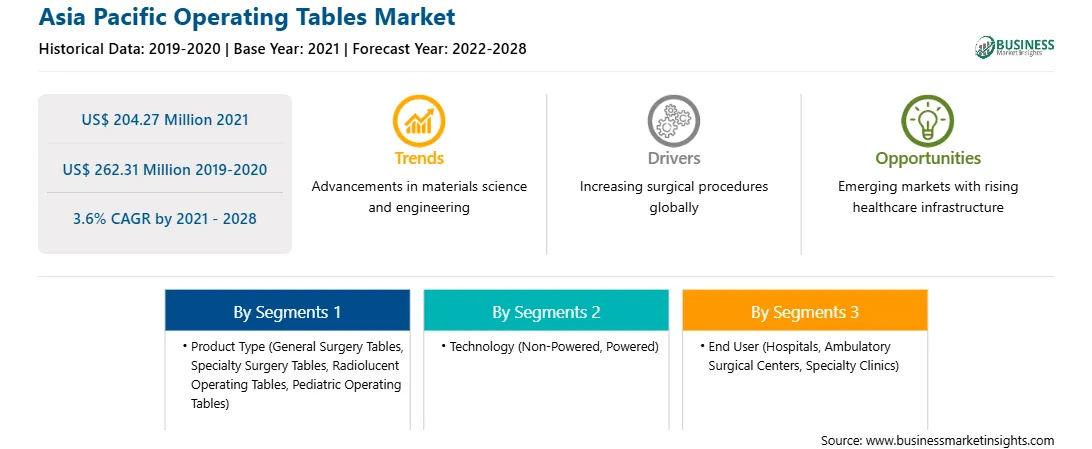
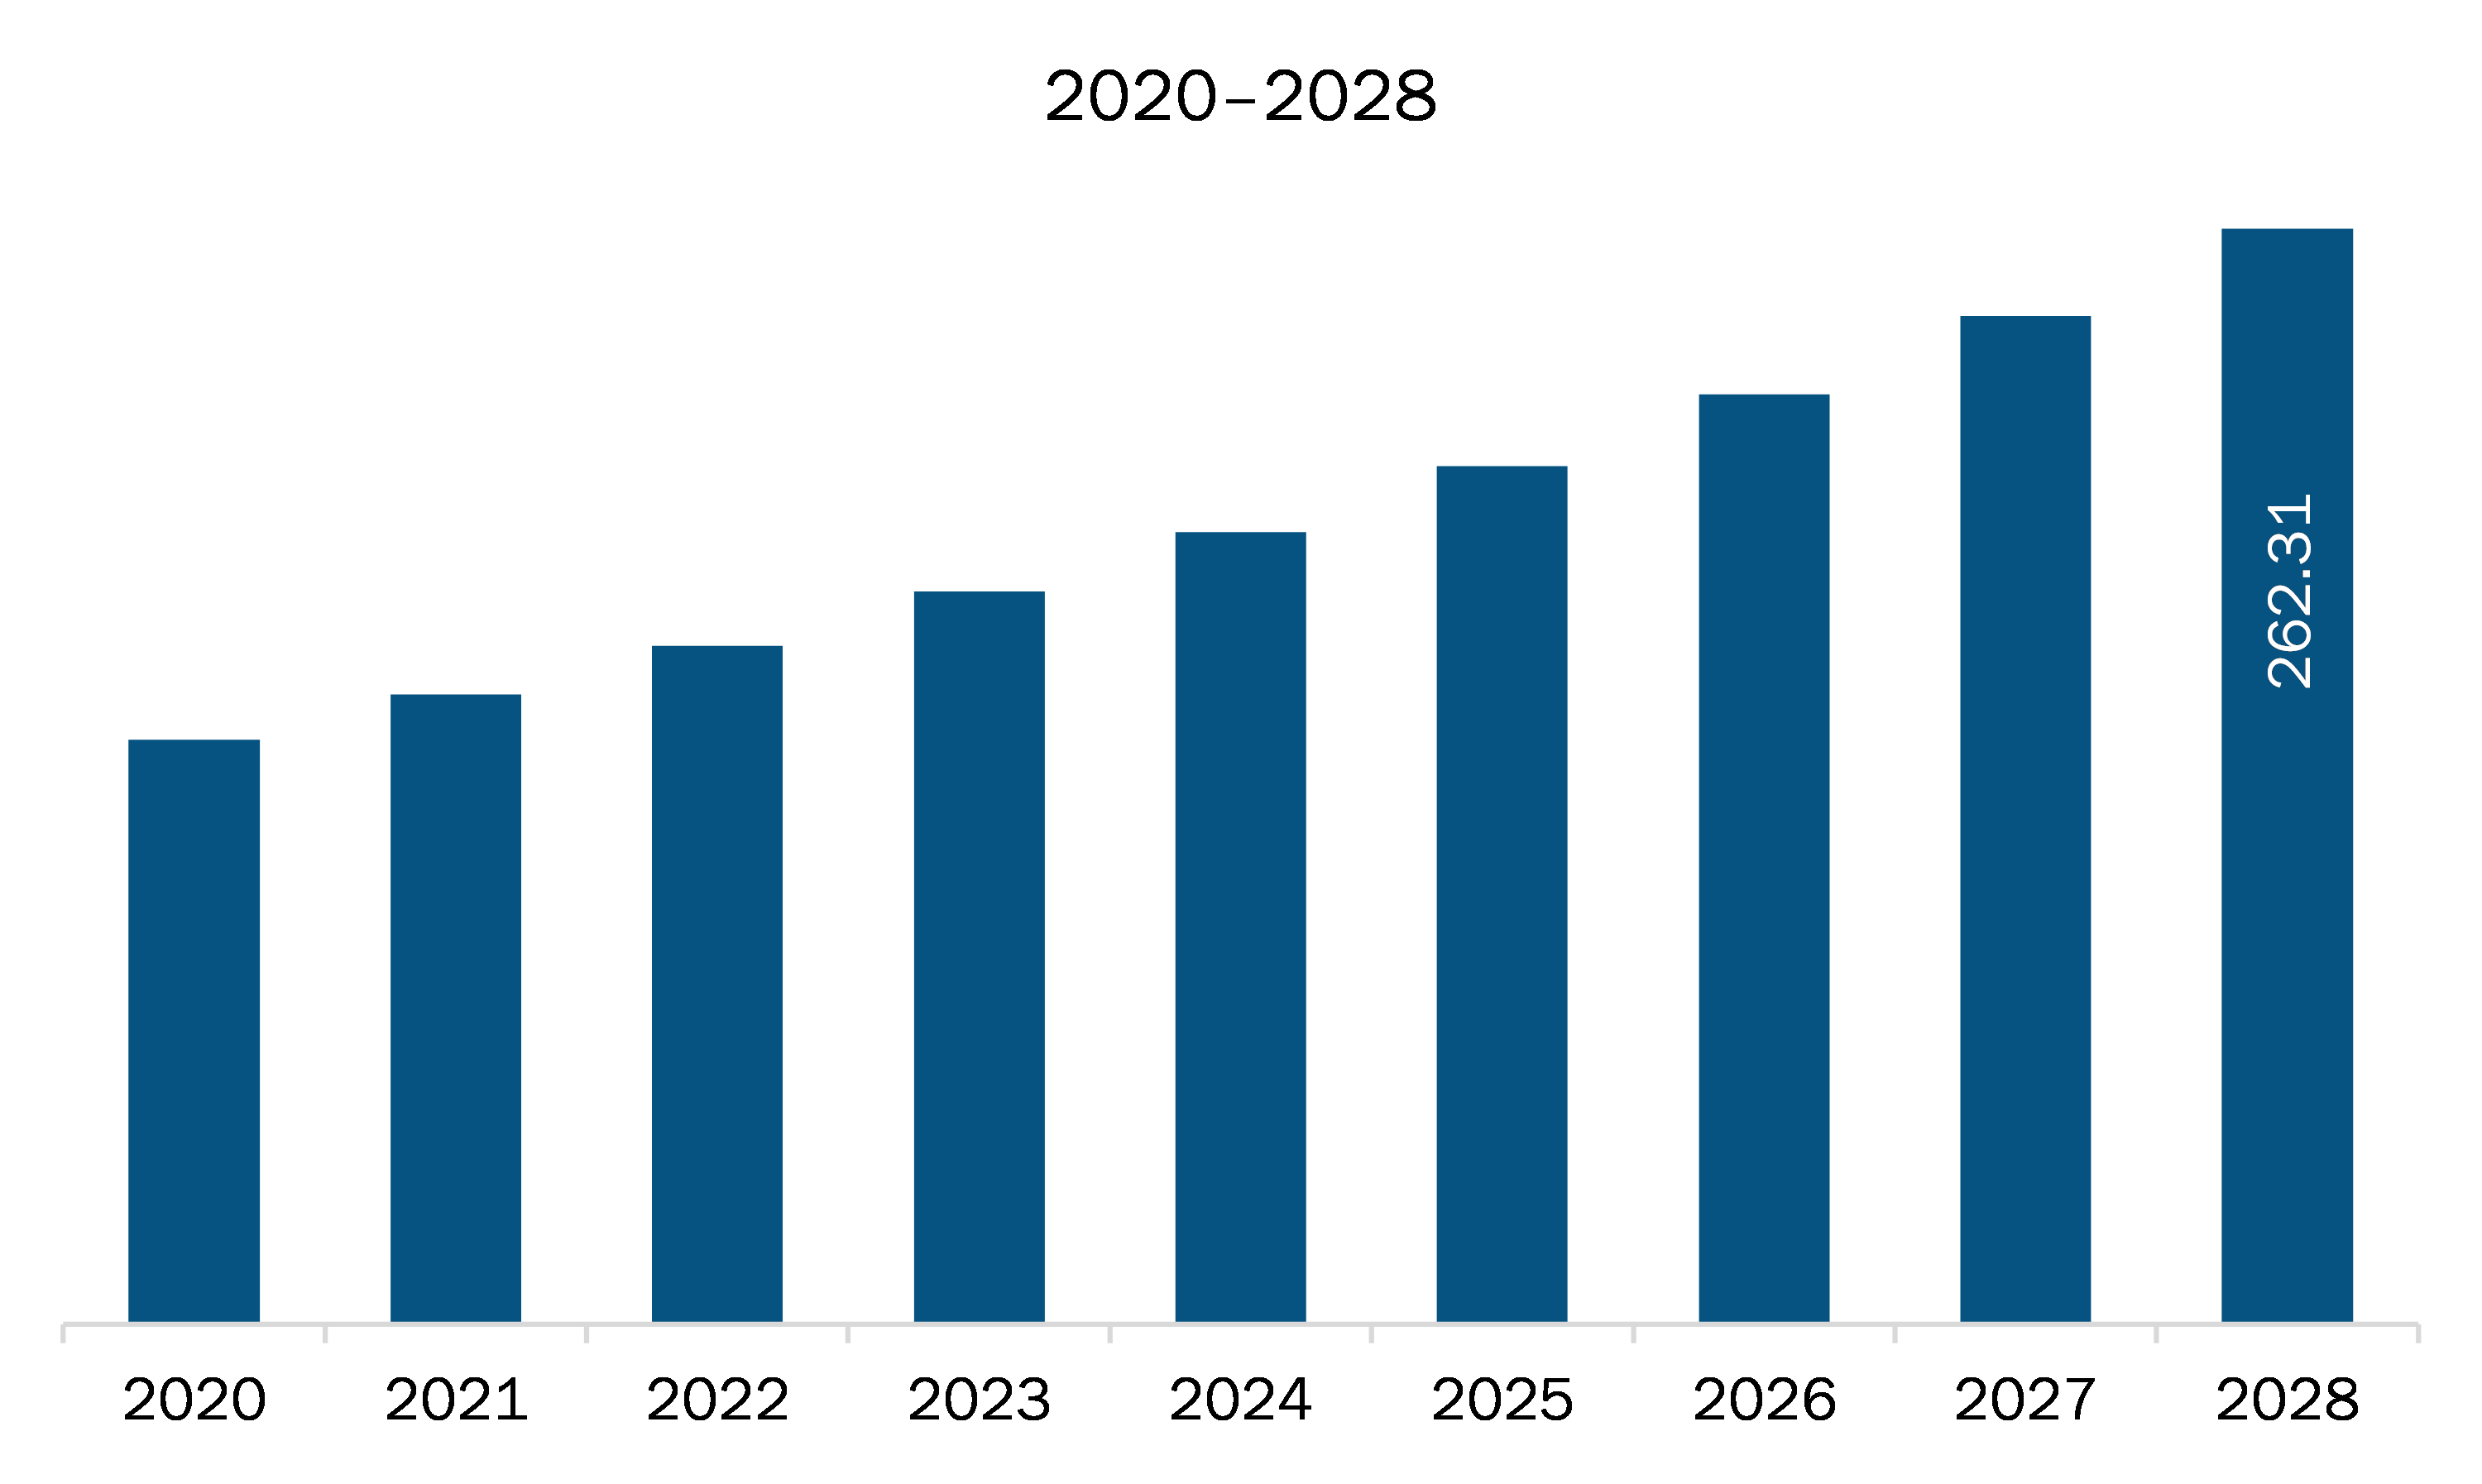
The operating tables market in Asia Pacific is expected to grow from US$ 204.27 million in 2021 to US$ 262.31 million by 2028; it is estimated to grow at a CAGR of 3.6% from 2021 to 2028. The hospital industry across the region is growing at a rapid pace. Although the average hospital stays for a single patient has been slightly decreased from 7 days to 5–6 days in the last couple of decades, the total number of hospital admissions has increased in the last 5–6 years. According to the Department of Industrial Policy and Promotion (DIPP), the hospital and diagnostic centers in India have attracted Foreign Direct Investments (FDIs) worth US$ 6 billion in the last couple of decades. According to the Ministry of Health and Family Welfare, the Government of India, India and Cuba signed a Memorandum of Understanding (MoU) to increase cooperation in the areas of health and medicine. Furthermore, a de-merger between Fortis Healthcare and Manipal Hospitals Enterprises has been carried out to raise US$ 602.41 million, which can be further invested to expand hospital infrastructure in Manipal Hospital Enterprise. The operating tables industry in India is booming owing to a few factors such as rising government and private sector investments, increasing geriatric population, and surging hospital count.
Key Market Segments
Based on product type, the general surgery tables segment accounted for the largest share of the Asia Pacific operating tables market in 2021. Based on technology, the non-powered segment accounted for the largest share of the Asia Pacific operating tables market in 2021. Based on end user, the hospitals segment accounted for the largest share of the Asia Pacific operating tables market in 2021.
Major Sources and Companies Listed
A few major primary and secondary sources referred to for preparing this report on the Asia Pacific operating tables market are company websites, annual reports, financial reports, national government documents, and statistical database, among others. Major companies listed in the report include Skytron, LLC; STERIS Plc; AGA Sanitätsartikel GmbH; ALVO; Getinge AB; Mizuho Medical Co, Ltd.; Merivaara; Stryker Corporation; Denyers International and Hill Rom Holding Inc.
Reasons to buy report
- To understand the Asia Pacific operating tables market landscape and identify market segments that are most likely to guarantee a strong return
- Stay ahead of the race by comprehending the ever-changing competitive landscape for Asia Pacific operating tables market
- Efficiently plan M&A and partnership deals in Asia Pacific operating tables market by identifying market segments with the most promising probable sales
- Helps to take knowledgeable business decisions from perceptive and comprehensive analysis of market performance of various segment form Asia Pacific operating tables market
- Obtain market revenue forecast for market by various segments from 2020-2028 in Asia Pacific region.
Asia Pacific Operating Tables Market Segmentation
Asia Pacific Operating Tables Market -By Product Type
- General Surgery Tables
- Specialty Surgery Tables
- Radiolucent Operating Tables
- Pediatric Operating Tables
Asia Pacific Operating Tables Market -By Technology
- Non-Powered
- Powered
Asia Pacific Operating Tables Market – By End User
- Hospitals
- Ambulatory Surgical Centers
- Specialty Clinics
Asia Pacific Operating Tables Market – By Country
- China
- Japan
- India
- Australia
- South Korea
- Rest of Asia Pacific
Asia Pacific Operating Tables Market – Company Profiles
- Skytron, LLC
- STERIS plc
- AGA Sanitätsartikel GmbH
- ALVO
- Getinge AB
- Mizuho Medical Co, Ltd.
- Merivaara
- Stryker Corporation
- Denyers International
- Hill Rom Holding Inc.
1. Introduction
1.1 Scope of the Study
1.2 The Insight Partners Research Report Guidance
1.3 Market Segmentation
1.3.1 Asia Pacific Operating Tables Market – By Product Type
1.3.2 Asia Pacific Operating Tables Market – By Technology
1.3.3 Asia Pacific Operating Tables Market – By End User
1.3.4 Asia Pacific Operating Tables Market – By Country
2. Asia Pacific Operating Tables Market – Key Takeaways
3. Research Methodology
3.1 Coverage
3.2 Secondary Research
3.3 Primary Research
4. Asia Pacific Operating Tables Market – Market Landscape
4.1 Overview
4.2 PEST Analysis
4.3 Experts Opinion
5. Operating Tables Market – Key Market Dynamics
5.1 Drivers
5.1.1 Heightening Number of Hospitals and Clinics
5.1.2 Rise in the Number of Surgical Procedures
5.2 Market Restraints
5.2.1 High Costs Involved with Technologically Advanced Operating Tables
5.3 Market Opportunities
5.3.1 Medical Tourism Gaining Momentum
5.4 Future Trends
5.4.1 An Upsurge in the Usage of Powered Surgical Tables
5.5 Impact Analysis
6. Operating Tables Market – Asia Pacific Analysis
6.1 Asia Pacific Operating Tables Market Revenue Forecast and Analysis
7. Asia Pacific Operating Tables Market Analysis – By Product Type
7.1 Overview
7.2 Operating Tables Market Revenue Share, By Product Type (2021 and 2028)
7.3 General Surgery Tables
7.3.1 Overview
7.3.2 General Surgery Tables: Operating Tables Market – Revenue and Forecast to 2028 (US$ Million)
7.4 Specialty Surgery Tables
7.4.1 Overview
7.4.2 Specialty Surgery Tables: Operating Tables Market – Revenue and Forecast to 2028 (US$ Million)
7.4.3 Orthopedic Surgery Tables
7.4.3.1 Overview
7.4.3.2 Orthopedic Surgery Tables: Operating Tables Market – Revenue and Forecast to 2028 (US$ Million)
7.4.4 Neurosurgical Operating Tables
7.4.4.1 Overview
7.4.4.2 Neurosurgical Operating Tables: Operating Tables Market – Revenue and Forecast to 2028 (US$ Million)
7.4.5 Laparoscopic Operating Tables
7.4.5.1 Overview
7.4.5.2 Laparoscopic Operating Tables: Operating Tables Market – Revenue and Forecast to 2028 (US$ Million)
7.4.6 Bariatric Surgery
7.4.6.1 Overview
7.4.6.2 Bariatric Surgery: Operating Tables Market – Revenue and Forecast to 2028 (US$ Million)
7.5 Radiolucent Operating Tables
7.5.1 Overview
7.5.2 Radiolucent Operating Tables: Operating Tables Market – Revenue and Forecast to 2028 (US$ Million)
7.6 Pediatric Operating Tables
7.6.1 Overview
7.6.2 Pediatric Operating Tables: Operating Tables Market – Revenue and Forecast to 2028 (US$ Million)
8. Asia Pacific Operating Tables Market Analysis – By Technology
8.1 Overview
8.2 Operating Tables Market Revenue Share, By Technology (2021 and 2028)
8.3 Non-Powered
8.3.1 Overview
8.3.2 Non-Powered: Operating Tables Market – Revenue and Forecast to 2028 (US$ Million)
8.4 Powered
8.4.1 Overview
8.4.2 Powered: Operating Tables Market – Revenue and Forecast to 2028 (US$ Million)
9. Asia Pacific Operating Tables Market Analysis – By End User
9.1 Overview
9.2 Operating Tables Market Revenue Share, By End User (2021 and 2028)
9.3 Hospitals
9.3.1 Overview
9.3.2 Hospitals: Operating Tables Market – Revenue and Forecast to 2028 (US$ Million)
9.4 Ambulatory Surgical Centers
9.4.1 Overview
9.4.2 Ambulatory Surgical Centers: Operating Tables Market – Revenue and Forecast to 2028 (US$ Million)
9.5 Specialty Clinics
9.5.1 Overview
9.5.2 Specialty Clinics: Operating Tables Market – Revenue and Forecast to 2028 (US$ Million)
10. Asia Pacific Operating Tables Market – Country Analysis
10.1 Asia Pacific: Operating Tables Market
10.1.1 Overview
10.1.2 Asia Pacific: Operating Tables Market, by Country, 2021 & 2028 (%)
10.1.3 China: Operating Tables Market – Revenue and Forecast to 2028 (USD Million)
10.1.3.1 China: Operating Tables Market – Revenue and Forecast to 2028 (USD Million)
10.1.3.2 China: Operating Tables Market, by Product Type, 2019–2028 (USD Million)
10.1.3.2.1 China: Operating Tables Market, by Specialty Surgery Tables, 2019–2028 (USD Million)
10.1.3.3 China: Operating Tables Market, by Technology, 2019–2028 (USD Million)
10.1.3.4 China: Operating Tables Market, by End Use, 2019–2028 (USD Million)
10.1.4 Japan: Operating Tables Market – Revenue and Forecast to 2028 (USD Million)
10.1.4.1 Japan: Operating Tables Market – Revenue and Forecast to 2028 (USD Million)
10.1.4.2 Japan: Operating Tables Market, by Product Type, 2019–2028 (USD Million)
10.1.4.2.1 Japan: Operating Tables Market, by Specialty Surgery Tables, 2019–2028 (USD Million)
10.1.4.3 Japan: Operating Tables Market, by Technology, 2019–2028 (USD Million)
10.1.4.4 Japan: Operating Tables Market, by End Use, 2019–2028 (USD Million)
10.1.5 India: Operating Tables Market – Revenue and Forecast to 2028 (USD Million)
10.1.5.1 India: Operating Tables Market – Revenue and Forecast to 2028 (USD Million)
10.1.5.2 India: Operating Tables Market, by Product Type, 2019–2028 (USD Million)
10.1.5.2.1 India: Operating Tables Market, by Specialty Surgery Tables, 2019–2028 (USD Million)
10.1.5.3 India: Operating Tables Market, by Technology, 2019–2028 (USD Million)
10.1.5.4 India: Operating Tables Market, by End Use, 2019–2028 (USD Million)
10.1.6 Australia: Operating Tables Market – Revenue and Forecast to 2028 (USD Million)
10.1.6.1 Australia: Operating Tables Market – Revenue and Forecast to 2028 (USD Million)
10.1.6.2 Australia: Operating Tables Market, by Product Type, 2019–2028 (USD Million)
10.1.6.2.1 Australia: Operating Tables Market, by Specialty Surgery Tables, 2019–2028 (USD Million)
10.1.6.3 Australia: Operating Tables Market, by Technology, 2019–2028 (USD Million)
10.1.6.4 Australia: Operating Tables Market, by End Use, 2019–2028 (USD Million)
10.1.7 South Korea: Operating Tables Market – Revenue and Forecast to 2028 (USD Million)
10.1.7.1 South Korea: Operating Tables Market – Revenue and Forecast to 2028 (USD Million)
10.1.7.2 South Korea: Operating Tables Market, by Product, 2019–2028 (USD Million)
10.1.7.2.1 South Korea: Operating Tables Market, by Specialty Surgery Tables, 2019–2028 (USD Million)
10.1.7.3 South Korea: Operating Tables Market, by Technology, 2019–2028 (USD Million)
10.1.7.4 South Korea: Operating Tables Market, by End Use, 2019–2028 (USD Million)
10.1.8 Rest of Asia Pacific: Operating Tables Market – Revenue and Forecast to 2028 (USD Million)
10.1.8.1 Rest of Asia Pacific: Operating Tables Market – Revenue and Forecast to 2028 (USD Million)
10.1.8.2 Rest of Asia Pacific: Operating Tables Market, by Product Type, 2019–2028 (USD Million)
10.1.8.2.1 Rest of Asia Pacific: Operating Tables Market, by Specialty Surgery Tables, 2019–2028 (USD Million)
10.1.8.3 Rest of Asia Pacific: Operating Tables Market, by Technology, 2019–2028 (USD Million)
10.1.8.4 Rest of Asia Pacific: Operating Tables Market, by End Use, 2019–2028 (USD Million)
11. Impact Of COVID-19 Pandemic on Asia Pacific Operating Tables Market
11.1 Asia Pacific: Impact Assessment of COVID-19 Pandemic
12. Asia Pacific Operating Tables Market–Industry Landscape
12.1 Overview
12.2 Growth Strategies in the Operating Tables Market (%)
12.3 Organic Developments
12.3.1 Overview
12.4 Inorganic Developments
12.4.1 Overview
13. Company Profiles
13.1 SKYTRON, LLC
13.1.1 Key Facts
13.1.2 Business Description
13.1.3 Products and Services
13.1.4 Financial Overview
13.1.5 SWOT Analysis
13.1.6 Key Developments
13.2 STERIS plc.
13.2.1 Key Facts
13.2.2 Business Description
13.2.3 Products and Services
13.2.4 Financial Overview
13.2.5 SWOT Analysis
13.2.6 Key Developments
13.3 AGA Sanitätsartikel GmbH
13.3.1 Key Facts
13.3.2 Business Description
13.3.3 Products and Services
13.3.4 Financial Overview
13.3.5 SWOT Analysis
13.3.6 Key Developments
13.4 ALVO
13.4.1 Key Facts
13.4.2 Business Description
13.4.3 Products and Services
13.4.4 Financial Overview
13.4.5 SWOT Analysis
13.4.6 Key Developments
13.5 Denyers International
13.5.1 Key Facts
13.5.2 Business Description
13.5.3 Products and Services
13.5.4 Financial Overview
13.5.5 SWOT Analysis
13.5.6 Key Developments
13.6 Getinge AB
13.6.1 Key Facts
13.6.2 Business Description
13.6.3 Products and Services
13.6.4 Financial Overview
13.6.5 SWOT Analysis
13.6.6 Key Developments
13.7 Mizuho Medical Co, Ltd.
13.7.1 Key Facts
13.7.2 Business Description
13.7.3 Products and Services
13.7.4 Financial Overview
13.7.5 SWOT Analysis
13.7.6 Key Developments
13.8 Merivaara
13.8.1 Key Facts
13.8.2 Business Description
13.8.3 Products and Services
13.8.4 Financial Overview
13.8.5 SWOT Analysis
13.8.6 Key Developments
13.9 Stryker Corporation
13.9.1 Key Facts
13.9.2 Business Description
13.9.3 Products and Services
13.9.4 Financial Overview
13.9.5 SWOT Analysis
13.9.6 Key Developments
13.10 Hill Rom Holding Inc.
13.10.1 Key Facts
13.10.2 Business Description
13.10.3 Products and Services
13.10.4 Financial Overview
13.10.5 SWOT Analysis
13.10.6 Key Developments
14. Appendix
14.1 About The Insight Partners
14.2 Glossary of TermsLIST OF TABLES
Table 1. Asia Pacific: Operating Tables Market Market–Revenue and Forecast to 2028 (US$ Million)
Table 2. China: Operating Tables Market, by Product Type– Revenue and Forecast to 2028 (USD Million)
Table 3. China: Operating Tables Market, by Specialty Surgery Tables – Revenue and Forecast to 2028 (USD Million)
Table 4. China: Operating Tables Market, by Technology – Revenue and Forecast to 2028 (USD Million)
Table 5. China: Operating Tables Market, by End Use– Revenue and Forecast to 2028 (USD Million)
Table 6. Japan: Operating Tables Market, by Product Type– Revenue and Forecast to 2028 (USD Million)
Table 7. Japan: Operating Tables Market, by Specialty Surgery Tables – Revenue and Forecast to 2028 (USD Million)
Table 8. Japan: Operating Tables Market, by Technology – Revenue and Forecast to 2028 (USD Million)
Table 9. Japan: Operating Tables Market, by End Use – Revenue and Forecast to 2028 (USD Million)
Table 10. India: Operating Tables Market, by Product Type– Revenue and Forecast to 2028 (USD Million)
Table 11. India: Operating Tables Market, by Specialty Surgery Tables – Revenue and Forecast to 2028 (USD Million)
Table 12. India: Operating Tables Market, by Technology – Revenue and Forecast to 2028 (USD Million)
Table 13. India: Operating Tables Market, by End Use– Revenue and Forecast to 2028 (USD Million)
Table 14. Australia: Operating Tables Market, by Product Type– Revenue and Forecast to 2028 (USD Million)
Table 15. Australia: Operating Tables Market, by Specialty Surgery Tables – Revenue and Forecast to 2028 (USD Million)
Table 16. Australia: Operating Tables Market, by Technology – Revenue and Forecast to 2028 (USD Million)
Table 17. Australia: Operating Tables Market, by End Use– Revenue and Forecast to 2028 (USD Million)
Table 18. South Korea: Operating Tables Market, by Product – Revenue and Forecast to 2028 (USD Million)
Table 19. South Korea: Operating Tables Market, by Specialty Surgery Tables – Revenue and Forecast to 2028 (USD Million)
Table 20. South Korea: Operating Tables Market, by Technology – Revenue and Forecast to 2028 (USD Million)
Table 21. South Korea: Operating Tables Market, by End Use– Revenue and Forecast to 2028 (USD Million)
Table 22. Rest of Asia Pacific: Operating Tables Market, by Product Type – Revenue and Forecast to 2028 (USD Million)
Table 23. Rest of Asia Pacific: Operating Tables Market, by Specialty Surgery Tables – Revenue and Forecast to 2028 (USD Million)
Table 24. Rest of Asia Pacific: Operating Tables Market, by Technology – Revenue and Forecast to 2028 (USD Million)
Table 25. Rest of Asia Pacific: Operating Tables Market, by End Use– Revenue and Forecast to 2028 (USD Million)
Table 26. Organic Developments in the Operating Tables Market
Table 27. Inorganic Developments in the Operating Tables Market
Table 28. Glossary of Terms, Operating Tables MarketLIST OF FIGURES
Figure 1. Operating Tables Market Segmentation
Figure 2. Operating Tables Market Segmentation, By Country
Figure 3. Asia Pacific Operating Tables Market Overview
Figure 4. General Surgery Tables Segment Held the Largest Share of the Product Type Segment in Operating Tables Market
Figure 5. India to Show Significant Growth During Forecast Period
Figure 6. Asia Pacific Operating Tables Market, Industry Landscape
Figure 7. Asia Pacific PEST Analysis
Figure 8. Impact Analysis
Figure 9. Asia Pacific Operating Tables Market – Revenue Forecast and Analysis – 2020- 2028
Figure 10. Operating Tables Market Revenue Share, By Product Type (2021 and 2028)
Figure 11. General Surgery Tables: Operating Tables Market – Revenue and Forecast to 2028 (US$ Million)
Figure 12. Specialty Surgery Tables: Operating Tables Market – Revenue and Forecast to 2028 (US$ Million)
Figure 13. Orthopedic Surgery Tables: Operating Tables Market – Revenue and Forecast to 2028 (US$ Million)
Figure 14. Neurosurgical Operating Tables: Operating Tables Market – Revenue and Forecast to 2028 (US$ Million)
Figure 15. Laparoscopic Operating Tables: Operating Tables Market – Revenue and Forecast to 2028 (US$ Million)
Figure 16. Bariatric Surgery: Operating Tables Market – Revenue and Forecast to 2028 (US$ Million)
Figure 17. Radiolucent Operating Tables: Operating Tables Market – Revenue and Forecast to 2028 (US$ Million)
Figure 18. Pediatric Operating Tables: Operating Tables Market – Revenue and Forecast to 2028 (US$ Million)
Figure 19. Operating Tables Market Revenue Share, By Technology (2021 and 2028)
Figure 20. Non-Powered: Operating Tables Market – Revenue and Forecast to 2028 (US$ Million)
Figure 21. Powered: Operating Tables Market – Revenue and Forecast to 2028 (US$ Million)
Figure 22. Operating Tables Market Revenue Share, By End User (2021 and 2028)
Figure 23. Hospitals: Operating Tables Market – Revenue and Forecast to 2028 (US$ Million)
Figure 24. Ambulatory Surgical Centers: Operating Tables Market – Revenue and Forecast to 2028 (US$ Million)
Figure 25. Specialty Clinics: Operating Tables Market – Revenue and Forecast to 2028 (US$ Million)
Figure 26. Asia Pacific: Operating Tables Market, by Key Country – Revenue (2021) (USD Million)
Figure 27. Asia Pacific: Operating Tables Market, by Country, 2021 & 2028 (%)
Figure 28. China: Operating Tables Market – Revenue and Forecast to 2028 (USD Million)
Figure 29. Japan: Operating Tables Market – Revenue and Forecast to 2028 (USD Million)
Figure 30. India: Operating Tables Market – Revenue and Forecast to 2028 (USD Million)
Figure 31. Australia: Operating Tables Market – Revenue and Forecast to 2028 (USD Million)
Figure 32. South Korea: Operating Tables Market – Revenue and Forecast to 2028 (USD Million)
Figure 33. Rest of Asia Pacific: Operating Tables Market – Revenue and Forecast to 2028 (USD Million)
Figure 34. Impact of COVID-19 Pandemic in European Country Markets
Figure 35. Growth Strategies in the Operating Tables Market (%)- Skytron, LLC
- STERIS plc
- AGA Sanitätsartikel GmbH
- ALVO
- Getinge AB
- Denyers International
- Mizuho Medical Co, Ltd.
- Merivaara
- Stryker Corporation
- Hill Rom Holding Inc.