Asia Pacific Oilfield Service Market Forecast to 2028 – COVID-19 Impact and Analysis – by Application (Onshore and Offshore) and Service Type (Well Completion, Wire line, Artificial Lift, Perforation, Drilling and Completion Fluids, and Others) 

BMIRE00025118 | Pages: 121 | Energy and Power | Jun 2022 | Type: Regional | Status: Published

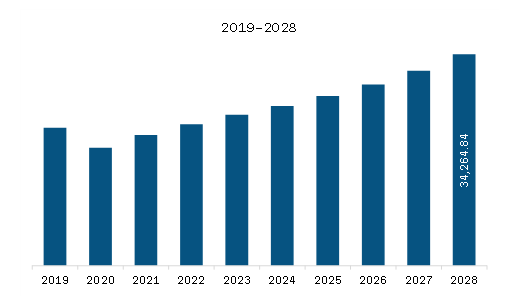
The oilfield service market in Asia Pacific is expected to grow from US$ 21,195.08 million in 2021 to US$ 34,264.84 million by 2028. It is estimated to grow at a CAGR of 7.1% from 2021 to 2028.


The trapped shale gases cannot easily flow into the well due to the limited permeability of shale rocks. Oil and gas firms use hydraulic fracturing and other stimulation operations to improve the permeability of shale formations and generate trapped shale gases. Shale gas emits less carbon than coal, which makes it a greener energy option among many economies that rely on coal as an energy source.


Shale gas production has resulted in a new abundance of natural gas supply. Due to advancements in extraction technology, it is likely to take up the anticipated future. China has the most shale reserves, with a sizable portion of its output coming from the Sichuan Basin near Chongqing.


According to China National Energy Administration, with new drilling instruments and shale gas exploration techniques, the country intends to increase output to 30 billion cubic meters by 2020 and 80–100 billion cubic meters per year by 2030. Therefore, the continuous growth of shale basins in key nations, such as China, is bolstering the growth of the APAC oilfield services market.


Asia Pacific Oilfield Service Market Revenue and Forecast to 2028 (US$ Million)

Asia Pacific Oilfield Service Market Revenue and Forecast to 2028 (US$ Million)

Get more information on this report :


Asia-Pacific Oilfield Service Market Segmentation           


The Asia Pacific oilfield service market is analyzed on the basis of application, service type, and country. Based on application, the market is bifurcated into onshore and offshore. In 2020, the onshore segment held the largest share in the market.


Based on service type, the market is segmented into well completion, wireline, artificial lift, perforation, drilling and completion fluids, and others. In 2020, the others segment held the largest share in the market.


Similarly, based on country, the market is segmented into China, Japan, India, South Korea, Australia, and the Rest of Asia Pacific. China contributed a substantial share in 2020. 


Archer; Baker Hughes Company; Halliburton Energy Services, Inc; NOV Inc; Schlumberger Limited; Weatherford International plc; and Wireline Services Group are the leading companies in the Asia Pacific oilfield service market.

1.           Introduction

1.1         Study Scope

1.2         The Insight Partners Research Report Guidance

1.3         Market Segmentation

2.           Key Takeaways

3.        Research Methodology

3.1         Coverage

3.2         Secondary Research

3.3         Primary Research

4.           APAC Oilfield Service Market Landscape

4.1         Market Overview

4.2         PEST Analysis

4.2.1        APAC

4.3         Ecosystem Analysis

4.4         Expert Opinions

5.           APAC Oilfield Service Market – Key Market Dynamics

5.1         Market Drivers

5.1.1        Rising Oil and Gas Production and Exploration (E&P) Activities

5.1.2        Rising Shale Gas Extraction

5.2         Market Restraints

5.2.1        Volatility in Crude Oil Prices

5.3         Market Opportunities

5.3.1        Increasing Demand of Offshore/Deep-Water Discoveries

5.4         Future Trends

5.4.1        Technological Innovation in Oilfield Service

5.5         Impact Analysis of Drivers And Restraints

6.           Oilfield Service – APAC Market Analysis

6.1         APAC Oilfield Service Market

6.2         APAC Oilfield Service Market Revenue Forecast and Analysis

7.           APAC Oilfield service Market – By Application

7.1         Overview

7.2         APAC Oilfield service Market, By Application (2020 and 2028)

7.3         Onshore

7.3.1        Overview

7.3.2        Onshore: APAC Oilfield Service Market – Revenue and Forecast to 2028 (US$ Million)

7.4         Offshore

7.4.1        Overview

7.4.2        Offshore: APAC Oilfield Service Market – Revenue and Forecast to 2028 (US$ Million)

8.           APAC Oilfield service Market – By Service type

8.1         Overview

8.2         APAC Oilfield service Market, By Service type (2020 and 2028)

8.3         Well Completion

8.3.1        Overview

8.3.2        Well completion: APAC Oilfield Service Market – Revenue and Forecast to 2028 (US$ Million)

8.4         Wire line

8.4.1        Overview

8.4.2        Wire line: APAC Oilfield Service Market – Revenue and Forecast to 2028 (US$ Million)

8.5         Artificial lift

8.5.1        Overview

8.5.2        Artificial lift: APAC Oilfield Service Market – Revenue and Forecast to 2028 (US$ Million)

8.6         Perforation

8.6.1        Overview

8.6.2        Perforation: APAC Oilfield Service Market – Revenue and Forecast to 2028 (US$ Million)

8.7         Drilling and Completion Fluids

8.7.1        Overview

8.7.2        Drilling and Completion Fluids: APAC Oilfield Service Market – Revenue and Forecast to 2028 (US$ Million)

8.8         Others

8.8.1        Overview

8.8.2        Others: APAC Oilfield Service Market – Revenue and Forecast to 2028 (US$ Million)

9.           APAC Oilfield service Market – Country Analysis

9.1         Overview

9.1.1        APAC: Oilfield Service Market, by Key Country

9.1.1.1          China: Oilfield Service Market – Revenue and Forecast to 2028 (US$ Million)

9.1.1.1.1          China: Oilfield Service Market, By Application

9.1.1.1.2          China: Oilfield Service Market, by Service type

9.1.1.2          Japan: Oilfield Service Market – Revenue and Forecast to 2028 (US$ Million)

9.1.1.2.1          Japan: Oilfield Service Market, By Application

9.1.1.2.2          Japan: Oilfield Service Market, by Service type

9.1.1.3          India: Oilfield Service Market – Revenue and Forecast to 2028 (US$ Million)

9.1.1.3.1          India: Oilfield Service Market, By Application

9.1.1.3.2          India: Oilfield Service Market, by Service type

9.1.1.4          South Korea: Oilfield Service Market – Revenue and Forecast to 2028 (US$ Million)

9.1.1.4.1          South Korea: Oilfield Service Market, By Application

9.1.1.4.2          South Korea: Oilfield Service Market, by Service type

9.1.1.5          Australia: Oilfield Service Market – Revenue and Forecast to 2028 (US$ Million)

9.1.1.5.1          Australia: Oilfield Service Market, By Application

9.1.1.5.2          Australia: Oilfield Service Market, by Service type

9.1.1.6          Rest of APAC: Oilfield Service Market – Revenue and Forecast to 2028 (US$ Million)

9.1.1.6.1          Rest of APAC: Oilfield Service Market, By Application

9.1.1.6.2          Rest of APAC: Oilfield Service Market, by Service type

10.        Industry Landscape

10.1      Overview

10.2      Market Initiative

10.3      Merger and Acquisition

10.4      New Development

11.        Company Profiles

11.1      Archer

11.1.1     Key Facts

11.1.2     Business Description

11.1.3     Products and Services

11.1.4     Financial Overview

11.1.5     SWOT Analysis

11.1.6     Key Developments

11.2      Baker Hughes Company

11.2.1     Key Facts

11.2.2     Business Description

11.2.3     Products and Services

11.2.4     Financial Overview

11.2.5     SWOT Analysis

11.2.6     Key Developments

11.3      Halliburton Energy Services, Inc.

11.3.1     Key Facts

11.3.2     Business Description

11.3.3     Products and Services

11.3.4     Financial Overview

11.3.5     SWOT Analysis

11.3.6     Key Developments

11.4      NOV Inc.

11.4.1     Key Facts

11.4.2     Business Description

11.4.3     Products and Services

11.4.4     Financial Overview

11.4.5     SWOT Analysis

11.4.6     Key Developments

11.5      Schlumberger Limited

11.5.1     Key Facts

11.5.2     Business Description

11.5.3     Products and Services

11.5.4     Financial Overview

11.5.5     SWOT Analysis

11.5.6     Key Developments

11.6      Weatherford International plc

11.6.1     Key Facts

11.6.2     Business Description

11.6.3     Products and Services

11.6.4     Financial Overview

11.6.5     SWOT Analysis

11.6.6     Key Developments

11.7      Wireline Services Group

11.7.1     Key Facts

11.7.2     Business Description

11.7.3     Products and Services

11.7.4     Financial Overview

11.7.5     SWOT Analysis

11.7.6     Key Developments

12.        Appendix

12.1      About The Insight Partners

12.2      Word Index


LIST OF TABLES

Table 1.             APAC Oilfield Service Market Revenue and Forecast to 2028 (US$ Million)

Table 2.             APAC: Oilfield Service Market, by Country – Revenue and Forecast to 2028 (US$ Million)

Table 3.             China: Oilfield Service Market, By Application – Revenue and Forecast to 2028 (US$ Million)

Table 4.             China: Oilfield Service Market, by Service type – Revenue and Forecast to 2028 (US$ Million)

Table 5.             Japan: Oilfield Service Market, By Application – Revenue and Forecast to 2028 (US$ Million)

Table 6.             Japan: Oilfield Service Market, by Service type – Revenue and Forecast to 2028 (US$ Million)

Table 7.             India: Oilfield Service Market, By Application – Revenue and Forecast to 2028 (US$ Million)

Table 8.             India: Oilfield Service Market, by Service type – Revenue and Forecast to 2028 (US$ Million)

Table 9.             South Korea: Oilfield Service Market, By Application – Revenue and Forecast to 2028 (US$ Million)

Table 10.          South Korea: Oilfield Service Market, by Service type – Revenue and Forecast to 2028 (US$ Million)

Table 11.          Australia: Oilfield Service Market, By Application – Revenue and Forecast to 2028 (US$ Million)

Table 12.          Australia: Oilfield Service Market, by Service type – Revenue and Forecast to 2028 (US$ Million)

Table 13.          Rest of APAC: Oilfield Service Market, By Application – Revenue and Forecast to 2028 (US$ Million)

Table 14.          Rest of APAC: Oilfield Service Market, by Service type – Revenue and Forecast to 2028 (US$ Million)

Table 15.          List of Abbreviation


LIST OF FIGURES

Figure 1.           APAC Oilfield Service Market Segmentation

Figure 2.           APAC Oilfield Service Market Segmentation – By Country

Figure 3.           APAC Oilfield Service Market Overview

Figure 4.           APAC Oilfield Service Market, By Application

Figure 5.           APAC Oilfield Service Market, By Service type

Figure 6.           APAC Oilfield Service Market, By Country

Figure 7.           APAC – PEST Analysis

Figure 8.           APAC Oilfield Service Market- Ecosystem Analysis

Figure 9.           APAC Oilfield Service Market Impact Analysis of Drivers and Restraints

Figure 10.        APAC Oilfield Service Market Revenue Forecast and Analysis (US$ Million)

Figure 11.        APAC Oilfield Service Market Revenue Share, by Application (2020 and 2028)

Figure 12.        Onshore: APAC Oilfield Service Market – Revenue and Forecast to 2028 (US$ Million)

Figure 13.        Offshore: APAC Oilfield Service Market – Revenue and Forecast to 2028 (US$ Million)

Figure 14.        APAC Oilfield Service Market Revenue Share, by Service type (2020 and 2028)

Figure 15.        Well completion: APAC Oilfield Service Market – Revenue and Forecast to 2028 (US$ Million)

Figure 16.        Wire line: APAC Oilfield Service Market – Revenue and Forecast to 2028 (US$ Million)

Figure 17.        Artificial lift: APAC Oilfield Service Market – Revenue and Forecast to 2028 (US$ Million)

Figure 18.        Perforation: APAC Oilfield Service Market – Revenue and Forecast to 2028 (US$ Million)

Figure 19.        Drilling and Completion Fluids: APAC Oilfield Service Market – Revenue and Forecast to 2028 (US$ Million)

Figure 20.        Others: APAC Oilfield Service Market – Revenue and Forecast to 2028 (US$ Million)

Figure 21.        APAC: Oilfield Service Market, by key Country– Revenue (2020) (US$ Million)

Figure 22.        APAC: Oilfield Service Market Revenue Share, by Key Country (2020 and 2028)

Figure 23.        China: Oilfield Service Market – Revenue and Forecast to 2028 (US$ Million)

Figure 24.        Japan: Oilfield Service Market – Revenue and Forecast to 2028 (US$ Million)

Figure 25.        India: Oilfield Service Market – Revenue and Forecast to 2028 (US$ Million)

Figure 26.        South Korea: Oilfield Service Market – Revenue and Forecast to 2028 (US$ Million)

Figure 27.        Australia: Oilfield Service Market – Revenue and Forecast to 2028 (US$ Million)

Figure 28.        Rest of APAC: Oilfield Service Market – Revenue and Forecast to 2028 (US$ Million)

  1. Archer
  2. Baker Hughes Company
  3. Halliburton Energy Services, Inc
  4. NOV Inc
  5. Schlumberger Limited
  6. Weatherford International plc
  7. Wireline Services Group
  • Save and reduce time carrying out entry-level research by identifying the growth, size, leading players and segments in the Asia-Pacific Oilfield Service Market.
  • Highlights key business priorities in order to assist companies to realign their business strategies
  • The key findings and recommendations highlight crucial progressive industry trends in the Asia-Pacific Oilfield Service Market, thereby allowing players across the value chain to develop effective long-term strategies
  • Develop/modify business expansion plans by using substantial growth offering developed and emerging markets
  • Scrutinize in-depth Asia-Pacific market trends and outlook coupled with the factors driving Oilfield Service Market, as well as those hindering it
  • Enhance the decision-making process by understanding the strategies that underpin commercial interest with respect to client products, segmentation, pricing and distribution
Report Code
Full Name
Country Name
Email Id
Phone Number
Job Title
Company
Requirement

Note : Your data will never be shared with third parties, however, we may send you information from time to time about our products that may be of interest to you. By submitting your details, you agree to be contacted by us. You may contact us at any time to opt-out.


Purchase Options
Single User License
$3000
$2400
Site License
$4000
$3200
Enterprise License
$5000
$4000