Asia Pacific Nutritional Bars Market Forecast to 2028 - COVID-19 Impact and Regional Analysis by Type (Protein Bars, High-Fiber Bars, and Others), Category (Conventional, Gluten-Free), Distribution Channel (Supermarkets & Hypermarkets, Convenience Stores, Online Retail, and Others)
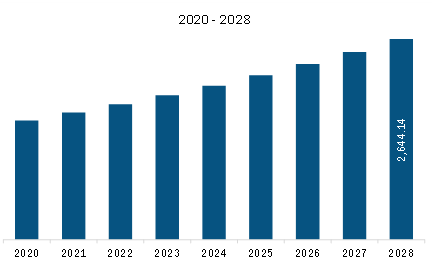
The Asia Pacific nutritional bars market is expected to grow from US$ 1,785.07 million in 2022 to US$ 2,644.14 million by 2028. It is estimated to grow at a CAGR of 6.8% from 2022 to 2028.
Rising Fitness Trends will be Driving the Asia Pacific Nutritional Bars Market
In the last couple of years, people have become more aware of the importance of living a healthy lifestyle. The growing prevalence of sedentary lifestyles among a vast population is affecting their physical and mental health. This factor encourages them to opt for physical activities and workouts, and healthy eating to stay fit. Thus, fitness and healthy eating have become prominent trends worldwide, in turn, resulting in the rapid proliferation of the global fitness and nutritional bars industry. Irrespective of the adverse effects of the COVID-19 pandemic on the confectionery industry, there has been a notable increase in the number of people consuming nutritional bars during 2020–2021.
Additionally, a growing number of fitness centers, health clubs, and gymnasiums, coupled with growing awareness about fitness among the population, is increasing the demand for nutritional bars. Also, increasing popularity of yoga is also expected to increase the demand for nutritional bars. All these factors are contributing to the market growth of nutritional bars.
Asia Pacific Nutritional Bars Market Overview
The Asia Pacific nutritional bars market growth is attributed to the rising preference for on-the-go snacking, meal replacement, functional food, and indulgence. Consumers looked for healthier alternatives with high nutritional value in food and beverages to boost immunity during the COVID-19 pandemic. The rising demand for nutritional bars, including protein bars, high-fiber bars, and meal replacement bars, from young adults and athletes, is also driving the market growth in this region. These nutritional bars enhance the performance and stamina of athletes and fitness lifestyle users. Further, the growing number of health and fitness-conscious individuals has increased the demand for functional products such as nutritional bars. According to the US Bureau of Labor Statistics, average daily participation rates in sports and exercise grew by 3.6% between 2003 and 2015. An increasing number of sports participants in the US is likely to boost the demand for energy bars in Asia Pacific during the forecast period. Also, the popularity of sugar-free, gluten-free, and low-carb nutritional bars is growing across the region.
Moreover, the rising vegan population and veganism are boosting the demand for plant-based nutritional bars. Thus, leading manufacturers are launching plant-based nutritional bars to cater to consumers’ demands. For instance, in June 2020, RXBAR, a Kellogg subsidiary, launched its first plant-based nutritional bar. This bar contains 10g of plant protein obtained from peas and almonds. Such product innovations by manufacturers are expected to boost the Asia Pacific nutritional bars market growth during the forecast period.
Asia Pacific Nutritional Bars Market Revenue and Forecast to 2028 (US$ Million)
Get more information on this report :
Asia Pacific Nutritional Bars Market Segmentation
The Asia Pacific nutritional bars market is segmented into type, category, distribution channel, and country.
Based on type, the Asia Pacific nutritional bars market is segmented into protein bars, high-fiber bars, and others. In 2022, the protein bars segment registered a largest share in the Asia Pacific nutritional bars market.
Based on category, the Asia Pacific nutritional bars market is bifurcated into conventional and gluten-free. In 2022, the conventional segment registered a larger share in the Asia Pacific nutritional bars market.
Based on distribution channel, the Asia Pacific nutritional bars market is segmented into supermarkets & hypermarkets, convenience stores, online retail, and others. In 2022, the supermarkets & hypermarkets segment registered a largest share in the Asia Pacific nutritional bars market.
Based on country, the Asia Pacific nutritional bars market is segmented into China, Japan, India, Australia, South Korea, and the Rest of Asia Pacific. In 2022, the Rest of Asia Pacific segment registered a largest share in the Asia Pacific nutritional bars market.
Clif Bar & Co; General Mills Inc; Mars Inc; The Kellogg Co; The Quaker Oats Co; and The Simply Good Foods Co are the leading companies operating in the Asia Pacific nutritional bars market.
1. Introduction
1.1 Study Scope
1.2 The Insight Partners Research Report Guidance
1.3 Market Segmentation
2. Key Takeaways
3. Research Methodology
3.1 Scope of the Study
3.2 Research Methodology
3.2.1 Data Collection:
3.2.2 Primary Interviews:
3.2.3 Hypothesis Formulation:
3.2.4 Macro-economic Factor Analysis:
3.2.5 Developing Base Number:
3.2.6 Data Triangulation:
3.2.7 Country Level Data:
4. Asia Pacific Nutritional Bars Market Overview
4.1 Market Overview
4.2 Asia Pacific PEST Analysis
4.3 Expert Opinion
5. Asia Pacific Nutritional Bars Market – Key Market Dynamics
5.1 Market Drivers
5.1.1 Growing Preference for Healthy Snacking Among Millennials
5.1.2 Product Developments and Launches by Nutritional Bars Manufacturers
5.2 Market Restraints
5.2.1 Availability of Substitutes
5.3 Market Opportunities
5.3.1 Inclusion of Functional Claims on Labels
5.4 Future Trends
5.4.1 Rising Fitness Trends
5.5 Impact Analysis of Drivers and Restraints
6. Nutritional Bars – Asia Pacific Market Analysis
6.1 Asia Pacific Nutritional Bars Market Overview
6.2 Asia Pacific Nutritional Bars Market –Revenue and Forecast to 2028 (US$ Million)
7. Asia Pacific Nutritional Bars Analysis – By Type
7.1 Overview
7.2 Asia Pacific Nutritional bars Market, By Type (2021 and 2028)
7.3 Protein Bars
7.3.1 Overview
7.3.2 Protein Bars: Asia Pacific Nutritional bars Market – Revenue and Forecast to 2028 (US$ Million)
7.4 High-Fiber Bars
7.4.1 Overview
7.4.2 High-Fiber Bars: Asia Pacific Nutritional bars Market – Revenue and Forecast to 2028 (US$ Million)
7.5 Others
7.5.1 Overview
7.5.2 Others: Asia Pacific Nutritional bars Market – Revenue and Forecast to 2028 (US$ Million)
8. Asia Pacific Nutritional bars Market Analysis – By Category
8.1 Overview
8.2 Asia Pacific Nutritional bars Market, By Category (2021 and 2028)
8.3 Conventional
8.3.1 Overview
8.3.2 Conventional: Asia Pacific Nutritional bars Market – Revenue and Forecast to 2028 (US$ Million)
8.4 Gluten-Free
8.4.1 Overview
8.4.2 Gluten-Free: Asia Pacific Nutritional bars Market – Revenue and Forecast to 2028 (US$ Million)
9. Asia Pacific Nutritional Bars Analysis – By Distribution Channel
9.1 Overview
9.2 Asia Pacific Nutritional bars Market, By Distribution Channel (2021 and 2028)
9.3 Supermarkets and Hypermarkets
9.3.1 Overview
9.3.2 Supermarkets and Hypermarkets: Asia Pacific Nutritional bars Market – Revenue and Forecast to 2028 (US$ Million)
9.4 Convenience Stores
9.4.1 Overview
9.4.2 Convenience Stores: Asia Pacific Nutritional bars Market – Revenue and Forecast to 2028 (US$ Million)
9.5 Online Retail
9.5.1 Overview
9.5.2 Online Retail: Asia Pacific Nutritional bars Market – Revenue and Forecast to 2028 (US$ Million)
9.6 Others
9.6.1 Overview
9.6.2 Others: Asia Pacific Nutritional bars Market – Revenue and Forecast to 2028 (US$ Million)
10. Asia Pacific Nutritional Bars Market – Country Analysis
10.1 Overview
10.1.1 Asia Pacific: Nutritional Bars Market, by Key Country
10.1.1.1 China: Nutritional Bars Market –Revenue and Forecast to 2028 (US$ Million)
10.1.1.1.1 China: Nutritional Bars Market, By Type
10.1.1.1.2 China: Nutritional Bars Market, by Category
10.1.1.1.3 China: Nutritional Bars Market, by Distribution Channel
10.1.1.2 Japan: Nutritional Bars Market –Revenue and Forecast to 2028 (US$ Million)
10.1.1.2.1 Japan: Nutritional Bars Market, By Type
10.1.1.2.2 Japan: Nutritional Bars Market, by Category
10.1.1.2.3 Japan: Nutritional Bars Market, by Distribution Channel
10.1.1.3 India: Nutritional Bars Market –Revenue and Forecast to 2028 (US$ Million)
10.1.1.3.1 India: Nutritional Bars Market, by Type
10.1.1.3.2 India: Nutritional Bars Market, by Category
10.1.1.3.3 India: Nutritional Bars Market, by Distribution Channel
10.1.1.4 Australia: Nutritional Bars Market –Revenue and Forecast to 2028 (US$ Million)
10.1.1.4.1 Australia: Nutritional Bars Market, By Type
10.1.1.4.2 Australia: Nutritional Bars Market, by Category
10.1.1.4.3 Australia: Nutritional Bars Market, by Distribution Channel
10.1.1.5 South Korea: Nutritional Bars Market –Revenue and Forecast to 2028 (US$ Million)
10.1.1.5.1 South Korea: Nutritional Bars Market, By Type
10.1.1.5.2 South Korea: Nutritional Bars Market, by Category
10.1.1.5.3 South Korea: Nutritional Bars Market, by Distribution Channel
10.1.1.6 Rest of Asia Pacific: Nutritional Bars Market –Revenue and Forecast to 2028 (US$ Million)
10.1.1.6.1 Rest of Asia Pacific: Nutritional Bars Market, By Type
10.1.1.6.2 Rest of Asia Pacific: Nutritional Bars Market, by Category
10.1.1.6.3 Rest of Asia Pacific: Nutritional Bars Market, by Distribution Channel
11. Industry Landscape
11.1 Overview
11.2 Product launch
12. Company Profiles
12.1 The Simply Good Foods Co
12.1.1 Key Facts
12.1.2 Business Description
12.1.3 Products and Services
12.1.4 Financial Overview
12.1.5 SWOT Analysis
12.1.6 Key Developments
12.2 Clif Bar & Co
12.2.1 Key Facts
12.2.2 Business Description
12.2.3 Products and Services
12.2.4 Financial Overview
12.2.5 SWOT Analysis
12.2.6 Key Developments
12.3 General Mills Inc
12.3.1 Key Facts
12.3.2 Business Description
12.3.3 Products and Services
12.3.4 Financial Overview
12.3.5 SWOT Analysis
12.3.6 Key Developments
12.4 The Kellogg Co
12.4.1 Key Facts
12.4.2 Business Description
12.4.3 Products and Services
12.4.4 Financial Overview
12.4.5 SWOT Analysis
12.4.6 Key Developments
12.5 The Quaker Oats Co
12.5.1 Key Facts
12.5.2 Business Description
12.5.3 Products and Services
12.5.4 Financial Overview
12.5.5 SWOT Analysis
12.5.6 Key Developments
12.6 Mars Inc
12.6.1 Key Facts
12.6.2 Business Description
12.6.3 Products and Services
12.6.4 Financial Overview
12.6.5 SWOT Analysis
12.6.6 Key Developments
13. Appendix
13.1 About The Insight Partners
13.2 Word Index
LIST OF TABLES
Table 1. Asia Pacific Nutritional Bars Market –Revenue and Forecast to 2028 (US$ Million)
Table 2. China Nutritional Bars Market, By Type – Revenue and Forecast to 2028 (US$ Million)
Table 3. China Nutritional Bars Market, by Category – Revenue and Forecast to 2028 (US$ Million)
Table 4. China Nutritional Bars Market, by Distribution Channel – Revenue and Forecast to 2028 (US$ Million)
Table 5. Japan Nutritional Bars Market, By Type – Revenue and Forecast to 2028 (US$ Million)
Table 6. Japan Nutritional Bars Market, by Category – Revenue and Forecast to 2028 (US$ Million)
Table 7. Japan Nutritional Bars Market, by Distribution Channel – Revenue and Forecast to 2028 (US$ Million)
Table 8. India Nutritional Bars Market, By Type – Revenue and Forecast to 2028 (US$ Million)
Table 9. India Nutritional Bars Market, by Category – Revenue and Forecast to 2028 (US$ Million)
Table 10. India Nutritional Bars Market, by Distribution Channel – Revenue and Forecast to 2028 (US$ Million)
Table 11. Australia Nutritional Bars Market, By Type– Revenue and Forecast to 2028 (US$ Million)
Table 12. Australia Nutritional Bars Market, by Category – Revenue and Forecast to 2028 (US$ Million)
Table 13. Australia Nutritional Bars Market, by Distribution Channel – Revenue and Forecast to 2028 (US$ Million)
Table 14. South Korea Nutritional Bars Market, By Type – Revenue and Forecast to 2028 (US$ Million)
Table 15. South Korea Nutritional Bars Market, by Category – Revenue and Forecast to 2028 (US$ Million)
Table 16. South Korea Nutritional Bars Market, by Distribution Channel – Revenue and Forecast to 2028 (US$ Million)
Table 17. Rest of Asia Pacific Nutritional Bars Market, By Type – Revenue and Forecast to 2028 (US$ Million)
Table 18. Rest of Asia Pacific Nutritional Bars Market, by Category – Revenue and Forecast to 2028 (US$ Million)
Table 19. Rest of Asia Pacific Nutritional Bars Market, by Distribution Channel – Revenue and Forecast to 2028 (US$ Million)
Table 20. List of Abbreviation
LIST OF FIGURES
Figure 1. Asia Pacific Nutritional Bars Market Segmentation
Figure 2. Asia Pacific Nutritional Bars Market Segmentation – By Country
Figure 3. Asia Pacific Nutritional Bars Market Overview
Figure 4. Asia Pacific Nutritional Bars Market: By Category
Figure 5. Asia Pacific Nutritional Bars Market: By Country
Figure 6. Asia Pacific: PEST Analysis
Figure 7. Expert Opinion
Figure 8. Asia Pacific Nutritional Bars Market Impact Analysis of Drivers and Restraints
Figure 9. Asia Pacific: Nutritional Bars Market – Revenue and Forecast to 2028 (US$ Million)
Figure 10. Asia Pacific Nutritional bars Market Revenue Share, By Type (2021 and 2028)
Figure 11. Protein Bars: Asia Pacific Nutritional bars Market – Revenue and Forecast To 2028 (US$ Million)
Figure 12. High-Fiber Bars: Asia Pacific Nutritional bars Market – Revenue and Forecast To 2028 (US$ Million)
Figure 13. Others: Asia Pacific Nutritional bars Market – Revenue and Forecast To 2028 (US$ Million)
Figure 14. Asia Pacific Nutritional bars Market Revenue Share, By Category (2021 and 2028)
Figure 15. Conventional: Asia Pacific Nutritional bars Market – Revenue and Forecast To 2028 (US$ Million)
Figure 16. Gluten-Free: Asia Pacific Nutritional bars Market – Revenue and Forecast To 2028 (US$ Million)
Figure 17. Asia Pacific Nutritional bars Market Revenue Share, By Distribution Channel (2021 and 2028)
Figure 18. Supermarkets and Hypermarkets: Asia Pacific Nutritional bars Market – Revenue and Forecast To 2028 (US$ Million)
Figure 19. Convenience Stores: Asia Pacific Nutritional bars Market – Revenue and Forecast To 2028 (US$ Million)
Figure 20. Online Retail: Asia Pacific Nutritional bars Market – Revenue and Forecast To 2028 (US$ Million)
Figure 21. Others: Asia Pacific Nutritional bars Market – Revenue and Forecast To 2028 (US$ Million)
Figure 22. Asia Pacific: Nutritional Bars Market, by Key Country— Revenue (2021) (US$ Million)
Figure 23. Asia Pacific: Nutritional Bars Market Revenue Share, by Key Country (2021 and 2028)
Figure 24. China: Nutritional Bars Market –Revenue and Forecast to 2028 (US$ Million)
Figure 25. Japan: Nutritional Bars Market –Revenue and Forecast to 2028 (US$ Million)
Figure 26. India: Nutritional Bars Market –Revenue and Forecast to 2028 (US$ Million)
Figure 27. Australia: Nutritional Bars Market –Revenue and Forecast to 2028 (US$ Million)
Figure 28. South Korea: Nutritional Bars Market –Revenue and Forecast to 2028 (US$ Million)
Figure 29. Rest of Asia Pacific: Nutritional Bars Market –Revenue and Forecast to 2028 (US$ Million)
- Clif Bar & Co
- General Mills Inc
- Mars Inc
- The Kellogg Co
- The Quaker Oats Co
- The Simply Good Foods Co
- Save and reduce time carrying out entry-level research by identifying the growth, size, leading players, and segments in the Asia Pacific nutritional bars market.
- Highlights key business priorities in order to assist companies to realign their business strategies
- The key findings and recommendations highlight crucial progressive industry trends in the Asia Pacific nutritional bars market, thereby allowing players across the value chain to develop effective long-term strategies
- Develop/modify business expansion plans by using substantial growth offering developed and emerging markets
- Scrutinize in-depth Asia Pacific market trends and outlook coupled with the factors driving the nutritional bars market, as well as those hindering it
- Enhance the decision-making process by understanding the strategies that underpin commercial interest with respect to client products, segmentation, pricing, and distribution