Asia Pacific Industrial Valve Market Forecast to 2028 - COVID-19 Impact and Regional Analysis - by Material Type (Cast Iron, Steel, Cryogenic, Alloy-based, and Others), Valve Type (Ball Valves, Butterfly Valves, Diaphragm Valves, Safety Valves, Piston RAM Valves, Gate Valves, and Control Valves), and Industry (Oil & Gas and Chemicals & Petrochemical)
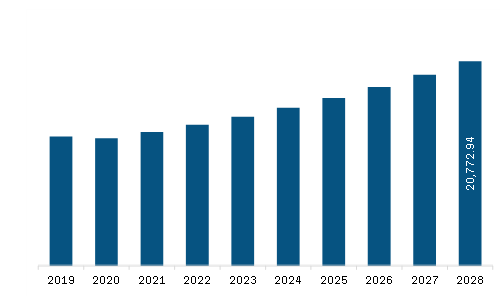
The Asia Pacific industrial valve market is expected to grow from US$ 15,124.43 million in 2023 to US$ 20,772.94 million by 2028; it is estimated to grow at a CAGR of 6.6% from 2023 to 2028.
Rising Popularity of Smart Valves
Rising advancements in microprocessor processing capabilities and high-speed connectivity technologies have paved the way for the wide-scale deployment of the Internet of Things (IoT). With the growing emphasis on digitalization and automation, manufacturers to achieve higher efficiency across production processes are increasing their demand for smart valves. For instance, Belimo Energy Valve, a product of BELIMO Holding AG, offers easy access to valuable data and various control functions of the valve, including measure flow; monitor current energy consumption; and control valve position, flow, or the thermal power with the help of Modbus, MP-Bus, BACnet, or IoT connectivity. In addition, smart valves can monitor their health and predict any forthcoming adversities in their operations. An ideal smart valve includes an integrated battery backup, a small solar panel, Wi-Fi connectivity, and a dedicated remote-control feature. In water supply applications, authorized users receive an SMS when the valve cuts the water supply. Thus, continuous progress in smart city projects across the Asia Pacific is anticipated to create demand for smart industrial valves for monitoring and controlling utility lines, which is expected to fuel the industrial valve market growth during the forecast period.
Asia Pacific Industrial Valve Market Overview
The Asia Pacific (APAC) industrial valve market, based on country, is segmented into Australia, China, Japan, India, South Korea, and the Rest of Asia Pacific. In 2022, Asia Pacific held the largest industrial valve market share. The demand for industrial valve market is rising in the water & wastewater management industry in Asia Pacific and is expected to grow in the next few years. The region's dense population, high per capita income, and rapid industrialization are driving the industrial valve market expansion. China, India, and Southeast Asian countries are among the fastest-growing economies of the region. The growing demand for new and enhanced water and wastewater treatment facilities and the increasing requirement for proper water usage by urban population across Asia Pacific drive the industrial valve market growth.
Asia Pacific Industrial Valve Market Revenue and Forecast to 2028 (US$ Million)
Asia Pacific Industrial Valve Market Segmentation
The Asia Pacific industrial valve market is segmented based on material type, valve type, industry, and country. Based on material type, the Asia Pacific industrial valve market is segmented into cast iron, steel, cryogenic, alloy-based, and others. The steel segment held the largest market share in 2023.
Based on valve type, the Asia Pacific industrial valve market is segmented into ball valves, butterfly valves, diaphragm valves, safety valves, piston ram valves, gate valves, and control valves. The ball valves segment held the largest market share in 2023.
Based on industry, the Asia Pacific industrial valve market is bifurcated into oil & gas and chemicals & petrochemical. The oil & gas segment held a larger market share in 2023.
Based on country, the Asia Pacific industrial valve market is segmented into China, India, Japan, Australia, South Korea, and the Rest of Asia Pacific. China dominated the Asia Pacific industrial valve market share in 2023.
Velan Inc.; Crane Co.; Circor International Inc.; Flowserve Corp; Emerson Electric Co.; KITZ Corporation; Neway Valve (Suzhou) Co., Ltd; Spirax Sarco Engineering Plc; Schlumberger Ltd; and Weir Group PLC are the leading companies operating in the Asia Pacific industrial valve market.
1. Introduction
1.1 Study Scope
1.2 The Insight Partners Research Report Guidance
1.3 Market Segmentation
2. Key Takeaways
3. Research Methodology
3.1 Coverage
3.2 Secondary Research
3.3 Primary Research
4. Asia Pacific Industrial Valve Market Landscape
4.1 Market Overview
4.2 PEST Analysis
4.2.1 Asia Pacific
4.3 Ecosystem Analysis
4.4 Expert Opinion
5. Asia Pacific Industrial Valve Market – Key Market Dynamics
5.1 Market Drivers
5.1.1 Growing Use of Valves in Oil and Gas Industry
5.1.2 Increasing Use of Ball Valves and Butterfly Valves
5.2 Market Restraints
5.2.1 Long Service Life and Risk of Corrosion
5.3 Market Opportunities
5.3.1 Rising Preference for Large Valves
5.4 Future Trends
5.4.1 Rising Popularity of Smart Valves
5.5 Impact Analysis of Drivers and Restraints
6. Industrial Valve Market –Asia Pacific Analysis
6.1 Industrial Valve Market Asia Pacific Overview
6.2 Industrial Valve Market – Revenue and Forecast to 2028 (US$ Million)
7. Asia Pacific Industrial Valve Market Analysis – by Material Type
7.1 Overview
7.2 Industrial Valve Market, by Material Type (2022 and 2028)
7.3 Cast Iron
7.3.1 Overview
7.3.2 Cast Iron: Industrial valve Market – Revenue and Forecast to 2028 (US$ Million)
7.4 Steel
7.4.1 Overview
7.4.2 Steel: Industrial valve Market – Revenue and Forecast to 2028 (US$ Million)
7.5 Cryogenic
7.5.1 Overview
7.5.2 Cryogenic: Industrial valve Market – Revenue and Forecast to 2028 (US$ Million)
7.6 Alloy-Based
7.6.1 Overview
7.6.2 Alloy-based: Industrial valve Market – Revenue and Forecast to 2028 (US$ Million)
7.7 Others
7.7.1 Overview
7.7.2 Others: Industrial valve Market – Revenue and Forecast to 2028 (US$ Million)
8. Asia Pacific Industrial Valve Market Analysis – by Valve Type
8.1 Overview
8.2 Industrial Valve Market, by Valve Type (2022 and 2028)
8.3 Ball Valve
8.3.1 Overview
8.3.2 Ball Valve: Industrial valve Market – Revenue and Forecast to 2028 (US$ Million)
8.4 Butterfly Valves
8.4.1 Overview
8.4.2 Butterfly Valves: Industrial valve Market – Revenue and Forecast to 2028 (US$ Million)
8.5 Diaphragm Valves
8.5.1 Overview
8.5.2 Diaphragm Valves: Industrial valve Market – Revenue and Forecast to 2028 (US$ Million)
8.6 Safety Valves
8.6.1 Overview
8.6.2 Safety Valves: Industrial valve Market – Revenue and Forecast to 2028 (US$ Million)
8.7 Piston RAM Valves
8.7.1 Overview
8.7.2 Piston RAM Valves: Industrial valve Market – Revenue and Forecast to 2028 (US$ Million)
8.8 Gate Valves
8.8.1 Overview
8.8.2 Gate Valves: Industrial valve Market – Revenue and Forecast to 2028 (US$ Million)
8.8.3 Size
8.8.3.1 Overview
8.8.3.2 Less than 5 Inch.
8.8.3.2.1 Overview
8.8.3.2.2 Less than 5 Inch: Industrial valve Market – Revenue and Forecast to 2028 (US$ Million)
8.8.3.3 6–15 Inch
8.8.3.3.1 Overview
8.8.3.3.2 6-15 Inch: Industrial valve Market – Revenue and Forecast to 2028 (US$ Million)
8.8.3.4–25 Inch
8.8.3.4.1 Overview
8.8.3.4.2-25 Inch: Industrial valve Market – Revenue and Forecast to 2028 (US$ Million)
8.8.3.5 Above 25 Inch
8.8.3.5.1 Overview
8.8.3.5.2 Above 25 Inch: Industrial valve Market – Revenue and Forecast to 2028 (US$ Million)
8.8.4 Type
8.8.4.1 Overview
8.8.4.2 Expanding Gate Valve
8.8.4.2.1 Overview
8.8.4.2.2 Expanding Gate Valve: Industrial valve Market – Revenue and Forecast to 2028 (US$ Million)
8.8.4.2.3 Expanding Gate Valve Market, by Size
8.8.4.2.4 Expanding Gate Valve Market, by End User
8.8.4.2.5 Expanding Gate Valve Market, by Class
8.8.4.3 Through Conduit Gate Valve
8.8.4.3.1 Overview
8.8.4.3.2 Through Conduit Gate Valve: Industrial valve Market – Revenue and Forecast to 2028 (US$ Million)
8.8.4.3.3 Through Conduit Gate Valve Market, by Size
8.8.4.3.4 Through Conduit Gate Valve Market, by End User
8.8.4.3.5 Through Conduit Gate Valve Market, by Class
8.8.4.4 Slab Gate Valve
8.8.4.4.1 Overview
8.8.4.4.2 Slab Gate Valve: Industrial valve Market – Revenue and Forecast to 2028 (US$ Million)
8.8.4.4.3 Size
8.8.4.4.4 End User
8.8.4.4.5 Class
8.8.5 End-User
8.8.5.1 Overview
8.8.5.2 Oil & Gas
8.8.5.2.1 Overview
8.8.5.2.2 Oil & Gas: Industrial valve Market – Revenue and Forecast to 2028 (US$ Million)
8.8.5.3 Water & Wastewater Treatment
8.8.5.3.1 Overview
8.8.5.3.2 Water & Wastewater Treatment: Industrial valve Market – Revenue and Forecast to 2028 (US$ Million)
8.8.5.4 Chemical
8.8.5.4.1 Overview
8.8.5.4.2 Chemical: Industrial valve Market – Revenue and Forecast to 2028 (US$ Million)
8.8.5.5 Others
8.8.5.5.1 Overview
8.8.5.5.2 Others: Industrial valve Market – Revenue and Forecast to 2028 (US$ Million)
8.8.6 Class
8.8.6.1 Overview
8.8.6.2
8.8.6.2.1 Overview
8.8.6.2.2: Industrial Valve Market – Revenue and Forecast to 2028 (US$ Million)
8.8.6.3
8.8.6.3.1 Overview
8.8.6.3.2: Industrial Valve Market – Revenue and Forecast to 2028 (US$ Million)
8.8.6.4
8.8.6.4.1 Overview
8.8.6.4.2: Industrial Valve Market – Revenue and Forecast to 2028 (US$ Million)
8.8.6.5
8.8.6.5.1 Overview
8.8.6.5.2: Industrial Valve Market – Revenue and Forecast to 2028 (US$ Million)
8.8.6.6
8.8.6.6.1 Overview
8.8.6.6.2: Industrial Valve Market – Revenue and Forecast to 2028 (US$ Million)
8.8.6.70
8.8.6.7.1 Overview
8.8.6.7.20: Industrial Valve Market – Revenue and Forecast to 2028 (US$ Million)
8.8.6.80
8.8.6.8.1 Overview
8.8.6.8.20: Industrial Valve Market – Revenue and Forecast to 2028 (US$ Million)
8.8.6.90
8.8.6.9.1 Overview
8.8.6.9.20: Industrial Valve Market – Revenue and Forecast to 2028 (US$ Million)
8.9 Control Valves
8.9.1 Overview
8.9.2 Control Valves: Industrial Valve Market – Revenue and Forecast to 2028 (US$ Million)
9. Asia Pacific Industrial Valve Market Analysis – by Industry
9.1 Overview
9.2 Industrial Valves Market, by Industry (2022 and 2028)
9.3 Oil & Gas
9.3.1 Overview
9.3.2 Oil & Gas: Industrial Valve Market – Revenue and Forecast to 2028 (US$ Million)
9.4 Chemicals & Petrochemical
9.4.1 Overview
9.4.2 Chemicals & Petrochemical: Industrial Valve Market – Revenue and Forecast to 2028 (US$ Million)
10. Asia Pacific Industrial Valve Market – by Country Analysis
10.1 Asia Pacific: Industrial Valve Market
10.1.1 Asia Pacific: Industrial Valve Market, by Key Country
10.1.2 Australia: Industrial Valve Market – Revenue and Forecast to 2028 (US$ Million)
10.1.2.1 Australia: Industrial Valve Market, by Material Type
10.1.2.2 Australia: Industrial Valve Market, by Valve Type
10.1.2.2.1 Australia: Gate Valve Market, by Size
10.1.2.2.2 Australia: Gate Valve Market, by Type
10.1.2.2.2.1 Australia: Expanding Gate Valve Market, by Size
10.1.2.2.2.2 Australia: Expanding Gate Valve Market, by End User
10.1.2.2.2.3 Australia: Expanding Gate Valve Market, by Class
10.1.2.2.2.4 Australia: Through Conduit Gate Valve Market, by Size
10.1.2.2.2.5 Australia: Through Conduit Gate Valve Market, by End User
10.1.2.2.2.6 Australia: Through Conduit Gate Valve Market, by Class
10.1.2.2.2.7 Australia: Slab Gate Valve Market, by Size
10.1.2.2.2.8 Australia: Slab Gate Valve Market, by End User
10.1.2.2.2.9 Australia: Slab Gate Valve Market, by Class
10.1.2.2.3 Australia: Gate Valve Market, by End-User
10.1.2.2.4 Australia: Gate Valve Market, by Class
10.1.2.3 Australia: Industrial Valve Market, by Industry
10.1.3 China: Industrial Valve Market – Revenue and Forecast to 2028 (US$ Million)
10.1.3.1 China: Industrial Valve Market, by Material Type
10.1.3.2 China: Industrial Valve Market, by Valve Type
10.1.3.2.1 China: Gate Valve Market, by Size
10.1.3.2.2 China: Gate Valve Market, by Type
10.1.3.2.2.1 China: Expanding Gate Valve Market, by Size
10.1.3.2.2.2 China: Expanding Gate Valve Market, by End User
10.1.3.2.2.3 China: Expanding Gate Valve Market, by Class
10.1.3.2.2.4 China: Through Conduit Gate Valve Market, by Size
10.1.3.2.2.5 China: Through Conduit Gate Valve Market, by End User
10.1.3.2.2.6 China: Through Conduit Gate Valve Market, by Class
10.1.3.2.2.7 China: Slab Gate Valve Market, by Size
10.1.3.2.2.8 China: Slab Gate Valve Market, by End User
10.1.3.2.2.9 China: Slab Gate Valve Market, by Class
10.1.3.2.3 China: Gate Valve Market, by End-User
10.1.3.2.4 China: Gate Valve Market, by Class
10.1.3.3 China: Industrial Valve Market, by Industry
10.1.4 India: Industrial Valve Market – Revenue and Forecast to 2028 (US$ Million)
10.1.4.1 India: Industrial Valve Market, by Material Type
10.1.4.2 India: Industrial Valve Market, by Valve Type
10.1.4.2.1 India: Gate Valve Market, by Size
10.1.4.2.2 India: Gate Valve Market, by Type
10.1.4.2.2.1 India: Expanding Gate Valve Market, by Size
10.1.4.2.2.2 India: Expanding Gate Valve Market, by End User
10.1.4.2.2.3 India: Expanding Gate Valve Market, by Class
10.1.4.2.2.4 India: Through Conduit Gate Valve Market, by Size
10.1.4.2.2.5 India: Through Conduit Gate Valve Market, by End User
10.1.4.2.2.6 India: Through Conduit Gate Valve Market, by Class
10.1.4.2.2.7 India: Slab Gate Valve Market, by Size
10.1.4.2.2.8 India: Slab Gate Valve Market, by End User
10.1.4.2.2.9 India: Slab Gate Valve Market, by Class
10.1.4.2.3 India: Gate Valve Market, by End-User
10.1.4.2.4 India: Gate Valve Market, by Class
10.1.4.3 India: Industrial Valve Market, by Industry
10.1.5 Japan: Industrial Valve Market – Revenue and Forecast to 2028 (US$ Million)
10.1.5.1 Japan: Industrial Valve Market, by Material Type
10.1.5.2 Japan: Industrial Valve Market, by Valve Type
10.1.5.2.1 Japan: Gate Valve Market, by Size
10.1.5.2.2 Japan: Gate Valve Market, by Type
10.1.5.2.2.1 Japan: Expanding Gate Valve Market, by Size
10.1.5.2.2.2 Japan: Expanding Gate Valve Market, by End User
10.1.5.2.2.3 Japan: Expanding Gate Valve Market, by Class
10.1.5.2.2.4 Japan: Through Conduit Gate Valve Market, by Size
10.1.5.2.2.5 Japan: Through Conduit Gate Valve Market, by End User
10.1.5.2.2.6 Japan: Through Conduit Gate Valve Market, by Class
10.1.5.2.2.7 Japan: Slab Gate Valve Market, by Size
10.1.5.2.2.8 Japan: Slab Gate Valve Market, by End User
10.1.5.2.2.9 Japan: Slab Gate Valve Market, by Class
10.1.5.2.3 Japan: Gate Valve Market, by End-User
10.1.5.2.4 Japan: Gate Valve Market, by Class
10.1.5.3 Japan: Industrial Valve Market, by Industry
10.1.6 South Korea: Industrial Valve Market – Revenue and Forecast to 2028 (US$ Million)
10.1.6.1 South Korea: Industrial Valve Market, by Material Type
10.1.6.2 South Korea: Industrial Valve Market, by Valve Type
10.1.6.2.1 South Korea: Gate Valve Market, by Size
10.1.6.2.2 South Korea: Gate Valve Market, by Type
10.1.6.2.2.1 South Korea: Expanding Gate Valve Market, by Size
10.1.6.2.2.2 South Korea: Expanding Gate Valve Market, by End User
10.1.6.2.2.3 South Korea: Expanding Gate Valve Market, by Class
10.1.6.2.2.4 South Korea: Through Conduit Gate Valve Market, by Size
10.1.6.2.2.5 South Korea: Through Conduit Gate Valve Market, by End User
10.1.6.2.2.6 South Korea: Through Conduit Gate Valve Market, by Class
10.1.6.2.2.7 South Korea: Slab Gate Valve Market, by Size
10.1.6.2.2.8 South Korea: Slab Gate Valve Market, by End User
10.1.6.2.2.9 South Korea: Slab Gate Valve Market, by Class
10.1.6.2.3 South Korea: Gate Valve Market, by End-User
10.1.6.2.4 South Korea: Gate Valve Market, by Class
10.1.6.3 South Korea: Industrial Valve Market, by Industry
10.1.7 Rest of Asia Pacific: Industrial Valve Market – Revenue and Forecast to 2028 (US$ Million)
10.1.7.1 Rest of Asia Pacific: Industrial Valve Market, by Material Type
10.1.7.2 Rest of Asia Pacific: Industrial Valve Market, by Valve Type
10.1.7.2.1 Rest of Asia Pacific: Gate Valve Market, by Size
10.1.7.2.2 Rest of Asia Pacific: Gate Valve Market, by Type
10.1.7.2.2.1 Rest of Asia Pacific: Expanding Gate Valve Market, by Size
10.1.7.2.2.2 Rest of Asia Pacific: Expanding Gate Valve Market, by End User
10.1.7.2.2.3 Rest of Asia Pacific: Expanding Gate Valve Market, by Class
10.1.7.2.2.4 Rest of Asia Pacific: Through Conduit Gate Valve Market, by Size
10.1.7.2.2.5 Rest of Asia Pacific: Through Conduit Gate Valve Market, by End User
10.1.7.2.2.6 Rest of Asia Pacific: Through Conduit Gate Valve Market, by Class
10.1.7.2.2.7 Rest of Asia Pacific: Slab Gate Valve Market, by Size
10.1.7.2.2.8 Rest of Asia Pacific: Slab Gate Valve Market, by End User
10.1.7.2.2.9 Rest of Asia Pacific: Slab Gate Valve Market, by Class
10.1.7.2.3 Rest of Asia Pacific: Gate Valve Market, by End-User
10.1.7.2.4 Rest of Asia Pacific: Gate Valve Market, by Class
10.1.7.3 Rest of Asia Pacific: Industrial Valve Market, by Industry
11. Industrial Valves Market- Industry Landscape
11.1 Overview
11.2 Market Initiative
12. Industrial Valves Market – Company Profiles
12.1 Velan Inc.
12.1.1 Key Facts
12.1.2 Business Description
12.1.3 Products and Services
12.1.4 Financial Overview
12.1.5 SWOT Analysis
12.1.6 Key Developments
12.2 Crane Co.
12.2.1 Key Facts
12.2.2 Business Description
12.2.3 Products and Services
12.2.4 Financial Overview
12.2.5 SWOT Analysis
12.2.6 Key Developments
12.3 CIRCOR International Inc
12.3.1 Key Facts
12.3.2 Business Description
12.3.3 Products and Services
12.3.4 Financial Overview
12.3.5 SWOT Analysis
12.3.6 Key Developments
12.4 Flowserve Corp
12.4.1 Key Facts
12.4.2 Business Description
12.4.3 Products and Services
12.4.4 Financial Overview
12.4.5 SWOT Analysis
12.4.6 Key Developments
12.5 Emerson Electric Co
12.5.1 Key Facts
12.5.2 Business Description
12.5.3 Products and Services
12.5.4 Financial Overview
12.5.5 SWOT Analysis
12.5.6 Key Developments
12.6 KITZ Corporation
12.6.1 Key Facts
12.6.2 Business Description
12.6.3 Products and Services
12.6.4 Financial Overview
12.6.5 SWOT Analysis
12.6.6 Key Developments
12.7 Neway Valve (Suzhou) Co., Ltd
12.7.1 Key Facts
12.7.2 Business Description
12.7.3 Products and Services
12.7.4 Financial Overview
12.7.5 SWOT Analysis
12.7.6 Key Developments
12.8 Spirax Sarco Engineering Plc
12.8.1 Key Facts
12.8.2 Business Description
12.8.3 Products and Services
12.8.4 Financial Overview
12.8.5 SWOT Analysis
12.8.6 Key Developments
12.9 Schlumberger Ltd
12.9.1 Key Facts
12.9.2 Business Description
12.9.3 Products and Services
12.9.4 Financial Overview
12.9.5 SWOT Analysis
12.9.6 Key Developments
12.10 Weir Group PLC
12.10.1 Key Facts
12.10.2 Business Description
12.10.3 Products and Services
12.10.4 Financial Overview
12.10.5 SWOT Analysis
12.10.6 Key Developments
13. Appendix
13.1 About The Insight Partners
13.2 Word Index
LIST OF TABLES
Table 1. Asia Pacific Industrial valve Market – Revenue and Forecast to 2028 (US$ Million)
Table 2. Expanding Gate Valve Market, by Size– Revenue and Forecast to 2028 (US$ Million)
Table 3. Expanding Gate Valve Market, by End User– Revenue and Forecast to 2028 (US$ Million)
Table 4. Expanding Gate Valve Market, by Class– Revenue and Forecast to 2028 (US$ Million)
Table 5. Through Conduit Gate Valve Market, by Size– Revenue and Forecast to 2028 (US$ Million)
Table 6. Through Conduit Gate Valve Market, by End User– Revenue and Forecast to 2028 (US$ Million)
Table 7. Through Conduit Gate Valve Market, by Class– Revenue and Forecast to 2028 (US$ Million)
Table 8. Slab Gate Valve Gate Valve Market, by Size– Revenue and Forecast to 2028 (US$ Million)
Table 9. Slab Gate Valve Gate Valve Market, by End User– Revenue and Forecast to 2028 (US$ Million)
Table 10. Slab Gate Valve Gate Valve Market, by Class– Revenue and Forecast to 2028 (US$ Million)
Table 11. Australia: Industrial Valve Market, by Material Type– Revenue and Forecast to 2028 (US$ Million)
Table 12. Australia: Industrial Valve Market, by Valve Type – Revenue and Forecast to 2028 (US$ Million)
Table 13. Australia: Gate Valve Market, by Size – Revenue and Forecast to 2028 (US$ Million)
Table 14. Australia: Gate Valve Market, by Type – Revenue and Forecast to 2028 (US$ Million)
Table 15. Australia: Expanding Gate Valve Market, by Size – Revenue and Forecast to 2028 (US$ Million)
Table 16. Australia: Expanding Gate Valve Market, by End User – Revenue and Forecast to 2028 (US$ Million)
Table 17. Australia: Expanding Gate Valve Market, by Class – Revenue and Forecast to 2028 (US$ Million)
Table 18. Australia: Through Conduit Gate Valve Market, by Size – Revenue and Forecast to 2028 (US$ Million)
Table 19. Australia: Through Conduit Gate Valve Market, by End User – Revenue and Forecast to 2028 (US$ Million)
Table 20. Australia: Through Conduit Gate Valve Market, by Class – Revenue and Forecast to 2028 (US$ Million)
Table 21. Australia: Slab Gate Valve Market, by Size – Revenue and Forecast to 2028 (US$ Million)
Table 22. Australia: Slab Gate Valve Market, by End User – Revenue and Forecast to 2028 (US$ Million)
Table 23. Australia: Slab Gate Valve Market, by Class – Revenue and Forecast to 2028 (US$ Million)
Table 24. Australia: Gate Valve Market, by End-User – Revenue and Forecast to 2028 (US$ Million)
Table 25. Australia: Gate Valve Market, by Class – Revenue and Forecast to 2028 (US$ Million)
Table 26. Australia: Industrial Valve Market, by Industry – Revenue and Forecast to 2028 (US$ Million)
Table 27. China: Industrial Valve Market, by Material Type– Revenue and Forecast to 2028 (US$ Million)
Table 28. China: Industrial Valve Market, by Valve Type – Revenue and Forecast to 2028 (US$ Million)
Table 29. China: Gate Valve Market, by Size – Revenue and Forecast to 2028 (US$ Million)
Table 30. China: Gate Valve Market, by Type – Revenue and Forecast to 2028 (US$ Million)
Table 31. China: Expanding Gate Valve Market, by Size – Revenue and Forecast to 2028 (US$ Million)
Table 32. China: Expanding Gate Valve Market, by End User – Revenue and Forecast to 2028 (US$ Million)
Table 33. China: Expanding Gate Valve Market, by Class – Revenue and Forecast to 2028 (US$ Million)
Table 34. China: Through Conduit Gate Valve Market, by Size – Revenue and Forecast to 2028 (US$ Million)
Table 35. China: Through Conduit Gate Valve Market, by End User – Revenue and Forecast to 2028 (US$ Million)
Table 36. China: Through Conduit Gate Valve Market, by Class – Revenue and Forecast to 2028 (US$ Million)
Table 37. China: Slab Gate Valve Market, by Size – Revenue and Forecast to 2028 (US$ Million)
Table 38. China: Slab Gate Valve Market, by End User – Revenue and Forecast to 2028 (US$ Million)
Table 39. China: Slab Gate Valve Market, by Class – Revenue and Forecast to 2028 (US$ Million)
Table 40. China: Gate Valve Market, by End-User – Revenue and Forecast to 2028 (US$ Million)
Table 41. China: Gate Valve Market, by Class – Revenue and Forecast to 2028 (US$ Million)
Table 42. China: Industrial Valve Market, by Industry – Revenue and Forecast to 2028 (US$ Million)
Table 43. India: Industrial Valve Market, by Material Type– Revenue and Forecast to 2028 (US$ Million)
Table 44. India: Industrial Valve Market, by Valve Type – Revenue and Forecast to 2028 (US$ Million)
Table 45. India: Gate Valve Market, by Size – Revenue and Forecast to 2028 (US$ Million)
Table 46. India: Gate Valve Market, by Type – Revenue and Forecast to 2028 (US$ Million)
Table 47. India: Expanding Gate Valve Market, by Size – Revenue and Forecast to 2028 (US$ Million)
Table 48. India: Expanding Gate Valve Market, by End User – Revenue and Forecast to 2028 (US$ Million)
Table 49. India: Expanding Gate Valve Market, by Class – Revenue and Forecast to 2028 (US$ Million)
Table 50. India: Through Conduit Gate Valve Market, by Size – Revenue and Forecast to 2028 (US$ Million)
Table 51. India: Through Conduit Gate Valve Market, by End User – Revenue and Forecast to 2028 (US$ Million)
Table 52. India: Through Conduit Gate Valve Market, by Class – Revenue and Forecast to 2028 (US$ Million)
Table 53. India: Slab Gate Valve Market, by Size – Revenue and Forecast to 2028 (US$ Million)
Table 54. India: Slab Gate Valve Market, by End User – Revenue and Forecast to 2028 (US$ Million)
Table 55. India: Slab Gate Valve Market, by Class – Revenue and Forecast to 2028 (US$ Million)
Table 56. India: Gate Valve Market, by End-User – Revenue and Forecast to 2028 (US$ Million)
Table 57. India: Gate Valve Market, by Class – Revenue and Forecast to 2028 (US$ Million)
Table 58. India: Industrial Valve Market, by Industry – Revenue and Forecast to 2028 (US$ Million)
Table 59. Japan: Industrial Valve Market, by Material Type– Revenue and Forecast to 2028 (US$ Million)
Table 60. Japan: Industrial Valve Market, by Valve Type – Revenue and Forecast to 2028 (US$ Million)
Table 61. Japan: Gate Valve Market, by Size – Revenue and Forecast to 2028 (US$ Million)
Table 62. Japan: Gate Valve Market, by Type – Revenue and Forecast to 2028 (US$ Million)
Table 63. Japan: Expanding Gate Valve Market, by Size – Revenue and Forecast to 2028 (US$ Million)
Table 64. Japan: Expanding Gate Valve Market, by End User – Revenue and Forecast to 2028 (US$ Million)
Table 65. Japan: Expanding Gate Valve Market, by Class – Revenue and Forecast to 2028 (US$ Million)
Table 66. Japan: Through Conduit Gate Valve Market, by Size – Revenue and Forecast to 2028 (US$ Million)
Table 67. Japan: Through Conduit Gate Valve Market, by End User – Revenue and Forecast to 2028 (US$ Million)
Table 68. Japan: Through Conduit Gate Valve Market, by Class – Revenue and Forecast to 2028 (US$ Million)
Table 69. Japan: Slab Gate Valve Market, by Size – Revenue and Forecast to 2028 (US$ Million)
Table 70. Japan: Slab Gate Valve Market, by End User – Revenue and Forecast to 2028 (US$ Million)
Table 71. Japan: Slab Gate Valve Market, by Class – Revenue and Forecast to 2028 (US$ Million)
Table 72. Japan: Gate Valve Market, by End-User – Revenue and Forecast to 2028 (US$ Million)
Table 73. Japan: Gate Valve Market, by Class – Revenue and Forecast to 2028 (US$ Million)
Table 74. Japan: Industrial Valve Market, by Industry – Revenue and Forecast to 2028 (US$ Million)
Table 75. South Korea: Industrial Valve Market, by Material Type– Revenue and Forecast to 2028 (US$ Million)
Table 76. South Korea: Industrial Valve Market, by Valve Type – Revenue and Forecast to 2028 (US$ Million)
Table 77. South Korea: Gate Valve Market, by Size – Revenue and Forecast to 2028 (US$ Million)
Table 78. South Korea: Gate Valve Market, by Type – Revenue and Forecast to 2028 (US$ Million)
Table 79. South Korea: Expanding Gate Valve Market, by Size – Revenue and Forecast to 2028 (US$ Million)
Table 80. South Korea: Expanding Gate Valve Market, by End User – Revenue and Forecast to 2028 (US$ Million)
Table 81. South Korea: Expanding Gate Valve Market, by Class – Revenue and Forecast to 2028 (US$ Million)
Table 82. South Korea: Through Conduit Gate Valve Market, by Size – Revenue and Forecast to 2028 (US$ Million)
Table 83. South Korea: Through Conduit Gate Valve Market, by End User – Revenue and Forecast to 2028 (US$ Million)
Table 84. South Korea: Through Conduit Gate Valve Market, by Class – Revenue and Forecast to 2028 (US$ Million)
Table 85. South Korea: Slab Gate Valve Market, by Size – Revenue and Forecast to 2028 (US$ Million)
Table 86. South Korea: Slab Gate Valve Market, by End User – Revenue and Forecast to 2028 (US$ Million)
Table 87. South Korea: Slab Gate Valve Market, by Class – Revenue and Forecast to 2028 (US$ Million)
Table 88. South Korea: Gate Valve Market, by End-User – Revenue and Forecast to 2028 (US$ Million)
Table 89. South Korea: Gate Valve Market, by Class – Revenue and Forecast to 2028 (US$ Million)
Table 90. South Korea: Industrial Valve Market, by Industry – Revenue and Forecast to 2028 (US$ Million)
Table 91. Rest of Asia Pacific: Industrial Valve Market, by Material Type– Revenue and Forecast to 2028 (US$ Million)
Table 92. Rest of Asia Pacific: Industrial Valve Market, by Valve Type – Revenue and Forecast to 2028 (US$ Million)
Table 93. Rest of Asia Pacific: Gate Valve Market, by Size – Revenue and Forecast to 2028 (US$ Million)
Table 94. Rest of Asia Pacific: Gate Valve Market, by Type – Revenue and Forecast to 2028 (US$ Million)
Table 95. Rest of Asia Pacific: Expanding Gate Valve Market, by Size – Revenue and Forecast to 2028 (US$ Million)
Table 96. Rest of Asia Pacific: Expanding Gate Valve Market, by End User – Revenue and Forecast to 2028 (US$ Million)
Table 97. Rest of Asia Pacific: Expanding Gate Valve Market, by Class – Revenue and Forecast to 2028 (US$ Million)
Table 98. Rest of Asia Pacific: Through Conduit Gate Valve Market, by Size – Revenue and Forecast to 2028 (US$ Million)
Table 99. Rest of Asia Pacific: Through Conduit Gate Valve Market, by End User – Revenue and Forecast to 2028 (US$ Million)
Table 100. Rest of Asia Pacific: Through Conduit Gate Valve Market, by Class – Revenue and Forecast to 2028 (US$ Million)
Table 101. Rest of Asia Pacific: Slab Gate Valve Market, by Size – Revenue and Forecast to 2028 (US$ Million)
Table 102. Rest of Asia Pacific: Slab Gate Valve Market, by End User – Revenue and Forecast to 2028 (US$ Million)
Table 103. Rest of Asia Pacific: Slab Gate Valve Market, by Class – Revenue and Forecast to 2028 (US$ Million)
Table 104. Rest of Asia Pacific: Gate Valve Market, by End-User – Revenue and Forecast to 2028 (US$ Million)
Table 105. Rest of Asia Pacific: Gate Valve Market, by Class – Revenue and Forecast to 2028 (US$ Million)
Table 106. Rest of Asia Pacific: Industrial Valve Market, by Industry – Revenue and Forecast to 2028 (US$ Million)
Table 107. List of Abbreviation
LIST OF FIGURES
Figure 1. Asia Pacific Industrial Valve Market Segmentation
Figure 2. Asia Pacific Industrial Valve Market Segmentation – by Country
Figure 3. Asia Pacific Industrial Valve Market Overview
Figure 4. Asia Pacific Industrial Valve Market, by Material Type
Figure 5. Asia Pacific Industrial Valve Market, by Valve Type
Figure 6. Asia Pacific Industrial Valve Market, by Industry
Figure 7. Asia Pacific Industrial Valve Market, by Country
Figure 8. Asia Pacific: PEST Analysis
Figure 9. Asia Pacific Ecosystem Analysis
Figure 10. Asia Pacific Expert Opinion
Figure 11. Asia Pacific Industrial Valve Market: Impact Analysis of Drivers and Restraints
Figure 12. Asia Pacific Industrial Valve Market – Revenue and Forecast to 2028 (US$ Million)
Figure 13. Asia Pacific Industrial Valve Market Revenue Share, by Material Type (2022 and 2028)
Figure 14. Cast Iron: Asia Pacific Industrial Valve Market – Revenue and Forecast to 2028 (US$ Million)
Figure 15. Steel: Asia Pacific Industrial Valve Market – Revenue and Forecast to 2028 (US$ Million)
Figure 16. Cryogenic: Asia Pacific Industrial Valve Market – Revenue and Forecast to 2028 (US$ Million)
Figure 17. Alloy-based: Asia Pacific Industrial Valve Market – Revenue and Forecast to 2028 (US$ Million)
Figure 18. Others: Asia Pacific Industrial Valve Market – Revenue and Forecast to 2028 (US$ Million)
Figure 19. Asia Pacific Industrial Valve Market Revenue Share, by Material Type (2022 and 2028)
Figure 20. Ball Valve: Asia Pacific Industrial Valve Market – Revenue and Forecast to 2028 (US$ Million)
Figure 21. Butterfly Valves: Asia Pacific Industrial Valve Market – Revenue and Forecast to 2028 (US$ Million)
Figure 22. Diaphragm Valves: Asia Pacific Industrial Valve Market – Revenue and Forecast to 2028 (US$ Million)
Figure 23. Safety Valves: Asia Pacific Industrial Valve Market – Revenue and Forecast to 2028 (US$ Million)
Figure 24. Piston RAM Valves: Asia Pacific Industrial Valve Market – Revenue and Forecast to 2028 (US$ Million)
Figure 25. Gate Valves: Asia Pacific Industrial Valve Market – Revenue and Forecast to 2028 (US$ Million)
Figure 26. Less than 5 Inch: Asia Pacific Industrial Valve Market – Revenue and Forecast to 2028 (US$ Million)
Figure 27. 6-15 Inch: Asia Pacific Industrial Valve Market – Revenue and Forecast to 2028 (US$ Million)
Figure 28.-25 Inch: Asia Pacific Industrial Valve Market – Revenue and Forecast to 2028 (US$ Million)
Figure 29. Above 25 Inch: Asia Pacific Industrial Valve Market – Revenue and Forecast to 2028 (US$ Million)
Figure 30. Expanding Gate Valve: Asia Pacific Industrial Valve Market – Revenue and Forecast to 2028 (US$ Million)
Figure 31. Through Conduit Gate Valve: Asia Pacific Industrial Valve Market – Revenue and Forecast to 2028 (US$ Million)
Figure 32. Slab Gate Valve: Asia Pacific Industrial Valve Market – Revenue and Forecast to 2028 (US$ Million)
Figure 33. Oil & Gas: Asia Pacific Industrial Valve Market – Revenue and Forecast to 2028 (US$ Million)
Figure 34. Water & Wastewater Treatment: Asia Pacific Industrial Valve Market – Revenue and Forecast to 2028 (US$ Million)
Figure 35. Chemical: Asia Pacific Industrial Valve Market – Revenue and Forecast to 2028 (US$ Million)
Figure 36. Others: Asia Pacific Industrial Valve Market – Revenue and Forecast to 2028 (US$ Million)
Figure 37.: Asia Pacific Industrial Valve Market – Revenue and Forecast to 2028 (US$ Million)
Figure 38.: Asia Pacific Industrial Valve Market – Revenue and Forecast to 2028 (US$ Million)
Figure 39.: Asia Pacific Industrial Valve Market – Revenue and Forecast to 2028 (US$ Million)
Figure 40.: Asia Pacific Industrial Valve Market – Revenue and Forecast to 2028 (US$ Million)
Figure 41.: Asia Pacific Industrial Valve Market – Revenue and Forecast to 2028 (US$ Million)
Figure 42.0: Asia Pacific Industrial Valve Market – Revenue and Forecast to 2028 (US$ Million)
Figure 43.0: Asia Pacific Industrial Valve Market – Revenue and Forecast to 2028 (US$ Million)
Figure 44.0: Asia Pacific Industrial Valve Market – Revenue and Forecast to 2028 (US$ Million)
Figure 45. Control Valves: Asia Pacific Industrial Valve Market – Revenue and Forecast to 2028 (US$ Million)
Figure 46. Asia Pacific Industrial Valve Market Revenue Share, by Industry (2022 and 2028)
Figure 47. Oil & Gas: Asia Pacific Industrial Valve Market – Revenue and Forecast to 2028 (US$ Million)
Figure 48. Chemicals & Petrochemical: Asia Pacific Industrial Valve Market – Revenue and Forecast to 2028 (US$ Million)
Figure 49. Asia Pacific: Industrial Valve Market, by Key Country – Revenue (2022) (US$ Million)
Figure 50. Asia Pacific: Industrial Valve Market Revenue Share, by Key Country (2022 & 2028)
Figure 51. Australia: Industrial Valve Market – Revenue and Forecast to 2028 (US$ Million)
Figure 52. China: Industrial Valve Market – Revenue and Forecast to 2028 (US$ Million)
Figure 53. India: Industrial Valve Market – Revenue and Forecast to 2028 (US$ Million)
Figure 54. Japan: Industrial Valve Market – Revenue and Forecast to 2028 (US$ Million)
Figure 55. South Korea: Industrial Valve Market – Revenue and Forecast to 2028 (US$ Million)
Figure 56. Rest of Asia Pacific: Industrial Valve Market – Revenue and Forecast to 2028 (US$ Million)
- Velan Inc.
- Crane Co.
- Circor International Inc.
- Flowserve Corp
- Emerson Electric Co.
- KITZ Corporation
- Neway Valve (Suzhou) Co., Ltd
- Spirax Sarco Engineering Plc
- Schlumberger Ltd
- Weir Group PLC
- Save and reduce time carrying out entry-level research by identifying the growth, size, leading players, and segments in the Asia Pacific industrial valve market.
- Highlights key business priorities in order to assist companies to realign their business strategies
- The key findings and recommendations highlight crucial progressive industry trends in the Asia Pacific industrial valve market, thereby allowing players across the value chain to develop effective long-term strategies
- Develop/modify business expansion plans by using substantial growth offering developed and emerging markets
- Scrutinize in-depth Asia Pacific market trends and outlook coupled with the factors driving the Asia Pacific industrial valve market, as well as those hindering it
- Enhance the decision-making process by understanding the strategies that underpin commercial interest with respect to client products, segmentation, pricing, and distribution