Asia Pacific Electric Ship Market Forecast to 2028 - COVID-19 Impact and Regional Analysis By Type (Battery Electric Ships, Plug-In Hybrid Electric Ships, and Hybrid Electric Ships), Power (Less than 75 Kw, 75 - 150 Kw, 151 - 745 Kw, 746 - 7560 Kw, and More than 7560 Kw), Range (Less than 50 Km, 50 - 100 Km, 101 - 1000 Km, and More than 1000 Km), and Ship Type (Cruise Ships, Ferries, Tankers, Bulk Carriers, Fishing Vessels, Destroyers, Aircraft Carriers, and Others)
The APAC electric ship market is expected to grow from US$ 738.31 million in 2021 to US$ 1655.59 million by 2028; it is estimated to grow at a CAGR of 12.2% from 2021 to 2028.
Nowadays, hybrid propulsion technology is commonly used for small vessels, such as ferries. However, with the development of marine electric propulsion technology and alternative fuels such as fuel cells, there is a massive opportunity for manufacturers to work on hybrid-electric propulsion systems for larger ships. The stricter emissions targets encouraged shipbuilders to install a hybrid propulsion system on existing or new vessels. The research & development (R&D) department for ABB’s marine activities in Norway stated that the hybrid propulsion systems significantly reduce fuel consumption and emissions, according to the article published by the Institution of Engineering and Technology in January 2019. In addition, the hybrid marine engines can be fueled by diesel, LNG, or hydrogen and use a fuel cell, batteries, or an electric motor. This capability makes hybrids particularly suitable for large ships in the deep sea. The new 3600 TDW[AA3] cargo vessels are meant to boast a future-proof design, in the sense that not only are they ready to operate with clean energy alternatives, but the cargo vessels can also be adapted for additional green modification in the future. Additionally, in December 2021, e5 Lab Inc. (Tokyo-based firm) and Mitsubishi Shipbuilding Co., Ltd., a part of Mitsubishi Heavy Industries Group, agreed to provide the design for ROBOSHIP, a standard hybrid-electric propulsion vessel that the two companies are seeking to promote as a vision for the future of ships, for a 499-tonne [AA4] biomass fuel carrier being built by Honda Heavy Industries Co., Ltd. Therefore, with the growing emission control norms, the adoption of hybrid-electric propulsion systems is increasing among larger ships, creating a massive opportunity for manufacturing larger ships using hybrid-electric propulsion systems.
With the new features and technologies, vendors can attract new customers and expand their footprints in emerging markets. This factor is likely to drive the APAC electric ship market. The APAC electric ship market is expected to grow at a good CAGR during the forecast period.
APAC Electric Ship Market Revenue and Forecast to 2028 (US$ Million)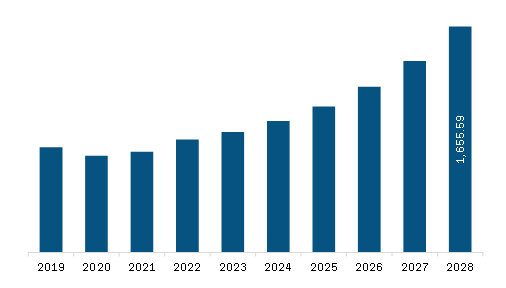
Get more information on this report :
APAC Electric Ship Market Segmentation
The APAC electric ship market is segmented based on type, power, range, ship type, and country. Based on type, the APAC electric ship market is segmented into battery electric ships, plug-in hybrid electric ships, and hybrid electric ships. The hybrid electric ships segment dominated the APAC electric ship market in 2020. Based on power, the APAC electric ship market is segmented into Less than 75 Kw, 75 - 150 Kw, 151 - 745 Kw, 746 - 7560 Kw, and more than 7560 Kw. The 746 - 7560 Kw segment dominated the APAC electric ship market in 2020. Based on range, APAC electric ship market is segmented into Less than 50 Km, 50 - 100 Km, 101 - 1000 Km, and more than 1000 Km. The 101 km - 1000 Km segment dominated the APAC electric ship market in 2020. Based on ship type, APAC electric ship market is segmented into cruise ships, ferries, tankers, bulk carriers, fishing vessels, destroyers, aircraft carriers, and others. The ferries segment dominated the APAC electric ship market in 2020. Based on country, the APAC electric ship market is segmented into Australia, China, India, Japan, South Korea, and Rest of APAC. The China segment dominated the APAC electric ship market in 2020.
BAE System; MAN Energy Solution; Siemens Energy; and Vard AS are among the leading companies in the APAC electric ship market.
1. Introduction
1.1 Scope of the Study
1.2 The Insight Partners Research Report Guidance
1.3 Market Segmentation
2. Key Takeaways
3. Research Methodology
3.1 Coverage
3.2 Secondary Research
3.3 Primary Research
4. APAC Electric Ship Market Landscape
4.1 Market Overview
4.2 PEST Analysis
4.2.1 Asia-Pacific – PEST Analysis
4.3 Ecosystem Analysis
4.4 Expert Opinions
5. APAC Electric Ship Market – Key Industry Dynamics
5.1 Market Drivers
5.1.1 Surge in Adoption of Hybrid and Electric Propulsion Systems for Retrofitting Ships
5.1.2 Expansion of Regulatory Support from Government Authorities and Industry Associations
5.2 Market Restraints
5.2.1 Narrow Range and Capacity of Fully Electric Ships
5.3 Market Opportunities
5.3.1 Flow in the adoption of Hybrid-Electric Propulsion Technology for Large Ships
5.4 Future Trends
5.4.1 Advancing Technology in Energy Storage Devices
5.5 Impact Analysis of Drivers and Restraints
6. Electric Ship Market – APAC Analysis
6.1 Overview
6.2 APAC Electric Ship Market Forecast and Analysis
7. APAC Electric Ships Market Analysis and Forecast to 2028 – By Type
7.1 APAC Electric Ships Market Revenue Share, by Type (2020 and 2028)
7.2 Battery Electric Ships
7.2.1 Overview
7.2.2 Battery Electric Ships: Electric Ships Market – Revenue and Forecast to 2028 (US$ Million)
7.3 Plug-in Electric Ships
7.3.1 Overview
7.3.2 Plug-in Electric Ships: Electric Ships Market – Revenue and Forecast to 2028 (US$ Million)
7.4 Hybrid Electric Ships
7.4.1 Overview
7.4.2 Hybrid Electric Ships: Electric Ships Market – Revenue and Forecast to 2028 (US$ Million)
8. APAC Electric Ships Market Analysis and Forecast to 2028 – By Power
8.1 APAC Electric Ships Market Revenue Share, by Power (2020 and 2028)
8.2 Less than 75kW
8.2.1 Overview
8.2.2 Less than 75kW: Electric Ships Market – Revenue and Forecast to 2028 (US$ Million)
8.3kW-150kW
8.3.1 Overview
8.3.2kW-150kW: Electric Ships Market – Revenue and Forecast to 2028 (US$ Million)
8.4kW-745kW
8.4.1 Overview
8.4.2kW-745kW: Electric Ships Market – Revenue and Forecast to 2028 (US$ Million)
8.5kW-7560kW
8.5.1 Overview
8.5.2kW-7560kW: Electric Ships Market – Revenue and Forecast to 2028 (US$ Million)
8.6 More than 7560kW
8.6.1 Overview
8.6.2 More than 7560kW: Electric Ships Market – Revenue and Forecast to 2028 (US$ Million)
9. APAC Electric Ships Market Analysis and Forecast to 2028 – By Range
9.1 APAC Electric Ships Market Revenue Share, by Range (2020 and 2028)
9.2 Less than 50 Km
9.2.1 Overview
9.2.2 Less than 50 km: Electric Ships Market – Revenue and Forecast to 2028 (US$ Million)
9.3-100 Km
9.3.1 Overview
9.3.2-100 Km: Electric Ships Market – Revenue and Forecast to 2028 (US$ Million)
9.4 -1000 Km
9.4.1 Overview
9.4.2-1001 Km: Electric Ships Market – Revenue and Forecast to 2028 (US$ Million)
9.5 More than 1000 Km
9.5.1 Overview
9.5.2 More than 1000 Km: Electric Ships Market – Revenue and Forecast to 2028 (US$ Million)
10. APAC Electric Ships Market Analysis and Forecast to 2028 – By Ship Type
10.1 APAC Electric Ships Market Revenue Share, by Ship Type (2020 and 2028)
10.2 Cruise Ships
10.2.1 Overview
10.2.2 Cruise Ships: Electric Ships Market – Revenue and Forecast to 2028 (US$ Million)
10.3 Ferries
10.3.1 Overview
10.3.2 Ferries: Electric Ships Market – Revenue and Forecast to 2028 (US$ Million)
10.4 Tankers
10.4.1 Overview
10.4.2 Tankers: Electric Ships Market – Revenue and Forecast to 2028 (US$ Million)
10.5 Bulk Carriers
10.5.1 Overview
10.5.2 Bulk Carriers: Electric Ships Market – Revenue and Forecast to 2028 (US$ Million)
10.6 Fishing Vessels
10.6.1 Overview
10.6.2 Fishing Vessels: Electric Ships Market – Revenue and Forecast to 2028 (US$ Million)
10.7 Destroyers
10.7.1 Overview
10.7.2 Destroyers: Electric Ships Market – Revenue and Forecast to 2028 (US$ Million)
10.8 Aircraft Carriers
10.8.1 Overview
10.8.2 Aircraft Carriers: Electric Ships Market – Revenue and Forecast to 2028 (US$ Million)
10.9 Others
10.9.1 Overview
10.9.2 Others: Electric Ships Market – Revenue and Forecast to 2028 (US$ Million)
11. APAC Electric Ship Market – Country Analysis
11.1 APAC: Electric Ship Market
11.1.1 Overview
11.1.2 APAC Electric Ship Market Breakdown, by Country
11.1.2.1 China Electric Ship Market, Revenue and Forecast to 2028 (US$ million)
11.1.2.1.1 China Electric Ship Market Breakdown, by Type
11.1.2.1.2 China Electric Ship Market Breakdown, by Power
11.1.2.1.3 China Electric Ship Market Breakdown, by Range
11.1.2.1.4 China Electric Ship Market Breakdown, by Ship Type
11.1.2.2 Japan Electric Ship Market, Revenue and Forecast to 2028 (US$ million)
11.1.2.2.1 Japan Electric Ship Market Breakdown, by Type
11.1.2.2.2 Japan Electric Ship Market Breakdown, by Power
11.1.2.2.3 Japan Electric Ship Market Breakdown, by Range
11.1.2.2.4 Japan Electric Ship Market Breakdown, by Ship Type
11.1.2.3 South Korea Electric Ship Market, Revenue and Forecast to 2028 (US$ million)
11.1.2.3.1 South Korea Electric Ship Market Breakdown, by Type
11.1.2.3.2 South Korea Electric Ship Market Breakdown, by Power
11.1.2.3.3 South Korea Electric Ship Market Breakdown, by Range
11.1.2.3.4 South Korea Electric Ship Market Breakdown, by Ship Type
11.1.2.4 Australia Electric Ship Market, Revenue and Forecast to 2028 (US$ million)
11.1.2.4.1 Australia Electric Ship Market Breakdown, by Type
11.1.2.4.2 Australia Electric Ship Market Breakdown, by Power
11.1.2.4.3 Australia Electric Ship Market Breakdown, by Range
11.1.2.4.4 Australia Electric Ship Market Breakdown, by Ship Type
11.1.2.5 Rest of APAC Electric Ship Market, Revenue and Forecast to 2028 (US$ million)
11.1.2.5.1 Rest of APAC Electric Ship Market Breakdown, by Type
11.1.2.5.2 Rest of APAC Electric Ship Market Breakdown, by Power
11.1.2.5.3 Rest of APAC Electric Ship Market Breakdown, by Range
11.1.2.5.4 Rest of APAC Electric Ship Market Breakdown, by Ship Type
12. Industry Landscape
12.1 Overview
12.2 Agreements, Collaborations and Joint Ventures
12.3 New Product Launches
12.4 EXPANSIONS AND OTHER STRATEGIC DEVELOPMENTS
13. Company Profiles
13.1 BAE Systems
13.1.1 Key Facts
13.1.2 Business Description
13.1.3 Products and Services
13.1.4 Financial Overview
13.1.5 SWOT Analysis
13.1.6 Key Developments
13.2 MAN Energy Solutions
13.2.1 Key Facts
13.2.2 Business Description
13.2.3 Products and Services
13.2.4 Financial Overview
13.2.5 SWOT Analysis
13.2.6 Key Developments
13.3 Siemens Energy
13.3.1 Key Facts
13.3.2 Business Description
13.3.3 Products and Services
13.3.4 Financial Overview
13.3.5 SWOT Analysis
13.3.6 Key Developments
13.4 VARD AS
13.4.1 Key Facts
13.4.2 Business Description
13.4.3 Products and Services
13.4.4 Financial Overview
13.4.5 SWOT Analysis
13.4.6 Key Developments
14. Appendix
14.1 About The Insight Partners
14.2 Glossary of Terms
LIST OF TABLES
Table 1. APAC Electric Ship Market Revenue and Forecasts to 2027 (US$ Million)
Table 2. APAC Electric Ship Market, Revenue and Forecast To 2028 – By Country (US$ million)
Table 3. China Electric Ship Market, Revenue and Forecast to 2028 – By Type (US$ million)
Table 4. China Electric Ship Market, Revenue and Forecast to 2028 – By Power (US$ million)
Table 5. China Electric Ship Market, Revenue and Forecast to 2028 – By Range (US$ million)
Table 6. China Electric Ship Market, Revenue and Forecast to 2028 – By Ship Type (US$ million)
Table 7. Japan Electric Ship Market, Revenue and Forecast to 2028 – By Type (US$ million)
Table 8. Japan Electric Ship Market, Revenue and Forecast to 2028 – By Power (US$ million)
Table 9. Japan Electric Ship Market, Revenue and Forecast to 2028 – By Range (US$ million)
Table 10. Japan Electric Ship Market, Revenue and Forecast to 2028 – By Ship Type (US$ million)
Table 11. South Korea Electric Ship Market, Revenue and Forecast to 2028 – By Type (US$ million)
Table 12. South Korea Electric Ship Market, Revenue and Forecast to 2028 – By Power (US$ million)
Table 13. South Korea Electric Ship Market, Revenue and Forecast to 2028 – By Range (US$ million)
Table 14. South Korea Electric Ship Market, Revenue and Forecast to 2028 – By Ship Type (US$ million)
Table 15. Australia Electric Ship Market, Revenue and Forecast to 2028 – By Type (US$ million)
Table 16. Australia Electric Ship Market, Revenue and Forecast to 2028 – By Power (US$ million)
Table 17. Australia Electric Ship Market, Revenue and Forecast to 2028 – By Range (US$ million)
Table 18. Australia Electric Ship Market, Revenue and Forecast to 2028 – By Ship Type (US$ million)
Table 19. Rest of APAC Electric Ship Market, Revenue and Forecast to 2028 – By Type (US$ million)
Table 20. Rest of APAC Electric Ship Market, Revenue and Forecast to 2028 – By Power (US$ million)
Table 21. Rest of APAC Electric Ship Market, Revenue and Forecast to 2028 – By Range (US$ million)
Table 22. Rest of APAC Electric Ship Market, Revenue and Forecast to 2028 – By Ship Type (US$ million)
Table 23. Glossary of Term
LIST OF FIGURES
Figure 1. APAC Electric Ship Market Segmentation
Figure 2. APAC Electric Ship Market Segmentation – By Country
Figure 3. APAC Electric Ship Market Overview
Figure 4. Hybrid Electric Ships Segment Held the Largest Market Share in 2020
Figure 5. APAC 746 - 7560 Kw Held the Largest Market Share in 2020
Figure 6. APAC 101 – 1000 Km Held the Largest Market Share in 2020
Figure 7. APAC Ferries Held the Largest Market Share in 2020
Figure 8. Japan was the Largest Revenue Contributor in 2020
Figure 9. Asia-Pacific – PEST analysis
Figure 10. APAC Electric Ship Market – Ecosystem Analysis
Figure 11. APAC Electric Ship Market: Impact Analysis of Drivers and Restraints
Figure 12. APAC Electric Ship Market Forecast and Analysis to 2028, US$ Million
Figure 13. APAC Electric Ships Market Revenue Share, by Type (2020 and 2028)
Figure 14. APAC Battery Electric Ships: Electric Ships Market – Revenue and Forecast to 2028 (US$ Million)
Figure 15. APAC Plug-in Electric Ships: Electric Ships Market – Revenue and Forecast to 2028 (US$ Million)
Figure 16. APAC Hybrid Electric Ships: Electric Ships Market – Revenue and Forecast to 2028 (US$ Million)
Figure 17. APAC Electric Ships Market Revenue Share, by Power (2020 and 2028)
Figure 18. APAC Less than 75kW: Electric Ships Market – Revenue and Forecast to 2028 (US$ Million)
Figure 19. APAC 75kW-150kW: Electric Ships Market – Revenue and Forecast to 2028 (US$ Million)
Figure 20. APAC 151kW-745kW: Electric Ships Market – Revenue and Forecast to 2028 (US$ Million)
Figure 21. APAC 746kW-7560kW: Electric Ships Market – Revenue and Forecast to 2028 (US$ Million)
Figure 22. APAC More than 7560kW: Electric Ships Market – Revenue and Forecast to 2028 (US$ Million)
Figure 23. APAC Electric Ships Market Revenue Share, by Range (2020 and 2028)
Figure 24. APAC Less than 50 Km: Electric Ships Market – Revenue and Forecast to 2028 (US$ Million)
Figure 25. APAC 50-100 Km: Electric Ships Market – Revenue and Forecast to 2028 (US$ Million)
Figure 26. APAC 100-1001 Km: Electric Ships Market – Revenue and Forecast to 2028 (US$ Million)
Figure 27. APAC More than 1000 Km: Electric Ships Market – Revenue and Forecast to 2028 (US$ Million)
Figure 28. APAC Electric Ships Market Revenue Share, by Ship Type (2020 and 2028)
Figure 29. APAC Cruise Ships: Electric Ships Market – Revenue and Forecast to 2028 (US$ Million)
Figure 30. APAC Ferries: Electric Ships Market – Revenue and Forecast to 2028 (US$ Million)
Figure 31. APAC Tankers: Electric Ships Market – Revenue and Forecast to 2028 (US$ Million)
Figure 32. APAC Bulk Carriers: Electric Ships Market – Revenue and Forecast to 2028 (US$ Million)
Figure 33. APAC Fishing Vessels: Electric Ships Market – Revenue and Forecast to 2028 (US$ Million)
Figure 34. APAC Destroyers: Electric Ships Market – Revenue and Forecast to 2028 (US$ Million)
Figure 35. APAC Aircraft Carriers: Electric Ships Market – Revenue and Forecast to 2028 (US$ Million)
Figure 36. APAC Others: Electric Ships Market – Revenue and Forecast to 2028 (US$ Million)
Figure 37. APAC Electric Ship Market, by Key Country – Revenue (2020) (US$ Million)
Figure 38. APAC Electric Ship Market Breakdown, by Country, 2020 & 2028 (%)
Figure 39. China Electric Ship Market, Revenue and Forecast To 2028 (US$ million)
Figure 40. Japan Electric Ship Market, Revenue and Forecast To 2028 (US$ million)
Figure 41. South Korea Electric Ship Market, Revenue and Forecast To 2028 (US$ million)
Figure 42. Australia Electric Ship Market, Revenue and Forecast To 2028 (US$ million)
Figure 43. Rest of APAC Electric Ship Market, Revenue and Forecast To 2028 (US$ million)
- BAE System
- MAN Energy Solution
- Siemens Energy
- Vard AS
- Save and reduce time carrying out entry-level research by identifying the growth, size, leading players, and segments in the APAC electric ship market.
- Highlights key business priorities in order to assist companies to realign their business strategies
- The key findings and recommendations highlight crucial progressive industry trends in the APAC electric ship market, thereby allowing players across the value chain to develop effective long-term strategies
- Develop/modify business expansion plans by using substantial growth offering developed and emerging markets
- Scrutinize in-depth APAC market trends and outlook coupled with the factors driving the APAC electric ship market, as well as those hindering it
- Enhance the decision-making process by understanding the strategies that underpin commercial interest with respect to client products, segmentation, pricing, and distribution