Asia Pacific Directed Energy Weapons Market Forecast to 2028 - COVID-19 Impact and Regional Analysis By Technology (Laser, Microwave, Particle Beam, and Others), Range (Less Than 1 Mile and More Than 1 Mile), Application (Ground, Naval, and Airborne), and Platform (Armored Vehicles, Unmanned Systems, Handheld Systems, Aircraft Systems, Ships and Submarines, and Others)
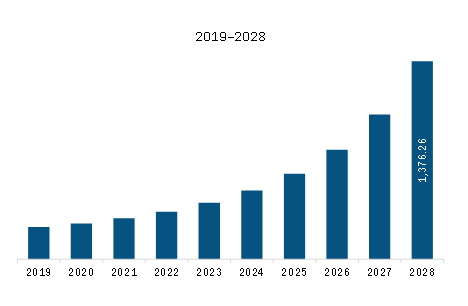
The directed energy weapons market in Asia Pacific is expected to grow from US$ 330.88 million in 2022 to US$ 1,376.26 million by 2028. It is estimated to grow at a CAGR of 26.8% from 2022 to 2028.
Widening the Adoption of DEW as Countermeasures
Manufacturers in the directed energy weapons market are working on developing countermeasures to missiles and rockets. Directed energy weapons such as microwaves, particle-beam, and lasers that are powered by electricity are in no need of complex supply chains as compared to missile batteries, hence there is high adoption of directed energy weapons instead of missiles. This is a driving factor for the DEW to be adopted by the military to utilize as countermeasures for threats, especially for units that operate within a range of an enemy’s missiles. Counter measuring such threats for a few dollars by generating electricity-powered laser shots is far more affordable compared to kinetic interceptors that cost millions of dollars. Directed energy weapons are an affordable means to defeat low-cost threats such as small UAVs. For instance, DoDs M-SHORAD is a directed energy weapon developed to fire lasers and sensors onto a Stryker vehicle. Higher-power lasers are being developed to countermeasure China’s voluminous missile salvos. In 2019, the Advanced Test High Energy Asset (ATHENA) weapons were developed by Lockheed Martin to slew, acquire, track, and defeat drones with a high-energy laser. The system is utilized to eliminate airborne targets by causing loss of control and structural failure.
Market Overview
Based on country, the Asia Pacific directed energy weapons market is segmented into Australia, China, India, Japan, South Korea, and the rest of Asia Pacific. The growing collaboration with the US and Asia Pacific countries for defense growth is fuelling and driving the directed energy weapons market over the forecast period. The company of many countries is also procuring a large number of tactical and range missiles by the country, which will provide new defensive capabilities for naval, air, land, and space platform. This will further create the growth of directed energy weapons in the market. The region has witnessed considerable growth in the defense sector as technology and the military expenditure of the countries like China and India. Resultantly, there has been a substantial investment in national defense technological and industrial bases. Spending in the Asia Pacific region is driven by major procurement programs formulated by large defense spenders such as India, China, Australia, and South Korea. These countries are anticipated to focus on the indigenous development of directed energy weapons. For instance, in June 2022, China will complete a space station which has garnered much media attention as a symbol of Chinese power projection into space. In comparison, attention has been given to the secretive developments involving Chinese-directed energy programs recently exposed by the Secure World Foundation. Moreover, in February 2022, the incident occurred in Northern Australia when one of two Chinese warships sailing in the area allegedly illuminated a P-8A Poseidon aircraft belonging to the Australian air force. The department decried the incident as “unprofessional and unsafe military conduct, according to the Australian Department of Defense. In addition, the Australian defense is asking for a response from China over using military-grade laser weapons on surveillance aircraft. Further, many countries in the Asia Pacific countries like India, China, and Japan are in the developing stage of directed energy weapons.
Asia Pacific Directed Energy Weapons Market Revenue and Forecast to 2028 (US$ Million)
The Asia Pacific directed energy weapons market is segmented into platform, application, Range, Technology, and country.
Based on platform, the market is segmented into armored vehicles, unmanned systems, handheld systems, aircraft systems, ships and submarines, and others. The armored vehicles segment registered the largest market share in 2022. Based on range, the market is categorized into less than 1 mile and more than 1 mile. The less than 1 mile segment held the largest market share in 2022. Based on technology, the Asia Pacific directed energy weapons market is segmented into laser, microwave, particle beam, and others. The laser segment held the largest market share in 2022. Based on application, the Asia Pacific directed energy weapons market is segmented into ground, naval, and airborne. The ground segment held the largest market share in 2022. Based on country, the market is segmented into Australia, China, India, Japan, South Korea, and Rest of APAC. China dominated the market share in 2022. Lockheed Martin Corporation; Thales Group; L3Harris Technologies, Inc.; Elbit Systems Ltd.; Raytheon Technologies Corporation; BAE Systems; Honeywell International Inc.; Rheinmetall AG; Moog Inc.; and Boeing are the leading companies operating in the directed energy weapons market in the region
1. Introduction
1.1 Scope of the Study
1.2 The Insight Partners Research Report Guidance
1.3 Market Segmentation
2. Key Takeaways
3. Research Methodology
3.1 Coverage
3.2 Secondary Research
3.3 Primary Research
4. Asia Pacific Directed Energy Weapons Market Landscape
4.1 Market Overview
4.2 Porter’s Five Force Analysis
4.2.1 Bargaining Power of Buyers
4.2.2 Bargaining Power of Suppliers
4.2.3 Threat to New Entrants
4.2.4 Threat to Substitutes
4.2.5 Competitive Rivalry
4.3 Ecosystem Analysis
4.4 Expert Opinion
5. Asia Pacific Directed Energy Weapons Market - Key Market Dynamics
5.1 Market Drivers
5.1.1 Widening Adoption of Directed-Energy Weapons as Countermeasures
5.2 Market Restraints
5.2.1 Severe Health Consequences of Using Directed Energy Weapons
5.3 Market Opportunities
5.3.1 Strengthening Military Research & Development Programs for Directed Energy Weapons
5.4 Impact Analysis of Drivers and Restraints
6. Asia Pacific Directed Energy Weapons Market Analysis
6.1 Asia Pacific Directed Energy Weapons Market Overview
6.2 Asia Pacific Directed Energy Weapons Market Forecast and Analysis
7. Asia Pacific Directed Energy Weapons Market Analysis – by Technology
7.1 Overview
7.2 Asia Pacific Directed Energy Weapons Market, by Technology
7.3 Laser
7.3.1 Overview
7.3.2 Laser: Directed Energy Weapons Market – Revenue and Forecast to 2028 (US$ Million)
7.3.2.1 High Energy
7.3.2.1.1 High Energy: Directed Energy Weapons Market – Revenue and Forecast to 2028 (US$ Million)
7.3.2.2 Low Energy
7.3.2.2.1 Low Energy: Directed Energy Weapons Market – Revenue and Forecast to 2028 (US$ Million)
7.4 Microwave
7.4.1 Overview
7.4.2 Microwave: Directed Energy Weapons Market – Revenue and Forecast to 2028 (US$ Million)
7.5 Particle Beam
7.5.1 Overview
7.5.2 Particle Beam: Directed Energy Weapons Market – Revenue and Forecast to 2028 (US$ Million)
7.6 Others
7.6.1 Overview
7.6.2 Others: Directed Energy Weapons Market – Revenue and Forecast to 2028 (US$ Million)
8. Asia Pacific Directed Energy Weapons Market Analysis – by Range
8.1 Overview
8.2 Asia Pacific Directed Energy Weapons Market, by Range
8.3 Less than 1 mile
8.3.1 Overview
8.3.2 Less than 1 mile: Directed Energy Weapons Market – Revenue and Forecast to 2028 (US$ Million)
8.4 More than 1 mile
8.4.1 Overview
8.4.2 More than 1 mile: Directed Energy Weapons Market – Revenue and Forecast to 2028 (US$ Million)
9. Asia Pacific Directed Energy Weapons Market Analysis – by Application
9.1 Overview
9.2 Asia Pacific Directed Energy Weapons Market, by Application
9.3 Ground
9.3.1 Overview
9.3.2 Ground: Directed Energy Weapons Market – Revenue and Forecast to 2028 (US$ Million)
9.4 Naval
9.4.1 Overview
9.4.2 Naval: Directed Energy Weapons Market – Revenue and Forecast to 2028 (US$ Million)
9.5 Airborne
9.5.1 Overview
9.5.2 Airborne: Directed Energy Weapons Market – Revenue and Forecast to 2028 (US$ Million)
10. Asia Pacific Directed Energy Weapons Market Analysis – by Platform
10.1 Overview
10.2 Asia Pacific Directed Energy Weapons Market, by Platforms
10.3 Armored Vehicles
10.3.1 Overview
10.3.2 Armored Vehicles: Directed Energy Weapons Market – Revenue and Forecast to 2028 (US$ Million)
10.4 Unmanned Systems
10.4.1 Overview
10.4.2 Unmanned Systems: Directed Energy Weapons Market – Revenue and Forecast to 2028 (US$ Million)
10.5 Handheld Systems
10.5.1 Overview
10.5.2 Handheld Systems: Directed Energy Weapons Market – Revenue and Forecast to 2028 (US$ Million)
10.6 Aircraft Systems
10.6.1 Overview
10.6.2 Aircraft Systems: Directed Energy Weapons Market – Revenue and Forecast to 2028 (US$ Million)
10.7 Ships and Submarines
10.7.1 Overview
10.7.2 Ships and Submarines: Directed Energy Weapons Market – Revenue and Forecast to 2028 (US$ Million)
10.8 Others
10.8.1 Overview
10.8.2 Others: Directed Energy Weapons Market – Revenue and Forecast to 2028 (US$ Million)
11. Asia Pacific Directed Energy Weapons Market – Country Analysis
11.1 Overview
11.1.1 Asia Pacific Directed Energy Weapons Market, by Key Country
11.1.1.1 Australia: Directed Energy Weapons Market – Revenue and Forecast to 2028 (US$ Million)
11.1.1.1.1 Australia: Directed Energy Weapons Market, by Platforms
11.1.1.1.2 Australia: Directed Energy Weapons Market, by Range
11.1.1.1.3 Australia: Directed Energy Weapons Market, by Technology
11.1.1.1.3.1 Australia: Directed Energy Weapons Market, by Laser
11.1.1.1.4 Australia: Directed Energy Weapons Market, by Application
11.1.1.2 China: Directed Energy Weapons Market – Revenue and Forecast to 2028 (US$ Million)
11.1.1.2.1 China: Directed Energy Weapons Market, by Platforms
11.1.1.2.2 China: Directed Energy Weapons Market, by Range
11.1.1.2.3 China: Directed Energy Weapons Market, by Technology
11.1.1.2.3.1 China: Directed Energy Weapons Market, by Laser
11.1.1.2.4 China: Directed Energy Weapons Market, by Application
11.1.1.3 India: Directed Energy Weapons Market – Revenue and Forecast to 2028 (US$ Million)
11.1.1.3.1 India: Directed Energy Weapons Market, by Platforms
11.1.1.3.2 India: Directed Energy Weapons Market, by Range
11.1.1.3.3 India: Directed Energy Weapons Market, by Technology
11.1.1.3.3.1 India: Directed Energy Weapons Market, by Laser
11.1.1.3.4 India: Directed Energy Weapons Market, by Application
11.1.1.4 Japan: Directed Energy Weapons Market – Revenue and Forecast to 2028 (US$ Million)
11.1.1.4.1 Japan: Directed Energy Weapons Market, by Platforms
11.1.1.4.2 Japan: Directed Energy Weapons Market, by Range
11.1.1.4.3 Japan: Directed Energy Weapons Market, by Technology
11.1.1.4.3.1 Japan: Directed Energy Weapons Market, by Laser
11.1.1.4.4 Japan: Directed Energy Weapons Market, by Application
11.1.1.5 South Korea: Directed Energy Weapons Market – Revenue and Forecast to 2028 (US$ Million)
11.1.1.5.1 South Korea: Directed Energy Weapons Market, by Platforms
11.1.1.5.2 South Korea: Directed Energy Weapons Market, by Range
11.1.1.5.3 South Korea: Directed Energy Weapons Market, by Technology
11.1.1.5.3.1 South Korea: Directed Energy Weapons Market, by Laser
11.1.1.5.4 South Korea: Directed Energy Weapons Market, by Application
11.1.1.6 Rest of APAC: Directed Energy Weapons Market – Revenue and Forecast to 2028 (US$ Million)
11.1.1.6.1 Rest of APAC: Directed Energy Weapons Market, by Platforms
11.1.1.6.2 Rest of APAC: Directed Energy Weapons Market, by Range
11.1.1.6.3 Rest of APAC: Directed Energy Weapons Market, by Technology
11.1.1.6.3.1 Rest of APAC: Directed Energy Weapons Market, by Laser
11.1.1.6.4 Rest of APAC: Directed Energy Weapons Market, by Application
12. Industry Landscape
12.1 Overview
12.2 Market Initiative
12.3 Merger and Acquisition
12.4 New Development
13. Company Profiles
13.1 Lockheed Martin Corporation
13.1.1 Key Facts
13.1.2 Business Description
13.1.3 Products and Services
13.1.4 Financial Overview
13.1.5 SWOT Analysis
13.1.6 Key Developments
13.2 Thales Group
13.2.1 Key Facts
13.2.2 Business Description
13.2.3 Products and Services
13.2.4 Financial Overview
13.2.5 SWOT Analysis
13.2.6 Key Developments
13.3 L3Harris Technologies, Inc.
13.3.1 Key Facts
13.3.2 Business Description
13.3.3 Products and Services
13.3.4 Financial Overview
13.3.5 SWOT Analysis
13.3.6 Key Developments
13.4 Elbit Systems Ltd.
13.4.1 Key Facts
13.4.2 Business Description
13.4.3 Products and Services
13.4.4 Financial Overview
13.4.5 SWOT Analysis
13.4.6 Key Developments
13.5 Raytheon Technologies Corporation
13.5.1 Key Facts
13.5.2 Business Description
13.5.3 Products and Services
13.5.4 Financial Overview
13.5.5 SWOT Analysis
13.5.6 Key Developments
13.6 BAE Systems
13.6.1 Key Facts
13.6.2 Business Description
13.6.3 Products and Services
13.6.4 Financial Overview
13.6.5 SWOT Analysis
13.6.6 Key Developments
13.7 Honeywell International Inc.
13.7.1 Key Facts
13.7.2 Business Description
13.7.3 Products and Services
13.7.4 Financial Overview
13.7.5 SWOT Analysis
13.7.6 Key Developments
13.8 Rheinmetall AG
13.8.1 Key Facts
13.8.2 Business Description
13.8.3 Products and Services
13.8.4 Financial Overview
13.8.5 SWOT Analysis
13.8.6 Key Developments
13.9 Moog Inc.
13.9.1 Key Facts
13.9.2 Business Description
13.9.3 Products and Services
13.9.4 Financial Overview
13.9.5 SWOT Analysis
13.9.6 Key Developments
13.10 Boeing
13.10.1 Key Facts
13.10.2 Business Description
13.10.3 Products and Services
13.10.4 Financial Overview
13.10.5 SWOT Analysis
13.10.6 Key Developments
14. Appendix
14.1 About The Insight Partners
14.2 Word Index
LIST OF TABLES
Table 1. Asia Pacific Directed Energy Weapons Market, Revenue and Forecast, 2019–2028 (US$ Million)
Table 2. Australia: Directed Energy Weapons Market, by Platforms– Revenue and Forecast to 2028 (US$ Million)
Table 3. Australia: Directed Energy Weapons Market, by Range– Revenue and Forecast to 2028 (US$ Million)
Table 4. Australia: Directed Energy Weapons Market, by Technology –Revenue and Forecast to 2028 (US$ Million)
Table 5. Australia: Directed Energy Weapons Market, by Laser–Revenue and Forecast to 2028 (US$ Million)
Table 6. Australia: Directed Energy Weapons Market, by Application–Revenue and Forecast to 2028 (US$ Million)
Table 7. China: Directed Energy Weapons Market, by Platforms– Revenue and Forecast to 2028 (US$ Million)
Table 8. China: Directed Energy Weapons Market, by Range– Revenue and Forecast to 2028 (US$ Million)
Table 9. China: Directed Energy Weapons Market, by Technology –Revenue and Forecast to 2028 (US$ Million)
Table 10. China: Directed Energy Weapons Market, by Laser–Revenue and Forecast to 2028 (US$ Million)
Table 11. China: Directed Energy Weapons Market, by Application–Revenue and Forecast to 2028 (US$ Million)
Table 12. India: Directed Energy Weapons Market, by Platforms– Revenue and Forecast to 2028 (US$ Million)
Table 13. India: Directed Energy Weapons Market, by Range– Revenue and Forecast to 2028 (US$ Million)
Table 14. India: Directed Energy Weapons Market, by Technology –Revenue and Forecast to 2028 (US$ Million)
Table 15. India: Directed Energy Weapons Market, by Laser–Revenue and Forecast to 2028 (US$ Million)
Table 16. India: Directed Energy Weapons Market, by Application–Revenue and Forecast to 2028 (US$ Million)
Table 17. Japan: Directed Energy Weapons Market, by Platforms– Revenue and Forecast to 2028 (US$ Million)
Table 18. Japan: Directed Energy Weapons Market, by Range– Revenue and Forecast to 2028 (US$ Million)
Table 19. Japan: Directed Energy Weapons Market, by Technology –Revenue and Forecast to 2028 (US$ Million)
Table 20. Japan: Directed Energy Weapons Market, by Laser–Revenue and Forecast to 2028 (US$ Million)
Table 21. Japan: Directed Energy Weapons Market, by Application–Revenue and Forecast to 2028 (US$ Million)
Table 22. South Korea: Directed Energy Weapons Market, by Platforms– Revenue and Forecast to 2028 (US$ Million)
Table 23. South Korea: Directed Energy Weapons Market, by Range – Revenue and Forecast to 2028 (US$ Million)
Table 24. South Korea: Directed Energy Weapons Market, by Technology –Revenue and Forecast to 2028 (US$ Million)
Table 25. South Korea: Directed Energy Weapons Market, by Laser–Revenue and Forecast to 2028 (US$ Million)
Table 26. South Korea: Directed Energy Weapons Market, by Application–Revenue and Forecast to 2028 (US$ Million)
Table 27. Rest of APAC: Directed Energy Weapons Market, by Platforms – Revenue and Forecast to 2028 (US$ Million)
Table 28. Rest of APAC: Directed Energy Weapons Market, by Range– Revenue and Forecast to 2028 (US$ Million)
Table 29. Rest of APAC: Directed Energy Weapons Market, by Technology –Revenue and Forecast to 2028 (US$ Million)
Table 30. Rest of APAC: Directed Energy Weapons Market, by Laser–Revenue and Forecast to 2028 (US$ Million)
Table 31. Rest of APAC: Directed Energy Weapons Market, by Application–Revenue and Forecast to 2028 (US$ Million)
Table 32. List of Abbreviation
LIST OF FIGURES
Figure 1. Asia Pacific Directed Energy Weapons Market Segmentation
Figure 2. Asia Pacific Directed Energy Weapons Segmentation – Country
Figure 3. Asia Pacific Directed Energy Weapons Market Overview
Figure 4. Asia Pacific Directed Energy Weapons Market, By Technology
Figure 5. Asia Pacific Directed Energy Weapons Market, By Country
Figure 6. Asia Pacific Directed Energy Weapons Market– Porter’s Five Forces Analysis
Figure 7. Asia Pacific Directed Energy Weapons Market- Ecosystem Analysis
Figure 8. Expert Opinion
Figure 9. Asia Pacific Directed Energy Weapons Market: Impact Analysis of Drivers and Restraints
Figure 10. Asia Pacific Directed Energy Weapons Market, Forecast and Analysis (US$ Million)
Figure 11. Asia Pacific Directed Energy Weapons Market Revenue Share, by Technology (2021 and 2028)
Figure 12. Laser: Directed Energy Weapons Market – Revenue and Forecast to 2028 (US$ Million)
Figure 13. High Energy: Directed Energy Weapons Market – Revenue and Forecast to 2028 (US$ Million)
Figure 14. Low Energy: Directed Energy Weapons Market – Revenue and Forecast to 2028 (US$ Million)
Figure 15. Microwave: Directed Energy Weapons Market – Revenue and Forecast to 2028 (US$ Million)
Figure 16. Particle Beam: Directed Energy Weapons Market – Revenue and Forecast to 2028 (US$ Million)
Figure 17. Others: Directed Energy Weapons Market – Revenue and Forecast to 2028 (US$ Million)
Figure 18. Asia Pacific Directed Energy Weapons Market Revenue Share, by Range (2021 and 2028)
Figure 19. Less than 1 Mile: Directed Energy Weapons Market – Revenue and Forecast to 2028 (US$ Million)
Figure 20. More than 1 Mile: Directed Energy Weapons Market – Revenue and Forecast to 2028 (US$ Million)
Figure 21. Asia Pacific Directed Energy Weapons Market Revenue Share, by Application (2021 and 2028)
Figure 22. Ground: Directed Energy Weapons Market – Revenue and Forecast to 2028 (US$ Million)
Figure 23. Naval: Directed Energy Weapons Market – Revenue and Forecast to 2028 (US$ Million)
Figure 24. Airborne: Directed Energy Weapons Market – Revenue and Forecast to 2028 (US$ Million)
Figure 25. Asia Pacific Directed Energy Weapons Market Revenue Share, by Platforms (2021 and 2028)
Figure 26. Armored Vehicles: Directed Energy Weapons Market – Revenue and Forecast to 2028 (US$ Million)
Figure 27. Unmanned Systems: Directed Energy Weapons Market – Revenue and Forecast to 2028 (US$ Million)
Figure 28. Handheld Systems: Directed Energy Weapons Market – Revenue and Forecast to 2028 (US$ Million)
Figure 29. Aircraft Systems: Directed Energy Weapons Market – Revenue and Forecast to 2028 (US$ Million)
Figure 30. Ships and Submarines: Directed Energy Weapons Market – Revenue and Forecast to 2028 (US$ Million)
Figure 31. Others: Directed Energy Weapons Market – Revenue and Forecast to 2028 (US$ Million)
Figure 32. Geographic Overview of Asia Pacific Directed Energy Weapons Market
Figure 33. Asia Pacific Directed Energy Weapons Market Revenue Share, by Key Country (2021 and 2028)
Figure 34. Australia: Directed Energy Weapons Market – Revenue and Forecast to 2028 (US$ Million)
Figure 35. China: Directed Energy Weapons Market – Revenue and Forecast to 2028 (US$ Million)
Figure 36. India: Directed Energy Weapons Market – Revenue and Forecast to 2028 (US$ Million)
Figure 37. Japan: Directed Energy Weapons Market – Revenue and Forecast to 2028 (US$ Million)
Figure 38. South Korea: Directed energy weapons market – Revenue and Forecast to 2028 (US$ Million)
Figure 39. Rest of APAC: Directed Energy Weapons Market – Revenue and Forecast to 2028 (US$ Million)
- Lockheed Martin Corporation
- Thales Group
- L3Harris Technologies, Inc.
- Elbit Systems Ltd.
- Raytheon Technologies Corporation
- BAE Systems
- Honeywell International Inc.
- Rheinmetall AG
- Moog Inc.
- Boeing
- Save and reduce time carrying out entry-level research by identifying the growth, size, leading players and segments in the Asia Pacific directed energy weapons market.
- Highlights key business priorities in order to assist companies to realign their business strategies
- The key findings and recommendations highlight crucial progressive industry trends in the Asia Pacific directed energy weapons market, thereby allowing players across the value chain to develop effective long-term strategies
- Develop/modify business expansion plans by using substantial growth offering developed and emerging markets
- Scrutinize in-depth Asia Pacific market trends and outlook coupled with the factors driving the directed energy weapons market, as well as those hindering it
- Enhance the decision-making process by understanding the strategies that underpin commercial interest with respect to client products, segmentation, pricing, and distribution