Analysis - by Scale (Lab-Scale Production, Pilot-Scale Production, and Full-Scale Production), Application (Microbial Application, Cell Culture Application, and Others), Technology (Fed-Batch Bioreactors and Perfusion Bioreactors), and End User (Biopharma Manufacturers, Research and Development Organizations, and Contract Manufacturing Organization)
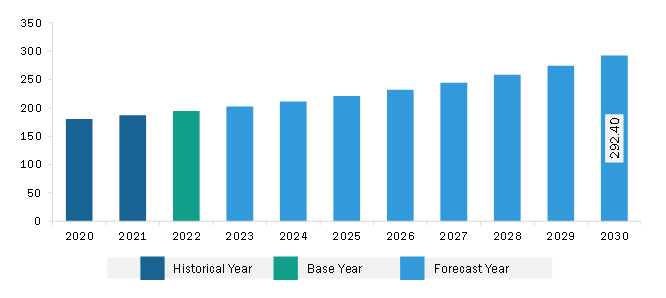
The Middle East & Africa bioreactors market was valued at US$ 194.58 million in 2022 and is expected to reach US$ 292.40 million by 2030; it is estimated to record a CAGR of 5.2% from 2022 to 2030.
Increasing Adoption of Single-Use Bioreactors Bolsters Middle East & Africa Bioreactors Market
Various manufacturers are developing single-use bioreactors (SUBs) as they are robust and provide the high performance required for commercial manufacturing of biopharmaceuticals. Advantages such as film technologies, stirring mechanisms, bioreactor designs, and sensor systems have contributed toward increasing the adoption of disposable reactors from the lab to the production scale. The single-use bioreactors provide next-generation cell and gene therapies and continuous bioprocessing. The advancements in cell-culture processes have developed higher titers and cell densities, which have facilitated the adoption of SUBs.
Single-use bioreactors reduce the risks of contamination and decrease production turnaround times. In the last few years, the use of single-use bioreactors has increased in modern biopharmaceutical processes owing to their unique ability to enhance flexibility, reduce investment, and limit operational costs. Also, many companies have developed single-use bioreactors for producing a wide range of therapeutics. For instance, in March 2021, Thermo Fischer Scientific launched the 3,000 L and 5,000 L HyPerforma DynaDrive single-use bioreactors.
The reduction in validation time has been one of the essential benefits of single-use bioreactors. The rising adoption of single-use bioreactors for upstream bioprocessing is driving the market growth. For instance, Sartorius AG offers a wide range of single-use bioreactors. The company provides ambr 15 for a 10-15 mL micro bioreactor scale and Biostat STR for 50-2000L. The increasing acceptance of single-use bioreactors for the production of therapeutics is driving the market for bioreactors.
Middle East & Africa Bioreactors Market Overview
In Saudi Arabia, the bioreactors market is driven by a rising number of startup companies and increasing awareness about research and developments happening in the country for the enhancement of research activities. Research and technology are significantly governed by an increasing number of research projects undertaken by institutes such as King Abdullah University of Science and Technology. Well-developed research centers focus on increasing research studies for the treatment of various diseases, which in turn would increase the development of new treatment methods and hence also fuel the market growth. For instance, a study, "Chimeric antigen receptor structure and manufacturing of clinical grade CAR engineered cells using different bioreactors," was conducted in 2022 under the Stem Cell & Tissue Re-engineering Program in King Faisal Specialist Hospital & Research Centre, Kingdom of Saudi Arabia.
In Saudi Arabia, government initiatives are responsible for private sector involvement in healthcare expansion and investment. The developed healthcare expenditure and increasing government initiatives in Saudi Arabia are influencing the growth of the bioreactors market.
Middle East & Africa Bioreactors Market Revenue and Forecast to 2030 (US$ Million)
Middle East & Africa Bioreactors Market Segmentation
The Middle East & Africa bioreactors market is segmented based on scale, application, technology, end user, and country. Based on scale, the Middle East & Africa bioreactors market is segmented into lab-scale production, pilot-scale production, and full-scale production. The pilot-scale production segment held the largest market share in 2022.
In terms of application, the Middle East & Africa bioreactors market is categorized into microbial application, cell culture application, and others. The cell culture application segment held the largest market share in 2022.
By technology, the Middle East & Africa bioreactors market is bifurcated into fed-batch bioreactors and perfusion bioreactors. The fed-batch bioreactors segment held a larger market share in 2022.
Based on end user, the Middle East & Africa bioreactors market is categorized into biopharma manufacturers, research and development organizations, and contract manufacturing organization. The research and development organizations segment held the largest market share in 2022.
Based on country, the Middle East & Africa bioreactors market is segmented into Saudi Arabia, South Africa, the UAE, and the Rest of Middle East & Africa. Saudi Arabia dominated the Middle East & Africa bioreactors market share in 2022.
Applikon Biotechnology BV, General Electric Co, Merck KGaA, Pall Corp, PBS Biotech Inc, Sartorius AG, Solaris Biotechnology SRL, and Thermo Fisher Scientific Inc are some of the leading players operating in the Middle East & Africa bioreactors market.
Middle East & Africa Bioreactors Market Strategic Insights
Get more information on this report
Middle East & Africa Bioreactors Market Segmentation Analysis
Middle East & Africa Bioreactors Market Report Highlights
Middle East & Africa Bioreactors Report Scope
Report Attribute
Details
Market size in 2022
US$ 194.58 Million
Market Size by 2030
US$ 292.40 Million
CAGR (2022 - 2030)
5.2%
Historical Data
2020-2021
Forecast period
2023-2030
Segments Covered
By Scale
Lab-Scale Production
Pilot-Scale Production
Full-Scale Production
By Application
Microbial Application
Cell Culture Application
By Technology
Fed-Batch Bioreactors
Perfusion Bioreactors
By End User
Biopharma Manufacturers
Research and Development Organizations
Contract Manufacturing Organization
Regions and Countries Covered
Middle East and Africa
South Africa, Saudi Arabia, UAE, Rest of Middle East and Africa
Market leaders and key company profiles
Thermo Fisher Scientific Inc
General Electric Co
Merck KGaA
Pall Corp
PBS Biotech Inc
Sartorius AG
Solaris Biotechnology SRL
Get more information on this report
Middle East & Africa Bioreactors Market Country and Regional Insights
Get more information on this report
Identical Market Reports with other Region/Countries
The List of Companies - Middle East & Africa Bioreactors Market
1. Thermo Fisher Scientific Inc2. General Electric Co3. Merck KGaA4. Pall Corp5. PBS Biotech Inc6. Sartorius AG7. Solaris Biotechnology SRL
Frequently Asked Questions
How big is the Middle East & Africa Bioreactors Market?
The Middle East & Africa Bioreactors Market is valued at US$ 194.58 Million in 2022, it is projected to reach US$ 292.40 Million by 2030.
What is the CAGR for Middle East & Africa Bioreactors Market by (2022 - 2030)?
As per our report Middle East & Africa Bioreactors Market, the market size is valued at US$ 194.58 Million in 2022, projecting it to reach US$ 292.40 Million by 2030. This translates to a CAGR of approximately 5.2% during the forecast period.
What segments are covered in this report?
The Middle East & Africa Bioreactors Market report typically cover these key segments-
End User (Biopharma Manufacturers, Research and Development Organizations, Contract Manufacturing Organization)
What is the historic period, base year, and forecast period taken for Middle East & Africa Bioreactors Market?
The historic period, base year, and forecast period can vary slightly depending on the specific market research report. However, for the Middle East & Africa Bioreactors Market report:
Historic Period : 2020-2021
Base Year : 2022
Forecast Period : 2023-2030
Who are the major players in Middle East & Africa Bioreactors Market?
The Middle East & Africa Bioreactors Market is populated by several key players, each contributing to its growth and innovation. Some of the major players include:
Thermo Fisher Scientific Inc
General Electric Co
Merck KGaA
Pall Corp
PBS Biotech Inc
Sartorius AG
Solaris Biotechnology SRL
Who should buy this report?
The Middle East & Africa Bioreactors Market report is valuable for diverse stakeholders, including:
Investors: Provides insights for investment decisions pertaining to market growth, companies, or industry insights. Helps assess market attractiveness and potential returns.
Industry Players: Offers competitive intelligence, market sizing, and trend analysis to inform strategic planning, product development, and sales strategies.
Suppliers and Manufacturers: Helps understand market demand for components, materials, and services related to concerned industry.
Researchers and Consultants: Provides data and analysis for academic research, consulting projects, and market studies.
Financial Institutions: Helps assess risks and opportunities associated with financing or investing in the concerned market.
Essentially, anyone involved in or considering involvement in the Middle East & Africa Bioreactors Market value chain can benefit from the information contained in a comprehensive market report.


 Get Free Sample For Middle East & Africa Bioreactors Market


