Analysis - by Type (Forklifts, Aisle Trucks, Tow Tractors, Container Handlers, and Others), Drive Type (Internal Combustion Engine, Battery-Operated, and Gas-Powered), Level of Autonomy (Non/Semi-autonomous and Autonomous), and Application (Manufacturing, Warehousing, and Others)
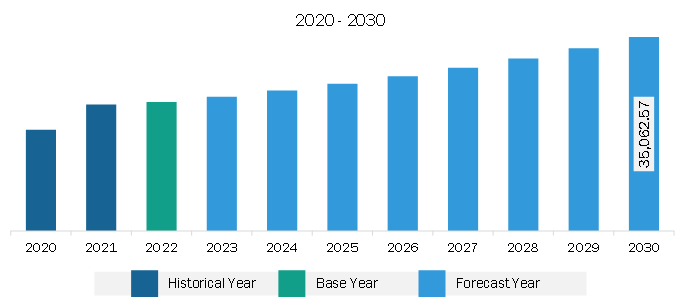
The Asia Pacific industrial vehicles market was valued at US$ 23,323.8 million in 2022 and is expected to reach US$ 35,062.6 million by 2030; it is estimated to register at a CAGR of 5.2% from 2022 to 2030.
Efficient, Safe, and Cost-effective Industrial Vehicles Boost Asia Pacific Industrial Vehicles Market
The integration of autonomous industrial vehicles such as autonomous industrial vehicles (IVs) represents a transformative phase in the industrial vehicle market, fueled by improved efficiency, reduced maintenance costs, and enhanced safety records. Autonomous industrial vehicles, operating within geofenced topographies and adhering to specific rules, address one of the persistent challenges in industrial vehicle operations-wear and tear. Unlike human operators, whose driving habits can vary significantly, autonomous vehicles follow prescribed actions, minimizing the potential for routing errors, reducing wear on critical components, and improving the overall asset lifetime. Komatsu, a key player in this space, reports that its autonomous solutions has the potential to improve tire and brake life by up to 40%-which can lead to the widespread adoption of autonomous technology. Similarly, Telematics, a crucial component of autonomous trucks, relies on internet-connected sensors to monitor vehicle performance in real time. This constant feedback loop allows for proactive adjustments, ensuring that vehicles operate at optimal levels. By leveraging telematics, industrial vehicles can experience a significant reduction in error and unnecessary movement, potentially extending their lifespan by up to 50%. This not only promotes sustainability but also presents a compelling economic case for companies looking to maximize the return on their industrial vehicle investments.
The implementation of autonomous industrial vehicles in real-world applications continues to be successful. Resolute Mining's debut of the world's first fully autonomous underground gold mine in 2019 showcased the broader applicability of autonomous technology. By employing a completely autonomous operations, Resolute Mining achieved a substantial reduction in the mine's total cost of gold production-US$ 135 per ounce-and reduced operating expenses by 30%. These outcomes highlight the transformative potential of autonomous technology in optimizing operational efficiency and cost-effectiveness.
Thus, various industries are witnessing potential for extended asset lifetimes, improved safety records, and significant cost savings, which are likely to present lucrative opportunities for manufacturers and stakeholders operating in the industrial vehicle market during the forecast period.
Asia Pacific Industrial Vehicles Market Overview
The rising demand for the material handling equipment and vehicles around the globe across the manufacturing sector drives the Asia Pacific industrial vehicles market growth. According to the World Industrial Vehicle Statistics Association (WITS), more than 2.34 million material-handling vehicles and equipment sales were recorded during 2021. The material handling industry saw a 43.0% increase in orders in 2021 compared to the previous year, 2020. Among the 2.34 million material handling units, around 68.8%, that is 1.61 million units, were recorded as electric-powered forklifts. Electric forklift demand is increasing at a rapid pace with a surge in consumer popularity. With a surge in the number of orders, the demand for industrial vehicles such as forklifts, aisle trucks, and pallet trucks has increased.
Asia Pacific Industrial Vehicles Market Revenue and Forecast to 2030 (US$ Million)
Asia Pacific Industrial Vehicles Market Segmentation
The Asia Pacific industrial vehicles market is segmented based on type, drive type, level of autonomy, application, and country.
Based on type, the Asia Pacific industrial vehicles market is segmented into forklifts, aisle trucks, tow tractors, container handlers, and others. The forklifts segment held the largest share in 2022.
In terms of drive type, the Asia Pacific industrial vehicles market is segmented into internal combustion engine, battery-operated, and gas-powered. The battery-operated segment held the largest share in 2022.
By level of autonomy, the Asia Pacific industrial vehicles market is bifurcated into non/semi-autonomous and autonomous. The non/semi-autonomous segment held a larger share in 2022.
Based on application, the Asia Pacific industrial vehicles market is segmented into manufacturing, warehousing, and others. The manufacturing segment held the largest share in 2022.
Based on country, the Asia Pacific industrial vehicles market is categorized into Australia, China, India, Japan, South Korea, and the Rest of Asia Pacific. China dominated the Asia Pacific industrial vehicles market in 2022.
Kion Group AG, Toyota Industries Corp, Mitsubishi Heavy Industries Ltd, Komatsu Ltd, Hyster-Yale Materials Handling Inc, Jungheinrich AG, Crown Equipment Corp, Konecranes Plc, and Anhui Heli Co Ltd are some of the leading companies operating in the Asia Pacific industrial vehicles market.
Asia Pacific Industrial Vehicles Market Strategic Insights
Get more information on this report
Asia Pacific Industrial Vehicles Market Segmentation Analysis
Asia Pacific Industrial Vehicles Market Report Highlights
Asia Pacific Industrial Vehicles Report Scope
Report Attribute
Details
Market size in 2022
US$ 23,323.8 Million
Market Size by 2030
US$ 35,062.6 Million
CAGR (2022 - 2030)
5.2%
Historical Data
2020-2021
Forecast period
2023-2030
Segments Covered
By Type
Forklifts
Aisle Trucks
Tow Tractors
Container Handlers
By Drive Type
Internal Combustion Engine
Battery-Operated
Gas-Powered
By Application
Manufacturing
Warehousing
Regions and Countries Covered
Asia-Pacific
China, India, Japan, Australia, Rest of Asia-Pacific
Market leaders and key company profiles
Kion Group AG
Toyota Industries Corp
Mitsubishi Heavy Industries Ltd
Komatsu Ltd
Hyster-Yale Materials Handling Inc
Jungheinrich AG
Crown Equipment Corp
Konecranes Plc
Anhui Heli Co Ltd
Get more information on this report
Asia Pacific Industrial Vehicles Market Country and Regional Insights
Get more information on this report
Identical Market Reports with other Region/Countries
The List of Companies - Asia Pacific Industrial Vehicles Market
1. Kion Group AG2. Toyota Industries Corp3. Mitsubishi Heavy Industries Ltd4. Komatsu Ltd5. Hyster-Yale Materials Handling Inc6. Jungheinrich AG7. Crown Equipment Corp8. Konecranes Plc9. Anhui Heli Co Ltd
Frequently Asked Questions
How big is the Asia Pacific Industrial Vehicles Market?
The Asia Pacific Industrial Vehicles Market is valued at US$ 23,323.8 Million in 2022, it is projected to reach US$ 35,062.6 Million by 2030.
What is the CAGR for Asia Pacific Industrial Vehicles Market by (2022 - 2030)?
As per our report Asia Pacific Industrial Vehicles Market, the market size is valued at US$ 23,323.8 Million in 2022, projecting it to reach US$ 35,062.6 Million by 2030. This translates to a CAGR of approximately 5.2% during the forecast period.
What segments are covered in this report?
The Asia Pacific Industrial Vehicles Market report typically cover these key segments-
Type (Forklifts, Aisle Trucks, Tow Tractors, Container Handlers)
Drive Type (Internal Combustion Engine, Battery-Operated, Gas-Powered)
Application (Manufacturing, Warehousing)
What is the historic period, base year, and forecast period taken for Asia Pacific Industrial Vehicles Market?
The historic period, base year, and forecast period can vary slightly depending on the specific market research report. However, for the Asia Pacific Industrial Vehicles Market report:
Historic Period : 2020-2021
Base Year : 2022
Forecast Period : 2023-2030
Who are the major players in Asia Pacific Industrial Vehicles Market?
The Asia Pacific Industrial Vehicles Market is populated by several key players, each contributing to its growth and innovation. Some of the major players include:
Kion Group AG
Toyota Industries Corp
Mitsubishi Heavy Industries Ltd
Komatsu Ltd
Hyster-Yale Materials Handling Inc
Jungheinrich AG
Crown Equipment Corp
Konecranes Plc
Anhui Heli Co Ltd
Who should buy this report?
The Asia Pacific Industrial Vehicles Market report is valuable for diverse stakeholders, including:
Investors: Provides insights for investment decisions pertaining to market growth, companies, or industry insights. Helps assess market attractiveness and potential returns.
Industry Players: Offers competitive intelligence, market sizing, and trend analysis to inform strategic planning, product development, and sales strategies.
Suppliers and Manufacturers: Helps understand market demand for components, materials, and services related to concerned industry.
Researchers and Consultants: Provides data and analysis for academic research, consulting projects, and market studies.
Financial Institutions: Helps assess risks and opportunities associated with financing or investing in the concerned market.
Essentially, anyone involved in or considering involvement in the Asia Pacific Industrial Vehicles Market value chain can benefit from the information contained in a comprehensive market report.


 Get Free Sample For Asia Pacific Industrial Vehicles Market


