Analysis – by Component (Hardware, Software, and Services), Payment System (Open Payment System, Smart Card, and NFC), and End User (Transportation, Sport and Entertainment, Parking, and Others)
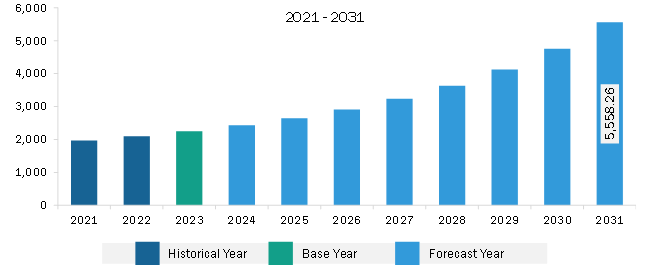
The North America smart ticketing market was valued at US$ 2,248.30 million in 2023 and is expected to reach US$ 5,558.26 million by 2031; it is estimated to record a CAGR of 12.0% from 2023 to 2031.
Rising Demand for Digital Payments in Public Transport Fuels North America Smart Ticketing Market
Modern cities offer a variety of transportation options, such as buses, trains, and metros. Each public transportation system has its own ticketing system. Managing multiple smart cards or applications for different modes of transportation might be overwhelming for commuters. A centralized method is necessary to combine all transportation networks. In this direction, the public transport infrastructure across the world is being upgraded. The upgrades also aim at improving the commuter experience via a seamless payment interface. For instance, in 2024, Indra was awarded a US$ 16 million contract to renovate the ticket vending machines for Bi-State Development, the interstate public agency that runs the public transportation services in the St. Louis metropolitan area, and MetroLink, the US light rail network in Missouri and Illinois. The contract covers the design, production, and delivery of brand-new, cutting-edge vending machines for the 38 St. Louis Metro network stations. These machines will replace the ones that are currently in use and were previously delivered by Indra between 2006 and 2012. Indra will also be in charge of maintaining the machines and putting in place a cloud-based management system to track and manage them. As cities evolve into smart, connected, and digital-first environments, digital payments for public transportation services will remain at the forefront of the agenda, thereby driving the smart ticketing market growth.
North America Smart Ticketing Market Overview
The North America smart ticketing market is experiencing significant growth owing to the advancements in smart card technology utilized in smart ticketing systems. Contactless solutions facilitated by smartphones and cutting-edge wearable devices are gaining significant traction, as these solutions help optimize time and curb friction at physical ticket counters with flexible payment options. Prominent smart wearable manufacturers, such as Samsung, have introduced payment capabilities in their smartwatches. Additionally, most device manufacturers are integrating payment services, including Samsung Pay, Fitbit Pay, Apple Pay, Garmin Pay, and Google Pay, into their mobile wallet offerings. While smartwatch-enabled payments are still in the developmental phase, they hold significant market potential. These developments are projected to empower consumers to purchase tickets using their wearable devices, reflecting a notable shift in the ticketing landscape. Additionally, initiatives taken by the key smart ticketing market players, such as Cubic Corporation, positively favor the market.
For instance, in May 2023, Infineon's CALYPSO move facilitated the development of interoperable ticketing solutions that adhere to open standards, empowering manufacturers to tailor solutions for the unique needs of transport operators and authorities. This approach eliminates the reliance on magnetic stripes, barcodes, and proprietary tickets, ensuring greater flexibility and compatibility across diverse systems. This development represents a major step forward in modernizing and expanding the contactless ticketing system across the state, with plans for full deployment across the entire passenger rail system, followed by buses and ferries.
North America Smart Ticketing Market Revenue and Forecast to 2031 (US$ Million)
North America Smart Ticketing Market Segmentation
The North America smart ticketing market is categorized into component, payment system, end user, and country.
Based on component, the North America smart ticketing market is segmented into hardware, software, and services. The hardware segment held the largest market share in 2023.
By payment system, the North America smart ticketing market is segmented into open payment system, smart card, and NFC. The smart card segment held the largest market share in 2023.
Based on end user, the North America smart ticketing market is segmented into transportation, sport and entertainment, parking, and others. The transportation segment held the largest market share in 2023.
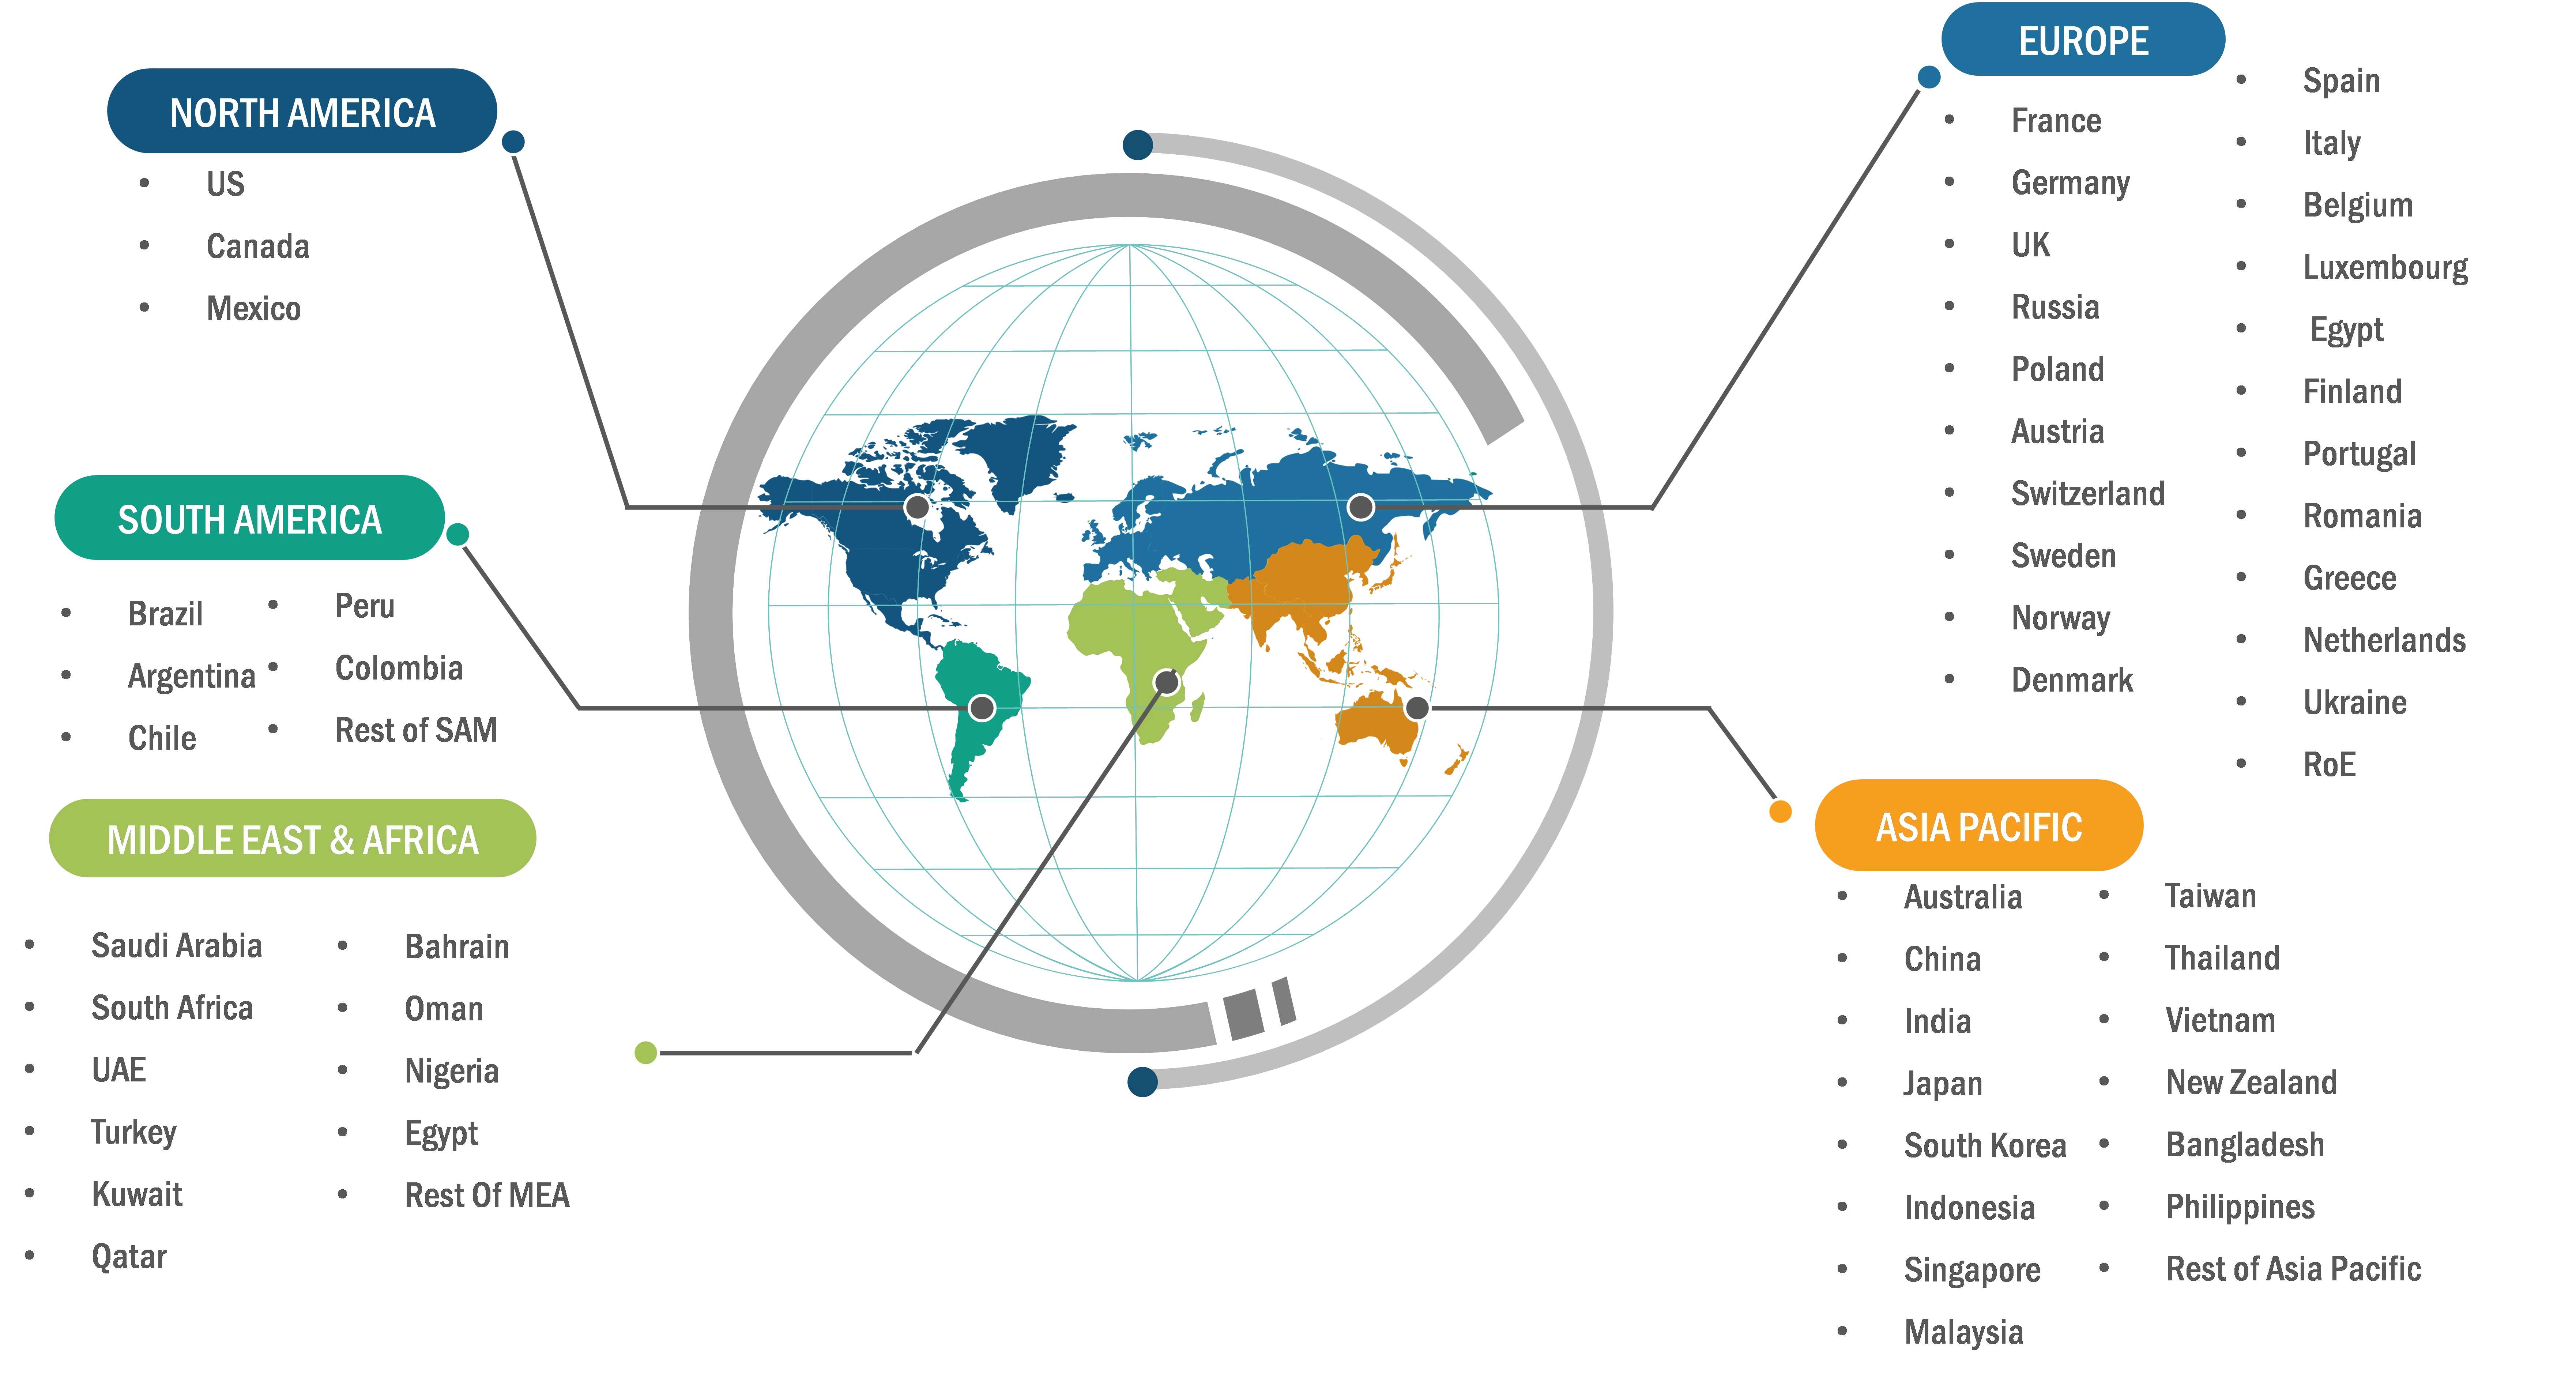
By country, the North America smart ticketing market is segmented into the US, Canada, and Mexico. The US dominated the North America smart ticketing market share in 2023.
Infineon Technologies AG, NXP Semiconductors NV, Xerox Holdings Corp, Cubic Corp, IDEMIA France SAS, Thales SA, Confidex, HID Global Corp, and Siemens Energy AG are some of the leading companies operating in the North America smart ticketing market.
North America Smart Ticketing Market Strategic Insights
Get more information on this report
North America Smart Ticketing Market Segmentation Analysis
North America Smart Ticketing Market Report Highlights
North America Smart Ticketing Report Scope
Report Attribute
Details
Market size in 2023
US$ 2,248.30 Million
Market Size by 2031
US$ 5,558.26 Million
CAGR (2023 - 2031)
12.0%
Historical Data
2021-2022
Forecast period
2024-2031
Segments Covered
By Component
Hardware
Software
Services
By Payment System
Open Payment System
Smart Card
NFC
By End User
Transportation
Sport and Entertainment
Parking
Regions and Countries Covered
North America
US, Canada, Mexico
Market leaders and key company profiles
Infineon Technologies AG.
NXP Semiconductors NV.
Xerox Holdings Corp.
Cubic Corp.
IDEMIA France SAS.
Thales SA.
Confidex.
HID Global Corp.
Siemens Energy AG.
Get more information on this report
North America Smart Ticketing Market Country and Regional Insights
Get more information on this report
Identical Market Reports with other Region/Countries
The List of Companies - North America Smart Ticketing Market
Infineon Technologies AG.NXP Semiconductors NV.Xerox Holdings Corp.Cubic Corp.IDEMIA France SAS.Thales SA. Confidex.HID Global Corp.Siemens Energy AG.
Frequently Asked Questions
How big is the North America Smart Ticketing Market?
The North America Smart Ticketing Market is valued at US$ 2,248.30 Million in 2023, it is projected to reach US$ 5,558.26 Million by 2031.
What is the CAGR for North America Smart Ticketing Market by (2023 - 2031)?
As per our report North America Smart Ticketing Market, the market size is valued at US$ 2,248.30 Million in 2023, projecting it to reach US$ 5,558.26 Million by 2031. This translates to a CAGR of approximately 12.0% during the forecast period.
What segments are covered in this report?
The North America Smart Ticketing Market report typically cover these key segments-
Component (Hardware, Software, Services)
Payment System (Open Payment System, Smart Card, NFC)
End User (Transportation, Sport and Entertainment, Parking)
What is the historic period, base year, and forecast period taken for North America Smart Ticketing Market?
The historic period, base year, and forecast period can vary slightly depending on the specific market research report. However, for the North America Smart Ticketing Market report:
Historic Period : 2021-2022
Base Year : 2023
Forecast Period : 2024-2031
Who are the major players in North America Smart Ticketing Market?
The North America Smart Ticketing Market is populated by several key players, each contributing to its growth and innovation. Some of the major players include:
Infineon Technologies AG.
NXP Semiconductors NV.
Xerox Holdings Corp.
Cubic Corp.
IDEMIA France SAS.
Thales SA.
Confidex.
HID Global Corp.
Siemens Energy AG.
Who should buy this report?
The North America Smart Ticketing Market report is valuable for diverse stakeholders, including:
Investors: Provides insights for investment decisions pertaining to market growth, companies, or industry insights. Helps assess market attractiveness and potential returns.
Industry Players: Offers competitive intelligence, market sizing, and trend analysis to inform strategic planning, product development, and sales strategies.
Suppliers and Manufacturers: Helps understand market demand for components, materials, and services related to concerned industry.
Researchers and Consultants: Provides data and analysis for academic research, consulting projects, and market studies.
Financial Institutions: Helps assess risks and opportunities associated with financing or investing in the concerned market.
Essentially, anyone involved in or considering involvement in the North America Smart Ticketing Market value chain can benefit from the information contained in a comprehensive market report.


 Get Free Sample For North America Smart Ticketing Market


