Analysis - by Source (Almond, Soy, Coconut, Oat, and Others), Type (Flavored and Plain), Nature (Organic and Conventional), and Distribution Channel (Supermarkets and Hypermarkets, Convenience Stores, Online Retail, and Others)
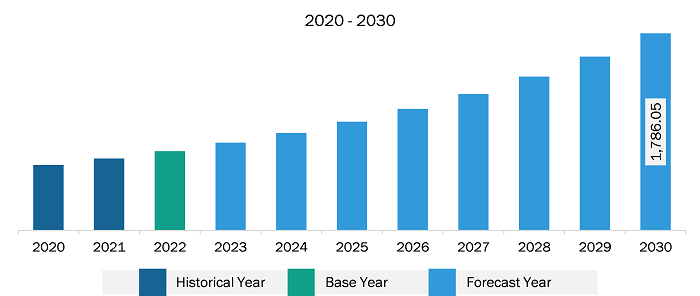
The North America non-dairy yogurt market was valued at US$ 718.55 million in 2022 and is expected to reach US$ 1,786.05 million by 2030; it is estimated to grow at a CAGR of 12.1% from 2022 to 2030.
Growing Trend of Veganism Due to Rising Environmental Concern Fuels the North America Non-Dairy Yogurt Market
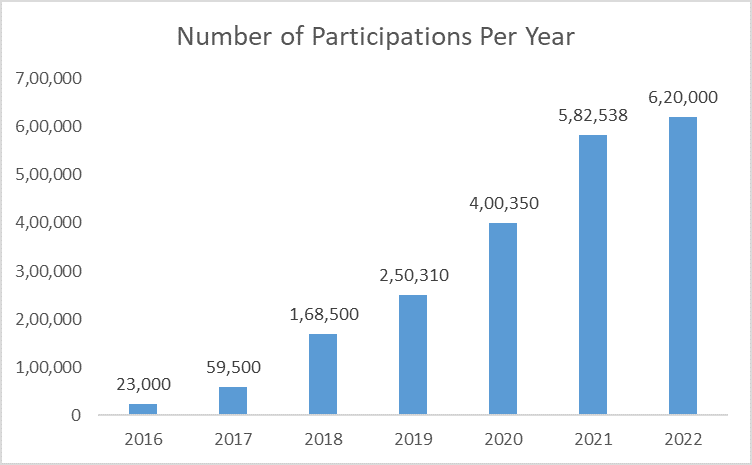
The vegan population has grown significantly over the past few years. According to Veganuary (a nonprofit organization that encourages individuals worldwide to become vegan for the entire month of January), in 2022, more than 620,000 people registered for the Veganuary campaign, and the registrations increased by 200% in the last three years.
The following figure shows the number of participants across the world in the ‘Veganuary Campaign’ from 2016 to 2022:
Registrations for Veganuary Campaign from 2016 to 2022
Source: Veganuary 2022 Campaign Review
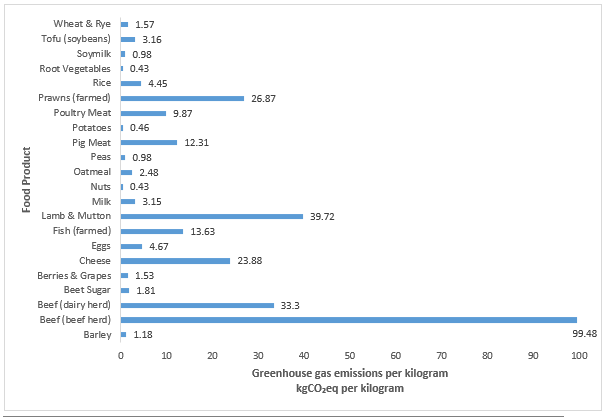
The livestock industry is one of the significant contributors to the total anthropogenic greenhouse gas emissions. According to the Food and Agriculture Organization (FAO), the global livestock industry emits 7.1 gigatons of carbon dioxide per year, accounting for 14.5% of all human-caused greenhouse gas emissions. The dairy sector is responsible for 30% of the total livestock emissions.
The following figure shows annual greenhouse gas emissions per kilogram of food products:
Annual Greenhouse Gas Emissions (GHG) Per Kilogram of Food Products
Source: Poore & Nemecek, 2018
As can be seen from the figure above, beef (beef herd), beef (dairy herd), and lamb and mutton products have the highest greenhouse gas emission. Many studies have shown that shifting to a vegan diet can significantly lower carbon dioxide emissions. Moreover, the United Nations, PETA, Good Food Institute, and many organizations believe that veganism can help save the planet from the climate crisis. Awareness regarding the harmful effects of the livestock industry on environment is increasing among consumers. The consumption of plant-based dairy products helps minimize carbon footprints, save water and other natural resources, and reduce the overall environmental impacts. Therefore, consumers are rapidly switching to plant-based dairy and meat products. Therefore, people are increasingly switching to a vegan diet due to rising sustainability and environmental concerns.
North America Non-Dairy Yogurt Market Overview
North America is one of the most significant regions for the non-dairy yogurt market due to the increasing number of individuals opting for healthier alternatives to dairy products. Increased disposable income, changing lifestyles, and eating patterns have increased demand for dairy substitutes such as non-dairy yogurt, cheese, butter, and milk in North American countries such as the US and Canada. Due to the increasing number of health-conscious consumers, rising environmental concerns, and the growing trend of plant-based diets, plant-based yogurt is becoming more popular in the region. The high nutritional value of plant-based yogurt has fueled its demand in North America in the last few years, especially among young adults. Moreover, the key players operating in the market are constantly taking strategic initiatives such as product innovation, which has pioneered the production of these products. For instance, in March 2022, the US-based company AYO Foods LLC launched a new plant-based yogurt range by developing a plain almond milk yogurt in various flavors.
According to the data from Cleveland Clinic, in 2019, 36% of Americans were lactose intolerant. This showcases that North Americans prefer to consume plant-based products, accelerating the demand for non-dairy products such as yogurt. Various government agencies, such as the United States Department of Agriculture (USDA), Food and Agriculture Organization (FAO), and US Food and Drug Administration (USFDA), are promoting the intake of dairy-free products in daily diets, enhancing the non-dairy yogurt market trends due to increasing symptoms and diseases related to lactose intolerance and nutrition deficiency. Moreover, the rising flexitarian population is a major factor boosting the demand for plant-based dairy products and is expected to propel the market growth in the region.
North America Non-Dairy Yogurt Market Revenue and Forecast to 2030 (US$ Million)
North America Non-Dairy Yogurt Market Segmentation
Based on source, the North America non-dairy yogurt market is segmented into almond, soy, coconut, oat, and others. The coconut segment held the largest share in 2022.
Based on type, the North America non-dairy yogurt market is bifurcated into flavored and plain. The flavored segment held a larger share in 2022.
Based on nature, the North America non-dairy yogurt market is bifurcated into organic and conventional. The conventional segment held a larger share in 2022.
Based on distribution channel, the North America non-dairy yogurt market is segmented into supermarkets & hypermarkets, convenience stores, online retail, and others. The supermarkets & hypermarkets segment held the largest share in 2022.
Based on country, the North America non-dairy yogurt market is categorized into US, Canada, and Mexico. The US dominated the North America non-dairy yogurt market in 2022.
The Hain Celestial Group Inc, Danone SA, Springfield Creamery Inc, Lyrical Foods Inc, Valio Ltd, Oatly, Group AB, Daiya Foods Inc, Forager Project LLC, and Harmless Harvest Inc are some of the leading companies operating in the North America non-dairy yogurt market.
North America Non-Dairy Yogurt Market Strategic Insights
Get more information on this report
North America Non-Dairy Yogurt Market Segmentation Analysis
North America Non-Dairy Yogurt Market Report Highlights
North America Non-Dairy Yogurt Report Scope
Report Attribute
Details
Market size in 2022
US$ 718.55 Million
Market Size by 2030
US$ 1,786.05 Million
CAGR (2022 - 2030)
12.1%
Historical Data
2020-2021
Forecast period
2023-2030
Segments Covered
By Source
Almond
Soy
Coconut
Oat
By Type
Flavored
Plain
By Nature
Organic
Conventional
By Distribution Channel
Supermarkets and Hypermarkets
Convenience Stores
Online Retail
Regions and Countries Covered
North America
US, Canada, Mexico
Market leaders and key company profiles
The Hain Celestial Group Inc
Danone SA
Springfield Creamery Inc
Lyrical Foods Inc
Valio Ltd
Oatly Group AB
Daiya Foods Inc
Forager Project LLC
Harmless Harvest Inc
Get more information on this report
North America Non-Dairy Yogurt Market Country and Regional Insights
Get more information on this report
Identical Market Reports with other Region/Countries
The List of Companies - North America Non-Dairy Yogurt Market
1. The Hain Celestial Group Inc 2. Danone SA 3. Springfield Creamery Inc 4. Lyrical Foods Inc 5. Valio Ltd 6. Oatly Group AB 7. Daiya Foods Inc 8. Forager Project LLC 9. Harmless Harvest Inc
Frequently Asked Questions
How big is the North America Non-Dairy Yogurt Market?
The North America Non-Dairy Yogurt Market is valued at US$ 718.55 Million in 2022, it is projected to reach US$ 1,786.05 Million by 2030.
What is the CAGR for North America Non-Dairy Yogurt Market by (2022 - 2030)?
As per our report North America Non-Dairy Yogurt Market, the market size is valued at US$ 718.55 Million in 2022, projecting it to reach US$ 1,786.05 Million by 2030. This translates to a CAGR of approximately 12.1% during the forecast period.
What segments are covered in this report?
The North America Non-Dairy Yogurt Market report typically cover these key segments-
Source (Almond, Soy, Coconut, Oat)
Type (Flavored, Plain)
Nature (Organic, Conventional)
Distribution Channel (Supermarkets and Hypermarkets, Convenience Stores, Online Retail)
What is the historic period, base year, and forecast period taken for North America Non-Dairy Yogurt Market?
The historic period, base year, and forecast period can vary slightly depending on the specific market research report. However, for the North America Non-Dairy Yogurt Market report:
Historic Period : 2020-2021
Base Year : 2022
Forecast Period : 2023-2030
Who are the major players in North America Non-Dairy Yogurt Market?
The North America Non-Dairy Yogurt Market is populated by several key players, each contributing to its growth and innovation. Some of the major players include:
The Hain Celestial Group Inc
Danone SA
Springfield Creamery Inc
Lyrical Foods Inc
Valio Ltd
Oatly Group AB
Daiya Foods Inc
Forager Project LLC
Harmless Harvest Inc
Who should buy this report?
The North America Non-Dairy Yogurt Market report is valuable for diverse stakeholders, including:
Investors: Provides insights for investment decisions pertaining to market growth, companies, or industry insights. Helps assess market attractiveness and potential returns.
Industry Players: Offers competitive intelligence, market sizing, and trend analysis to inform strategic planning, product development, and sales strategies.
Suppliers and Manufacturers: Helps understand market demand for components, materials, and services related to concerned industry.
Researchers and Consultants: Provides data and analysis for academic research, consulting projects, and market studies.
Financial Institutions: Helps assess risks and opportunities associated with financing or investing in the concerned market.
Essentially, anyone involved in or considering involvement in the North America Non-Dairy Yogurt Market value chain can benefit from the information contained in a comprehensive market report.


 Get Free Sample For North America Non-Dairy Yogurt Market


