Analysis - by Type (Power Discrete, Power Module, and Power IC), Material [Silicon (SI), Silicon Carbide (SIC), Gallium Nitride (GAN), and Others], and Industry Vertical (ICT, Automotive & Transportation, Consumer Electronics, Industrial, Energy & Power, and Others)
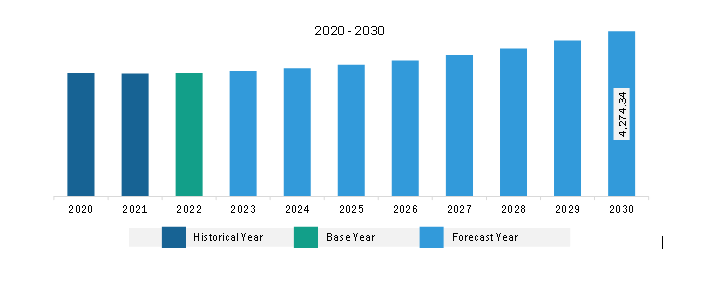
The Middle East & Africa power electronics market was valued at US$ 3,201.25 million in 2022 and is expected to reach US$ 4,274.34 million by 2030; it is estimated to record a CAGR of 3.7% from 2022 to 2030.
Growing Adoption of Smart Grid Technology Bolsters Middle East & Africa Power Electronics Market
The smart grid can help transform the topology and power system operation of electrical networks. Power electronics are used to control the flow of power in the smart grid to ensure the reliability as well as stability of the smart grids by allowing for more effective and efficient energy management. Various power electronic devices such as metal oxide silicon field effect transistors (MOSFET), insulated gate bipolar junction transistors (IGBT), triode as an AC switch (TRIAC), gate turn off thyristor (GTO), and integrated gate commutated thyristors (IGCT), among others, has a high voltage handling and high current carrying capacity. These power electronics have higher switching frequencies, which is beneficial in the conversion of voltage magnitude and frequency control by allowing control of power flow; it also increases its implementation in smart grids. Government investment in microgrid projects, infrastructure, and power generation is on the rise. For instance, the International Renewable Energy Agency (IRENA) in the US plans to invest US$ 52 billion annually in infrastructure and power generation to provide electricity for everyone by 2030. This investment equals 3.4% of the average annual global energy sector investment. The expansion of the power generation industry increased the demand for power electronics for controlling power flow.
Middle East & Africa Power Electronics Market Overview
The UAE is a major producer of oil & gas, but it is also investing heavily in renewable energy. The country has set a target of generating 14.2 gigawatts of its electricity from renewable sources by 2030. This is driving the demand for power electronics, which are used to convert and control the electricity generated from renewable sources. Moreover, according to the Ministry of Energy and Infrastructure, the country will invest between US$ 40.8 billion (AED 150 billion) and US$ 54.4 billion (AED 200 billion) by 2030 to ensure that all energy demand is fulfilled while sustaining economic growth. Therefore, the rising investment in renewable energy in the country is driving the market growth of power electronics.
Middle East & Africa Power Electronics Market Revenue and Forecast to 2030 (US$ Million)
Middle East & Africa Power Electronics Market Segmentation
Based on type, the Middle East & Africa power electronics market is categorized into power discrete, power module, and power IC. The power module segment held the largest market share in 2022.
In terms of material, the Middle East & Africa power electronics market is categorized into Silicon (SI), Silicon Carbide (SIC), Gallium Nitride (GAN), and others. The Silicon Carbide (SIC) segment held the largest market share in 2022.
By industry vertical, the Middle East & Africa power electronics market is segmented into ICT, automotive & transportation, consumer electronics, industrial, energy & power, and others. The consumer electronics segment held the largest market share in 2022.
By country, the Middle East & Africa power electronics market is segmented into the UAE, South Africa, Saudi Arabia, and the Rest of Middle East & Africa. The UAE dominated the Middle East & Africa power electronics market share in 2022.
Vishay Intertechnology Inc; Toshiba Electronic Devices & Storage Corp; Littelfuse, Inc; Renesas Electronics Corp; Fuji Electric Co Ltd; Mitsubishi Electric Corp; STMicroelectronics NV; and Infineon Technologies AG are among the leading companies operating in the Middle East & Africa power electronics market.
Middle East & Africa Power Electronics Market Strategic Insights
Get more information on this report
Middle East & Africa Power Electronics Market Segmentation Analysis
Middle East & Africa Power Electronics Market Report Highlights
Middle East & Africa Power Electronics Report Scope
Report Attribute
Details
Market size in 2022
US$ 3,201.25 Million
Market Size by 2030
US$ 4,274.34 Million
CAGR (2022 - 2030)
3.7%
Historical Data
2020-2021
Forecast period
2023-2030
Segments Covered
By Type
Power Discrete
Power Module
Power IC
By Material
Silicon
Silicon Carbide
Gallium Nitride
Others
Regions and Countries Covered
Middle East and Africa
South Africa, Saudi Arabia, UAE, Rest of Middle East and Africa
Market leaders and key company profiles
Infineon Technologies AG
STMicroelectronics NV
Mitsubishi Electric Corp
Fuji Electric Co Ltd
Renesas Electronics Corp
Littelfuse, Inc
Toshiba Electronics Devices & Storage Corp
Vishay Intertechnology Inc
Get more information on this report
Middle East & Africa Power Electronics Market Country and Regional Insights
Get more information on this report
Identical Market Reports with other Region/Countries
The List of Companies - Middle East & Africa Power Electronics Market
1. Infineon Technologies AG 2. STMicroelectronics NV 3. Mitsubishi Electric Corp 4. Fuji Electric Co Ltd 5. Renesas Electronics Corp 6. Littelfuse, Inc 7. Toshiba Electronics Devices & Storage Corp8. Vishay Intertechnology Inc
Frequently Asked Questions
How big is the Middle East & Africa Power Electronics Market?
The Middle East & Africa Power Electronics Market is valued at US$ 3,201.25 Million in 2022, it is projected to reach US$ 4,274.34 Million by 2030.
What is the CAGR for Middle East & Africa Power Electronics Market by (2022 - 2030)?
As per our report Middle East & Africa Power Electronics Market, the market size is valued at US$ 3,201.25 Million in 2022, projecting it to reach US$ 4,274.34 Million by 2030. This translates to a CAGR of approximately 3.7% during the forecast period.
What segments are covered in this report?
The Middle East & Africa Power Electronics Market report typically cover these key segments-
Type (Power Discrete, Power Module, Power IC)
Material (Silicon, Silicon Carbide, Gallium Nitride, Others)
What is the historic period, base year, and forecast period taken for Middle East & Africa Power Electronics Market?
The historic period, base year, and forecast period can vary slightly depending on the specific market research report. However, for the Middle East & Africa Power Electronics Market report:
Historic Period : 2020-2021
Base Year : 2022
Forecast Period : 2023-2030
Who are the major players in Middle East & Africa Power Electronics Market?
The Middle East & Africa Power Electronics Market is populated by several key players, each contributing to its growth and innovation. Some of the major players include:
Infineon Technologies AG
STMicroelectronics NV
Mitsubishi Electric Corp
Fuji Electric Co Ltd
Renesas Electronics Corp
Littelfuse, Inc
Toshiba Electronics Devices & Storage Corp
Vishay Intertechnology Inc
Who should buy this report?
The Middle East & Africa Power Electronics Market report is valuable for diverse stakeholders, including:
Investors: Provides insights for investment decisions pertaining to market growth, companies, or industry insights. Helps assess market attractiveness and potential returns.
Industry Players: Offers competitive intelligence, market sizing, and trend analysis to inform strategic planning, product development, and sales strategies.
Suppliers and Manufacturers: Helps understand market demand for components, materials, and services related to concerned industry.
Researchers and Consultants: Provides data and analysis for academic research, consulting projects, and market studies.
Financial Institutions: Helps assess risks and opportunities associated with financing or investing in the concerned market.
Essentially, anyone involved in or considering involvement in the Middle East & Africa Power Electronics Market value chain can benefit from the information contained in a comprehensive market report.


 Get Free Sample For Middle East & Africa Power Electronics Market


